


Abstract
The organic cation transporters (OCTs) OCT1, OCT2, OCT3, novel OCT (OCTN)1, OCTN2, multidrug and toxin exclusion (MATE)1, and MATE kidney-specific 2 are polyspecific transporters exhibiting broadly overlapping substrate selectivities. They transport organic cations, zwitterions, and some uncharged compounds and operate as facilitated diffusion systems and/or antiporters. OCTs are critically involved in intestinal absorption, hepatic uptake, and renal excretion of hydrophilic drugs. They modulate the distribution of endogenous compounds such as thiamine, L-carnitine, and neurotransmitters. Sites of expression and functions of OCTs have important impact on energy metabolism, pharmacokinetics, and toxicity of drugs, and on drug–drug interactions. In this work, an overview about the human OCTs is presented. Functional properties of human OCTs, including identified substrates and inhibitors of the individual transporters, are described. Sites of expression are compiled, and data on regulation of OCTs are presented. In addition, genetic variations of OCTs are listed, and data on their impact on transport, drug treatment, and diseases are reported. Moreover, recent data are summarized that indicate complex drug–drug interaction at OCTs, such as allosteric high-affinity inhibition of transport and substrate dependence of inhibitor efficacies. A hypothesis about the molecular mechanism of polyspecific substrate recognition by OCTs is presented that is based on functional studies and mutagenesis experiments in OCT1 and OCT2. This hypothesis provides a framework to imagine how observed complex drug–drug interactions at OCTs arise. Finally, preclinical in vitro tests that are performed by pharmaceutical companies to identify interaction of novel drugs with OCTs are discussed. Optimized experimental procedures are proposed that allow a gapless detection of inhibitory and transported drugs.
I. Introduction
Before organic cation transporters (OCTs) had been cloned sodium-independent, transporter-mediated translocation of organic cations across plasma membranes was described on basis of uptake measurements with epithelial cells and plasma membrane vesicles from small intestine and kidney (Holohan and Ross, 1980; Takano et al., 1984; McKinney and Kunnemann, 1985; Koepsell, 1998). Uptake measurements in membrane vesicles indicated faciliative diffusion of organic cations across basolateral membranes and proton–organic cation exchange across luminal membranes. Measuring inhibition of absorption and secretion in rat renal proximal tubules by micropuncture studies, Ullrich et al. (1992) and David et al. (1995) reported data suggesting that sodium-independent OCTs in the luminal and basolateral membranes are polyspecific. Employing expression cloning, a polyspecific OCT, named OCT1, was cloned in 1994 from rat kidney (Gründemann et al., 1994). OCT1 was the first identified transporter of the SLC22 family that belongs to the major facilitator superfamily (MFS) (Fig. 1). Using hybridization techniques, additional OCT subtypes of the SLC22 family were cloned between 1996 and 1998. OCT2 (Slc22A2) was cloned from rat (Okuda et al., 1996), OCT3 (SLC22A3) from human (Gründemann et al., 1998) and rat (Kekuda et al., 1998), novel OCT (OCTN)1 from human (SLC22A4) (Tamai et al., 1997), and OCTN2 from human (SLC22A5) and rat (Wu et al., 1998b) (SlcA5) (Sekine et al., 1998). In 1997, cloning and basic functional characterization of human OCT (hOCT)1 and hOCT2 were reported (Gorboulev et al., 1997; Zhang et al., 1997). All of these membrane proteins transport various organic cations with different molecular structures. However, OCTN1 and OCTN2 are also highly efficient transporters for zwitterions (Tamai et al., 1997; Wagner et al., 2000; Ohashi et al., 2001, 2002; Gründemann et al., 2005). Whereas OCT1, OCT2, and OCT3 operate exclusively as facilitative diffusion systems, OCTN1 and OCTN2 also function as proton organic cation antiporters and sodium–zwitterion cotransporters, respectively (Wagner et al., 2000; Tamai et al., 2004). After initial identification of the OCT genes, OCT1–3, OCTN1, and OCTN2 were cloned from additional species, and the functional properties of several OCTs were characterized in more detail. In 2005, two human orthologs of the bacterial multidrug and toxin exclusion (MATE) family named human MATE (hMATE)1 (SLC47A1) and hMATE2 (SLC47A2) were cloned (Otsuka et al., 2005) (Fig. 1). hMATE1 was localized to the biliary membrane of hepatocytes and the brush–border membrane (BBM) of renal proximal tubules and shown to mediate proton–organic cation antiport. One functional relevant splice variant of hMATE2 called human MATE kidney-specific (MATE-K)2 was identified that is also located at the BBM of renal proximal tubules and mediates proton–cation antiport (Masuda et al., 2006).

Evolutionary relationships of OCTs of the SLC22 family that belong to the MFS superfamily like GLUT2, and OCTs of the MATE family. The relationships were calculated based on nucleotide sequence. Distance along branches is inversely related to degree of sequence identity.
Realizing the large impact of the OCTs on various physiologic functions in different organs and on pharmacokinetics of various drugs, these transporters were in the focus of intensive biochemical, physiologic, and pharmacological investigation. Studying the interaction of model cations, endogenous compounds, and drugs in transfected epithelial cells, it turned out that human OCT1, OCT2, OCT3, OCTN1, OCTN2, MATE1, and MATE-K2 have broadly overlapping but partially diverging substrate and inhibitor specificities. The impact of the individual transporters on organ-specific functions, such as intestinal absorption or secretion, biliary excretion, tubular reabsorption, and excretion of individual drugs in humans is still understood insufficiently. One reason is that in vivo measurements performed in rodents cannot be directly transferred to humans because of species differences in expression, membrane location, regulation, and substrate specificity between rodents and humans.
Employing overexpressed human OCTs in Xenopus laevis oocytes and epithelial cells, many studies were performed trying to identify the selectivity of drugs for interaction with individual transporters. This includes the screening of drugs for inhibition of transport of model cations (Suhre et al., 2005; Ahlin et al., 2008; Wittwer et al., 2013; Xu et al., 2013; Chen et al., 2017a). Due to clinical relevance of OCTs for pharmacokinetics of drugs, preclinical in vitro testing of novel drugs for interaction with hOCT1 and hOCT2 has been proposed by the International Transporter Consortium (Giacomini et al., 2010; Zamek-Gliszczynski et al., 2018) and is recommended by the American Food and Drug Administration (FDA) (https://www.fda.gov/downloads/Drugs/GuidanceComplianceRegulatoryInformation/Guidance/UCM581965.pdf) and the European Medicines Agency (EMA) (http://www.ema.europa.eu/en/docs/enGB/documentlibrary/Scientificguideline/2012/07/WC500129606.pdf). Recent data showing that the determined efficacy of drugs to inhibit transport by OCTs depends on the employed experimental conditions indicate that the currently employed procedures for preclinical in vitro testing need to be improved. For example, it was shown that the IC50 values for inhibition of hOCT2-mediated uptake were dependent on the molecular structure of the substrate used for uptake measurements (Belzer et al., 2013; Thévenod et al., 2013; Yin et al., 2016). Moreover, it was observed that inhibition of uptake of 1-methyl-4-phenylpyridinium (MPP) by rat OCT (rOCT)1 was different when uptake was measured using an incubation time of 1 second versus 2 minutes (Gorboulev et al., 2018). Also, different IC50 of rOCT1-mediated MPP uptake by tetrabutylammonium (TBuA) were obtained when MPP concentrations were employed for the uptake measurements, which were 40, 300, or 16,000 times below the apparent Michaelis Menten constant (Km) value for MPP (Gorboulev et al., 2018). The complexity of drug–drug interaction at OCTs is due to molecular mechanisms that are involved in polyspecific substrate and inhibitor recognition of these transporters. On basis of functional investigations and mutagenesis studies performed in rOCT1 and rOCT2, hypotheses concerning interactions of cations with OCTs and their translocation have been generated (Gorboulev et al., 2018; Keller et al., 2019).
In the OCTs, nonsynonymous genetic variants that impaired or abolished translocation of drugs and single-nucleotide variants (SNVs) in the promoter altering transcription have been identified. The impact of such genetic variants on pharmacokinetics of several drugs has been investigated in patients. These data provided important insight about the impact of transporters on pharmacokinetics of individual drugs. Recently, it has been recommended to include frequent functional relevant genetic variants in hOCT1 in preclinical testing (Yee et al., 2018).
In the present review, an overview of primary structures, functions, and regulations of the hOCTs will be provided. The expression of hOCTs in various tissues and tumors will be described, and the current knowledge of the localizations of OCTs in humans will be presented. In addition, data on functional traits, functional mechanisms, and structure–function relationships, including polyspecific substrate recognition of OCTs, will be reported. Moreover, compilations of reported data about apparent Km values and IC50 of endogenous substrates, environmental toxins interacting with OCTs, transported drugs, and inhibitory drugs will be provided. Thereafter, an overview of the genetic variants in hOCTs and their effects on transport properties will be given. Further on, the current knowledge of effects of genetic variants in OCTs on drug treatment and on emergence and clinical course of diseases will be compiled. Moreover, species differences between the OCTs of humans and rodents will be discussed, and knowledge of physiologic and biomedical functions of OCTs derived from studies in rodents will be reported. Finally, it will be discussed how preclinical in vitro testing of novel drugs for interactions with OCTs could be optimized to select drugs for preclinical and clinical testing on the impact of OCTs on pharmacokinetics, pharmacodynamics, and toxicity.
II. Cloning, Chromosomal Location, Functional Properties, and Regulation of Human Organic Cation Transporters
A. Human Organic Cation Transporter 1 (SLC22A1)
Three years after cloning of rOCT1 (Gründemann et al., 1994), hOCT1 was cloned (Gorboulev et al., 1997; Zhang et al., 1997). Seventy-eight percent of the amino acids in hOCT1 are identical to rOCT1. The gene of hOCT1 (SLC22A1) is located on chromosome 6q26 in neighborhood of the genes encoding hOCT2 (SLC22A2) and hOCT3 (SLC22A3) (Koehler et al., 1997; Eraly et al., 2003). The three genes are located within the insulin-like growth factor 2 receptor cluster that exhibits maternal imprinting (Zwart et al., 2001a; Monk et al., 2006). hOCT1 shows biallelic expression (Monk et al., 2006; Saito et al., 2011). With the reservation that the function of rOCT1 has been investigated in more detail compared with hOCT1 or mouse OCT (mOCT)1 (Gründemann et al., 1994; Busch et al., 1996a,b; Nagel et al., 1997; Zhang et al., 1998; Green et al., 1999), OCT1 from human and rodents appear to have the same similar basic functional properties. They transport organic cations with diverse molecular structures in a sodium- and proton-independent manner, mediate electrogenic cellular influx and efflux of organic cations under trans-zero conditions, and are driven by substrate concentration gradients and membrane potential. OCT1 also transports some noncharged compounds and is inhibited by various structurally different compounds that are not transported (Tables 1–4).
Model substrates of human organic cation transporters
Charge of major microspecies at pH 7.4 was calculated with program MarvinSketch version 19.3 of ChemAxon (https://chemaxon.com/products/marvin). ASP: Biermann et al., 2006; Grigat et al., 2009; Ahlin et al., 2011; Kido et al., 2011; Wittwer et al., 2013; Chen et al., 2017a; Sandoval et al., 2018, DAPI (4′,6-diamidino-2-phenylindole): Yasujima et al., 2010, 2011, fluoro-L-α-methyltyrosine: Wei et al., 2016, fluoromethylcholine: Visentin et al., 2017b, 2018, MPP: Gorboulev et al., 1997; Zhang et al., 1997; Ohashi et al., 1999; Wu et al., 2000; Bednarczyk et al., 2003; Gründemann et al., 2003; Otsuka et al., 2005; Sata et al., 2005; Masuda et al., 2006; Tanihara et al., 2007; Lee et al., 2009; Zolk et al., 2009a; Astorga et al., 2012; Belzer et al., 2013; Bexten et al., 2015; Lechner et al., 2016; Martínez-Guerrero et al., 2016, NBD-MTMA: Belzer et al., 2013; Martínez-Guerrero and Wright, 2013; Martínez-Guerrero et al., 2016; Sandoval et al., 2018, N-metyl-quinidine: Van Montfoort et al., 2001, rhodamine 123: Jouan et al., 2014; Lechner et al., 2016, TEA: Gorboulev et al., 1997; Zhang et al., 1997; Tamai et al., 1998; Ohashi et al., 2002; Bednarczyk et al., 2003; Peltekova et al., 2004; Bourdet et al., 2005; Otsuka et al., 2005; Masuda et al., 2006; Geier et al., 2007; Tanihara et al., 2007; Umehara et al., 2007; Cheng et al., 2009; Ming et al., 2009; Ohta et al., 2009; Astorga et al., 2012; Belzer et al., 2013; Hendrickx et al., 2013; Sandoval et al., 2018.
Endogeneous compounds, including metabolites and nontoxic nutrient components that are transported by human organic cation transporters
Charge of major microspecies at pH 7.4 was calculated with program MarvinSketch of ChemAxon. Acetylcholine: Lips et al., 2005; Pochini et al., 2012, acetyl-L-carnitine: Ohashi et al., 1999, agmatine: Gründemann et al., 2003; Astorga et al., 2012, amoxicillin: Parvez et al., 2018, betaine: Wu et al., 1999; Wagner et al., 2000; Urban et al., 2007, L-carnitine: Tamai et al., 1998; Seth et al., 1999; Yabuuchi et al., 1999; Wagner et al., 2000; Ohashi et al., 2002; Peltekova et al., 2004; Grube et al., 2006; Masuda et al., 2006, D-carnitine: Ohashi et al., 1999; Wagner et al., 2000, choline: Gorboulev et al., 1997; Wu et al., 1999; Wagner et al., 2000; Bednarczyk et al., 2003; Peltekova et al., 2004; Otsuka et al., 2005; Chen et al., 2014; Pochini et al., 2015; Severance et al., 2017; Visentin et al., 2018, creatinine: Urakami et al., 2004; Masuda et al., 2006; Tanihara et al., 2007; Imamura et al., 2011; Astorga et al., 2012; Ciarimboli et al., 2012; Lepist et al., 2014, cyclo(His-Pro): Taubert et al., 2007; Tanihara et al., 2009, 2′deoxycytidine: Drenberg et al., 2017, dopamine: Busch et al., 1998; Bednarczyk et al., 2003; Amphoux et al., 2006; Zolk et al., 2009a; Zhu et al., 2010; Chen et al., 2014, ergothioneine: Gründemann et al., 2005; Grigat et al., 2009; Futatsugi et al., 2016, estrone sulfate: Tanihara et al., 2007; Lechner et al., 2016, epinephrine: Gründemann et al., 1998; Amphoux et al., 2006; Chen et al., 2014, guanidine: Ohashi et al., 1999; Wu et al., 1999, 2000; Urakami et al., 2004; Masuda et al., 2006; Tanihara et al., 2007; Kimura et al., 2009, histamine: Busch et al., 1998; Gründemann et al., 1998; Bednarczyk et al., 2003; Amphoux et al., 2006; Astorga et al., 2012; Chen et al., 2014, 6-β-hydroxycortisol: Imamura et al., 2013, lysine: Wagner et al., 2000, methionine: Wagner et al., 2000, N-1-methylnicotinamide: Gorboulev et al., 1997; Zhang et al., 1998; Wu et al., 1999; Bednarczyk et al., 2003; Peltekova et al., 2004; Masuda et al., 2006; Sakata et al., 2010; Ito et al., 2012a, norepinephrine: Busch et al., 1998; Gründemann et al., 1998; Amphoux et al., 2006; Zolk et al., 2009a; Zhu et al., 2010; Chen et al., 2014; Song et al., 2019, salsolinol: Taubert et al., 2007, serotonin: Busch et al., 1998; Otsuka et al., 2005; Amphoux et al., 2006; Zhu et al., 2010; Astorga et al., 2012; Boxberger et al., 2014; Chen et al., 2014, stachydrine: Gründemann et al., 2005, thiamine: Dutta et al., 1999; Bednarczyk et al., 2003; Masuda et al., 2006; Tanihara et al., 2007; Astorga et al., 2012; Chen et al., 2014; Kato et al., 2014; Lechner et al., 2016, trimethylamine N-oxide: Miyake et al., 2017; Teft et al., 2017, tyramine: Gründemann et al., 1998; Bednarczyk et al., 2003; Chen et al., 2014, quercetin: Lee et al., 2014b.
Toxins that are substrates of human organic cation transporters
Charge of major microspecies at pH 7.4 was calculated with program MarvinSketch of ChemAxon; IC50 values are presented in brackets. Aflatoxin: Tachampa et al., 2008, ethidium: Lee et al., 2009, monocrotaline: Tu et al., 2013, paraquat: Chen et al., 2007, 2009b; Astorga et al., 2012.
Drugs, prodrugs, and drug metabolites that are transported by human organic cation transporters
Drug metabolites are indicated in italics. Charge of major microspecies at pH 7.4 was calculated with program MarvinSketch of ChemAxon. Acyclovir: Takeda et al., 2002; Tanihara et al., 2007, albuterol: Hendrickx et al., 2013, amantadine: Busch et al., 1998; Bednarczyk et al., 2003; Amphoux et al., 2006; Tsuda et al., 2009b; Astorga et al., 2012; Sandoval et al., 2018, amiloride: Biermann et al., 2006; Ahlin et al., 2008; Choi et al., 2011; Astorga et al., 2012; Hendrickx et al., 2013, amiodarone: Hendrickx et al., 2013, amisulpride: dos Santos Pereira et al., 2014, D-amphetamine: Amphoux et al., 2006; Zhu et al., 2010; Wagner et al., 2017, apomorphine: Ahlin et al., 2008; Hendrickx et al., 2013, atecegatran: Matsson et al., 2013, atenolol: Hendrickx et al., 2013, atropine: Müller et al., 2005; Ahlin et al., 2008; Astorga et al., 2012; Chen et al., 2017b; Sandoval et al., 2018, benzamil: Hendrickx et al., 2013; berberine, Nies et al., 2008; Sun et al., 2014, buformin: Futatsugi et al., 2016, bupropion: Sandoval et al., 2018, butylscopolamine: Chen et al., 2017b, camostat: Hendrickx et al., 2013; Wittwer et al., 2013, captopril: Masuda et al., 2006, CDPCP: Lovejoy et al., 2008, cephradine: Tanihara et al., 2007, cephalexin: Tanihara et al., 2007, chloroquine: Zolk et al., 2009a; Müller et al., 2011; Belzer et al., 2013; Hubeny et al., 2016; Chen et al., 2017b, chlorprothixene: Hendrickx et al., 2013, cimetidine: Zhang et al., 1998; Ohashi et al., 1999; Ciarimboli et al., 2004; Peltekova et al., 2004; Suhre et al., 2005; Tahara et al., 2005; Masuda et al., 2006; Tanihara et al., 2007; Lee et al., 2009; Ohta et al., 2009; Tsuda et al., 2009b; Kido et al., 2011; Belzer et al., 2013; Hendrickx et al., 2013; Sprowl et al., 2013; Thévenod et al., 2013; Lechner et al., 2016; Martínez-Guerrero et al., 2016; Yin et al., 2016; Müller et al., 2018; Sandoval et al., 2018, cisplatin: Ciarimboli et al., 2005b; Yonezawa et al., 2006; Filipski et al., 2008; Sprowl et al., 2013, clidinium: Hendrickx et al., 2013, clofarabine: Drenberg et al., 2017, cobicistat: Lepist et al., 2014; Kikuchi et al., 2019, colistin: Visentin et al., 2017a, cycloguanil: van der Velden et al., 2017; Matthaei et al., 2019, cytarabine: Drenberg et al., 2017, diltiazem: Ahlin et al., 2008; Umehara et al., 2008; Tsuda et al., 2009b; Grube et al., 2011; Hendrickx et al., 2013, diphenylhydramine: Müller et al., 2005; Tsuda et al., 2009b; Zolk et al., 2009a; Belzer et al., 2013; Boxberger et al., 2014, 2018, disopyramide: Zhang et al., 1998; Hasannejad et al., 2004; Ahlin et al., 2008; Tsuda et al., 2009b; Zolk et al., 2009b; Kido et al., 2011; Belzer et al., 2013; Hendrickx et al., 2013, emtricitabine: Minuesa et al., 2009; Reznicek et al., 2017; Zeng et al., 2019, entecavir: Yang et al., 2016; Ma et al., 2017, ethambutol: Parvez et al., 2018, etilefrine: Müller et al., 2005, etoposide: Hu et al., 2012, famotidine: Bourdet et al., 2005; Sata et al., 2005; Tahara et al., 2005; Tsuda et al., 2009b; Astorga et al., 2012; Wittwer et al., 2013; Lechner et al., 2016; Martínez-Guerrero et al., 2016, fampridine: Xiao et al., 2018, fenoterol: Hendrickx et al., 2013; Tzvetkov et al., 2018, fexofenadine: Matsushima et al., 2009, fludarabine: Drenberg et al., 2017, fluorouracil: Drenberg et al., 2017, fluoxetine: Tzvetkov et al., 2013; Boxberger et al., 2014, 2018; Sandoval et al., 2018; Zhu et al., 2018, formoterol: Hendrickx et al., 2013; Tzvetkov et al., 2018, furamidine, Ming et al., 2009, gabapentin: Urban et al., 2008; Futatsugi et al., 2016, ganciclovir: Takeda et al., 2002; Tanihara et al., 2007, gentamicin: Gai et al., 2016, gemcitabine: Drenberg et al., 2017, glycopyrrolate: Hendrickx et al., 2013, ifosfamid: Ciarimboli et al., 2011, homatropine: Chen et al., 2017b, imatinib: Tanihara et al., 2009; Kido et al., 2011; Minematsu and Giacomini, 2011; Schmidt-Lauber et al., 2012; Wittwer et al., 2013; Boxberger et al., 2014; Nies et al., 2014; Blanc Mettral et al., 2019, indacaterol: Hendrickx et al., 2013; ipratropium: Zolk et al., 2009b; Nakamura et al., 2010a; Kido et al., 2011; Belzer et al., 2013; Hendrickx et al., 2013; Chen et al., 2017b, ketamine: Hendrickx et al., 2013; Keiser et al., 2018, lamivudine: Jung et al., 2008; Minuesa et al., 2009; Chen et al., 2017b, lappaconitine: Hendrickx et al., 2013, levofloxacin: Okuda et al., 2006; Tanihara et al., 2007, lidocaine: Hasannejad et al., 2004; Peltekova et al., 2004; Umehara et al., 2008, memantine: Busch et al., 1998; Amphoux et al., 2006; Ahlin et al., 2008; Hendrickx et al., 2013, mepenzolate: Hendrickx et al., 2013, metformin: Bourdet et al., 2005; Kimura et al., 2005, 2009; Masuda et al., 2006; Tanihara et al., 2007; Chen et al., 2009b, 2010a, 2017b; Nies et al., 2009; Zolk et al., 2009a; Meyer zu Schwabedissen et al., 2010; Astorga et al., 2012; Belzer et al., 2013; Hendrickx et al., 2013; Nakamichi et al., 2013; Futatsugi et al., 2016; Lechner et al., 2016; Martínez-Guerrero et al., 2016; Sandoval et al., 2018, metamphetamine: Wagner et al., 2017, metoclopramide: Ahlin et al., 2008; Hendrickx et al., 2013; Matthaei et al., 2016, mildronate: Grube et al., 2006; Grigat et al., 2009, nadolol: Misaka et al., 2016, naratriptan: Matthaei et al., 2016, nitidine: Li et al., 2014, nizatidine: Hendrickx et al., 2013, morphine: Ahlin et al., 2008; Tzvetkov et al., 2013; Zhu et al., 2018, oxophenonium: Hendrickx et al., 2013, oxaliplatin: Yonezawa et al., 2006; Yokoo et al., 2007, 2008; Jong et al., 2011; Sprowl et al., 2013, oxytrospium: Wenge et al., 2011, pentamidine: Jung et al., 2008; Ming et al., 2009; Kido et al., 2011; Wittwer et al., 2013, perphenazine: Hendrickx et al., 2013, phenamil: Hendrickx et al., 2013, phenformin: Dresser et al., 2002; Suhre et al., 2005; Astorga et al., 2012; Hendrickx et al., 2013; Futatsugi et al., 2016, picoplatin: More et al., 2010, pindolol: Bednarczyk et al., 2003; Umehara et al., 2008; Hendrickx et al., 2013, pirbuterol: Tzvetkov et al., 2018, pivaloylcarnitine: Ohnishi et al., 2008, pramipexole: Knop et al., 2015, prazosin: Hayer-Zillgen et al., 2002; Ahlin et al., 2008, 2011; Minematsu et al., 2010; Hendrickx et al., 2013; Wittwer et al., 2013; Moss et al., 2015, procaterol: Hendrickx et al., 2013, procainamide: Gorboulev et al., 1997; Zhang et al., 1998; Wu et al., 2000; Bednarczyk et al., 2003; Hasannejad et al., 2004; Masuda et al., 2006; Tanihara et al., 2007; Umehara et al., 2008; Astorga et al., 2012; Hendrickx et al., 2013, proguanil: Astorga et al., 2012; van der Velden et al., 2017; Matthaei et al., 2019, propranolol: Dudley et al., 2000; Urakami et al., 2004; Ahlin et al., 2008; Santini et al., 2008; Umehara et al., 2008; Zolk et al., 2009a,b; Grube et al., 2011; Astorga et al., 2012; Belzer et al., 2013; Hendrickx et al., 2013; Matthaei et al., 2016, prothionamide: Parvez et al., 2018, pyrilamine: Ohashi et al., 1999, 2002; Yabuuchi et al., 1999; Grigat et al., 2007, quinine: Gorboulev et al., 1997; Müller et al., 2005; Masuda et al., 2006; Tanihara et al., 2007; Ahlin et al., 2008; Grigat et al., 2009; Astorga et al., 2012; Tzvetkov et al., 2012; Hubeny et al., 2016; van der Velden et al., 2017, quinidine: Ohashi et al., 1999, 2002; Bednarczyk et al., 2003; Hasannejad et al., 2004; Peltekova et al., 2004; Bourdet et al., 2005; Masuda et al., 2006; Grigat et al., 2007, 2009; Ahlin et al., 2008, 2011; Umehara et al., 2008; Tsuda et al., 2009b; Zolk et al., 2009a; Minematsu et al., 2010; Astorga et al., 2012; Belzer et al., 2013; Hendrickx et al., 2013; Lechner et al., 2016; Sandoval et al., 2018, ranitidine: Bednarczyk et al., 2003; Bourdet et al., 2005; Müller et al., 2005; Tahara et al., 2005; Tsuda et al., 2009b; Meyer zu Schwabedissen et al., 2010; Astorga et al., 2012; Hendrickx et al., 2013; Martínez-Guerrero et al., 2016, relebactam: Chan et al., 2019, ribavirin: Drenberg et al., 2017, rizatriptan: Matthaei et al., 2016, salbumatol: Salomon et al., 2015; Tzvetkov et al., 2018, saracatinib: Harrach et al., 2017, selegiline: Hendrickx et al., 2013, sulpiride: dos Santos Pereira et al., 2014; Bai et al., 2017a; Li et al., 2017; Takano et al., 2017, sumatriptan: Hendrickx et al., 2013; Matthaei et al., 2016, terazosine: Ahlin et al., 2008; Hendrickx et al., 2013, terbutaline: Hendrickx et al., 2013; Tzvetkov et al., 2018, tetracycline: Tanihara et al., 2007, tiotropium: Nakamura et al., 2010a; Hendrickx et al., 2013, triamterene: Hendrickx et al., 2013, tropisetron: Tzvetkov et al., 2012, 2013, topotecan: Tanihara et al., 2007; Wittwer et al., 2013; Lechner et al., 2016, trimethoprim: Urakami et al., 2004; Sata et al., 2005; Ahlin et al., 2008; Jung et al., 2008; Belzer et al., 2013; Hendrickx et al., 2013; Lepist et al., 2014; Lechner et al., 2016; Martínez-Guerrero et al., 2016; Chen et al., 2017a; Sandoval et al., 2018; Kito et al., 2019, trospium: Choi et al., 2011; Wenge et al., 2011; Bexten et al., 2015; Hacker et al., 2015; Chen et al., 2017b, valproylcarnitine: Ohnishi et al., 2008, varenicline: Feng et al., 2008; Hendrickx et al., 2013, verapamil: Zhang et al., 1998; Yabuuchi et al., 1999; Wagner et al., 2000; Ohashi et al., 2002; Peltekova et al., 2004; Grube et al., 2006, 2011; Grigat et al., 2007, 2009; Ahlin et al., 2008, 2011; Tsuda et al., 2009b; Zolk et al., 2009b; Minematsu et al., 2010; Astorga et al., 2012; Belzer et al., 2013; Hendrickx et al., 2013; Tzvetkov et al., 2013; Boxberger et al., 2014; Jouan et al., 2014; Bexten et al., 2015; Parvez et al., 2018; Sandoval et al., 2018; Zhu et al., 2018, xamoterol: Hendrickx et al., 2013, zolmitriptan: Matthaei et al., 2016.
The expression of hOCT1 is regulated at different levels, including transcription, intracellular trafficking, and modification of functional properties. Binding of regulatory proteins to the promoter and to intron 1 is involved in the regulation of hOCT1 transcription. The upstream binding stimulating factors (USF)1 and USF2, hepatic nuclear factor (HNF)4α, and CCAAT/enhancer-binding proteins β bind to the promoter (Saborowski et al., 2006; Kajiwara et al., 2008; Rulcova et al., 2013), whereas HNF1 binds to an evolutionary conserved region within intron 1 (O’Brien et al., 2013). HNF4α is involved in bile acid–dependent regulation of hOCT1 in the liver via activation by the bile acid–inducible transcriptional repressor (Saborowski et al., 2006). Dexamethasone increases HNF4α expression and thereby causes upregulation of hOCT1 mRNA in hepatocytes (Rulcova et al., 2013). Because hOCT1 abundance in liver is correlated with expression of HNF1 that is highly expressed in liver (Kamiyama et al., 2007), HNF1 is supposed to be involved in liver-specific expression of this transporter. Variation in hepatic HFN1 expression may contribute to the high variability of hOCT1 expression in liver (O’Brien et al., 2013). The activity of the hOCT1 promoter is also regulated by methylation. A higher methylation of the hOCT1 promoter in hepatocellular carcinoma cells than in normal hepatocytes was associated with low abundance of hOCT1 mRNA (Okabe et al., 2001; Chang et al., 2009; Schaeffeler et al., 2011). Finally, it has been reported that hepatic growth factor, which binds to the c-MET membrane receptor tyrosine kinase, downregulates the expression of hOCT1 mRNA in human hepatocytes (Le Vee et al., 2009). Of note, downregulation of hOCT1 mRNA expression in chronic myeloid leukemia (CML) cells was observed after incubation with the tyrosine kinase inhibitor imatinib, which is used for treatment of CML (Sreenivasan Tantuan and Viljoen, 2018). Imatinib-induced downregulation of hOCT1 may contribute to its antineoplastic effect because hOCT1 transports endogeneous compounds of metabolic relevance (see Treatment of Myeloid Leukemia with Imatinib and Table 2).
Short-term posttranslational regulation of hOCT1-mediated uptake of 1 µM fluorescent organic cation 4-(4-(dimethylamino)styryl)-N-methylpyridinium (ASP) has been observed in Chinese hamster ovary cells and human embryonic kidney (HEK) cells, which had been stably transfected with hOCT1 (Ciarimboli et al., 2004). ASP uptake by hOCT1 was decreased by activation of protein kinase A (PKA) and by inhibition of calmodulin (CaM), CaM-dependent kinase II, or p56lck tyrosine kinase. In these studies, it was not distinguished whether the plasma membrane abundance of hOCT1 and/or the turnover of the transporter was (were) changed. Nevertheless, the observation that the efficacy for inhibition of hOCT1-mediated ASP uptake by tetraethylammonium (TEA) was increased after inhibition of CaM indicates an impact of CaM on functional properties of hOCT1. Post-translational downregulation of hOCT1 in the plasma membrane by the ischemia/reperfusion-inducible protein (IRIP) that binds to regulatory protein RS1 has been reported (Li et al., 2013). RS1 has been shown to be involved in the downregulation of the release of various transporters from the Golgi (Veyhl et al., 2006; Veyhl-Wichmann et al., 2016).
B. Human Organic Cation Transporter 2 (SLC22A2)
hOCT2 exhibiting 70% amino acids identical to hOCT1 has been cloned in 1997 (Gorboulev et al., 1997). The gene is located on chromosome 6q26 in neighborhood of SLC22A1 (Koehler et al., 1997; Eraly et al., 2003). After expression of hOCT2 in oocytes, highly active, sodium-independent, and electrogenic cation transport was observed similar to rOCT1 and rOCT2 (Busch et al., 1996b, 1998; Okuda et al., 1999; Arndt et al., 2001). It was found that hOCT2 transports several cations and noncharged compounds, which are also transported by hOCT1 showing partially different apparent Km values (Table 4). In addition, evidence was provided that hOCT2 transports cations in both directions across the plasma membrane, as was shown for rOCT1, hOCT1, and rOCT2 (Nagel et al., 1997; Busch et al., 1998; Zhang et al., 1998; Budiman et al., 2000).
Basal transcription of hOCT2 is activated by the binding of upstream stimulation factor 1 to an E-box in the hOCT2 promoter (Asaka et al., 2007a). This effect is blunted by epigenetic hypermethylation of CpG islands (CGI) in the promoter (Aoki et al., 2008). The active hOCT2 promoter in kidney is characterized by hypomethylation of a CGI in the E-box, whereas the hOCT2 promoter in the liver and in renal carcinoma cells, where no or low hOCT2 mRNA expression is observed, is hypermethylated (Liu et al., 2016b). In the active promoter, c-Myc protein (MYC) binds to the unmethylated CGI and recruits methylase mixed-lineage-leucemia 1 (MLL1). MLL1 catalyzes trimethylation of lysine 4 on histone 3, which is associated with chromatin activation (Liu et al., 2016b). After hypermethylation of the CGI in the E-box, binding of HNF1 and MYC as well as trimethylation of histone 3 are prevented. In the placenta, maternal imprinting of hOCT2 has been demonstrated (Monk et al., 2006; Saito et al., 2011). In samples with biallelic hOCT2 transcription, higher expression of hOCT2 mRNA was observed compared with samples showing monoallelic expression, and expression was correlated with trimethylation of histone H3 (Saito et al., 2011).
Short-term effects of inhibitors of various kinases and of CaM on transport activity of hOCT2 expressed in HEK293 cells have been described. Thus, hOCT2-mediated uptake of ASP was decreased after stimulation of phosphatidylinositol-3-kinase (PI3K), protein kinase A (PKA), or protein kinase C (PKC), and after inhibition of CaM or Ca2+/CaM-dependent kinase II (Çetinkaya et al., 2003; Biermann et al., 2006). In isolated human renal tubules, downregulation of hOCT2-mediated basolateral ASP uptake into the tubules was observed after stimulation of PKC or PKA (Pietig et al., 2001). Whereas the reasons for the observed impact of PI3K, PKA, and PKC on hOCT2-mediated uptake were not investigated, data were obtained that suggest that plasma membrane abundance of hOCT2 in HEK293 cells was decreased and substrate affinity was changed after inhibition of the Ca+/CaM signaling pathway (Çetinkaya et al., 2003; Biermann et al., 2006). The existence of consensus sequences for PKC-dependent phosphorylation in hOCT2 suggests that PKC-dependent phosphorylation is involved in PKC-dependent short-term regulations, as has been demonstrated for rOCT1 (Ciarimboli et al., 2005a). Recently, it has been reported that functional activity of hOCT2 in the plasma membrane is increased by tyrosine phosphorylation via the Src-family kinase Yes1 (Sprowl et al., 2016). Inhibitors of Yes1 decreased hOCT2-mediated transport without changing hOCT2 abundance in the plasma membrane (Sprowl et al., 2016). Data have been reported that suggest that the lysosmal-associated protein 4α (LAPTM4A), the regulatory protein RS1, and the ischemia/reperfusion-inducible protein IRIP are involved in intracellular trafficking of hOCT2 (Veyhl et al., 2003, 2006; Jiang et al., 2005; Grabner et al., 2011; Veyhl-Wichmann et al., 2016). Because it was observed that LAPTM4A binds to hOCT2, that LAPTM4A is colocated with hOCT2 within intracellular vesicles, and that it decreases the amount of hOCT2 in the plasma membrane, LAPTM4A is supposed to be involved in endosomal recruitment of hOCT2 (Grabner et al., 2011). RS1 and IRIP are probably involved in regulation of the exocytotic pathway of hOCT2. IRIP binds to RS1 and downregulates expression of hOCT2 (Jiang et al., 2005). Investigations on RS1 revealed that the release of the sodium-D-glucose cotransporter (SGLT) 1 and of the sodium dependent concentrative nucleoside transporter (CNT) 1 from the Golgi can be decelerated by a N-terminal domain of RS1 that contains various phosphorylation sites (Veyhl-Wichmann et al., 2016). Efficacy and selectivity of RS1-mediated regulation of transporters were shown to be steered by phosphorylation of this domain. Because in oocytes short-term downregulation of expressed hOCT2 was observed when RS1-cRNA was injected, RS1 is supposed to regulate hOCT2 similar to SGLT1 and CNT1 (Veyhl et al., 2003).
C. Human Organic Cation Transporter 3 (SLC22A3)
In 1998, hOCT3 (SLC22A1) located on chromosome 6q27 in the insulin-like growth factor 2 receptor cluster was cloned (Gründemann et al., 1998; Verhaagh et al., 1999; Zwart et al., 2001a). Fifty percent and 43% of the amino acids in hOCT3 are identical to hOCT1 and hOCT2, respectively. Like hOCT1 and hOCT2, hOCT3 mediates electrogenic transport of various cations and noncharged compounds with diverse molecular structures (Tables 1–4) (Gründemann et al., 1998; Wu et al., 2000; Massmann et al., 2014). Evidence was provided that rOCT3 mediates bidirectional electrogenic transport, as has been shown for OCT1 and OCT2 from humans and rodents (Kekuda et al., 1998). Hence, it is highly probable that hOCT3 has the same basic functional characteristics as hOCT1 and hOCT2.
Upregulation of transcription was demonstrated upon binding of transcription factors specificity protein 1 (Sp1), myeloid zinc finger 1 (MZ1), p300, or Ap4 to the basal promoter of hOCT3 located within 384 nucleotides upstream of the start codon (Chen et al., 2013). The same group showed that the transcription of hOCT3 was downregulated by methylation of the basal promoter and presented data suggesting that this epigenetic regulation is tissue specific. Recently, it has been described that Sp1 and USF1 bind to the upstream promoter and modulate transcription (Kwon et al., 2018).
Only few data on short-term regulation of hOCT3 are available. They suggest that the CaM-dependent pathway, p56lck tyrosine kinase, and phosphodiesterases are involved, whereas modulations of PKA, PKC, PI3K, and protein kinase G (PKG) activities showed no short-term effect on transport (Martel et al., 2001; Massmann et al., 2014). It has been shown that protein IRIP is involved in the posttranslational downregulation of hOCT3 (Jiang et al., 2005).
D. Human Novel Organic Cation Transporter 1 (SLC22A4)
Human OCTN (hOCTN)1 was cloned in 1997 (Tamai et al., 1997). The gene named SLC22A4 is located on chromosome 5q31 in proximity of gene SLC22A5 coding for hOCTN2 (Peltekova et al., 2004). hOCT1–3 and hOCTN1–2 form SLC22 subfamilies with relatively low similarity (Eraly et al., 2003) (Fig. 1). Only 31% of the amino acids of hOCTN1 are identical to hOCT1. hOCTN1 is a polyspecific transporter accepting various organic cations, zwitterions, and noncharged compounds as substrates (Tamai et al., 1997; Yabuuchi et al., 1999; Peltekova et al., 2004; Gründemann et al., 2005) (Tables 1, 2, and 4). Of note, uptake of cations and zwitterions by hOCTN1 is performed via different molecular mechanisms. Although hOCTN1-mediated translocation of TEA+ across the plasma membrane was mediated by proton–cation antiport (Tamai et al., 1998), hOCTN1-mediated uptake of ergothioneine and stachydrine was cis-stimulated and cis-inhibited by sodium, respectively (Gründemann et al., 2005).
With regard to regulation of hOCTN1, it has been published that binding of the Runt-related transcription factor 1 (RUNX1) to intron 1 of SLC22A4 is involved in transcriptional regulation (Tokuhiro et al., 2003).
E. Human Novel Organic Cation Transporter 2 (SLC22A5)
hOCTN2, located on chromosome 5q31, was cloned in 1998 (Tamai et al., 1998; Wu et al., 1998b). Seventy-six percent and 30% of the amino acids of hOCTN2 are identical to hOCTN1 and hOCT1, respectively. hOCTN2 is a polyspecific transporter for zwitterions such as L-carnitine and acylcarnitines, for organic cations like TEA and amisupride, and for noncharged compounds such as entecavir and etoposide (Tables 1, 2, and 4) (Pochini et al., 2019). Of note, different transport mechanisms may be employed for cellular uptake of zwitterions or cations. Evidence has been presented that hOCTN2 is an electrogenic Na+-L-carnitine cotransporter with a sodium/L-carnitine stoichiometry of one, whereas it mediates electrogenic uptake of TEA+ independently of sodium (Tamai et al., 1998, 2001; Wu et al., 1999; Wagner et al., 2000). hOCTN2 also mediates sodium-independent cellular efflux of acylcarnitines.
With regard to regulation of hOCTN2, it has been shown that binding of a heat–shock element to the promoter is involved in transcriptional regulation (Peltekova et al., 2004), and that the transcription is downregulated by promoter methylation (Qu et al., 2013). Using colon cells, evidence has been provided that the transcription of hOCTN2 was stimulated by the peroxisome proliferator-activated receptor (PPAR)γ via binding to a PPAR-response element within the first intron of hOCTN2 (D’Argenio et al., 2010). PPARγ is activated by thiazolidine-diones such as rosiglitazone. Transcription of hOCTN2 in breast cancer cells has been shown to be stimulated by estrogen involving an intronic estrogen-responsive element and an enhancer region that contains a binding site for the nuclear receptor NR4A2/Nurr1 (Wang et al., 2012).
F. Human Multidrug and Toxin Exclusion 1 (SLC47A1)
In 2005, human orthologs of the bacterial multidrug and toxin extrusion family called hMATE1 and hMATE2 were cloned and are located side by side on chromosome 17p11.2 (Otsuka et al., 2005; Moriyama et al., 2008). hMATE1 codes for a functional protein containing 570 amino acids arranged in 13 predicted transmembrane helices (TMHs) (Zhang and Wright, 2009). The transporter is acetylated at the N terminus (Van Damme et al., 2012). Transcript variants of hMATE1 missing exon 15 or exons 15 and 16 have been identified but have not been characterized (Nies et al., 2016). hMATE1 accepts various organic cations, some noncharged compounds, and some zwitterions as substrates, exhibiting overlapping specificity of cationic substrates with other hOCTs (Tables 1–4). In addition, hMATE1 is capable of transporting some organic anions; for example, it has been shown to transport estrone sulfate with an apparent Km of 0.47 mM (Tanihara et al., 2007). Evidence has been provided that hMATE1 mediates electroneutral proton–cation antiport in both directions across the plasma membrane, exhibiting a similar affinity for protons from extracellular and intracellular (Otsuka et al., 2005; Tsuda et al., 2009b; Dangprapai and Wright, 2011).
Basal transcription of the SLC47A1 gene is regulated by binding of the transcription factor Sp1 close to the transcription start site (Kajiwara et al., 2007), by binding of activation protein-1 (AP-1) and activation protein-2 repressor (AP2-rep) to the promoter region (Ha Choi et al., 2009), and by the transcription factors, natural killer homeobox-2.5, sterol regulatory element-binding protein-1, and USF-1 (Kim et al., 2013).
Concerning post-translational regulation of hMATE1, it has been described that ischemia/reperfusion-inducible protein IRIP that interacts with regulatory protein RS1 (RSC1A1) is involved in regulation of hMATE1 protein abundance in the plasma membrane (Jiang et al., 2005; Li et al., 2013).
G. Human Multidrug and Toxin Exclusion 2, Human Multidrug and Toxin Exclusion Kidney-Specific 2 (SLC47A2)
In addition to the first cloned hMATE1 ortholog called hMATE2, which comprises 602 amino acids (Otsuka et al., 2005), two shorter splice variants called human MATE2-K (hMATE2-K) and hMATE2-B were cloned and characterized (Masuda et al., 2006). hMATE2-K contains 566 amino acids and is functionally active, whereas hMATE2-B contains 209 amino acids and does not mediate transport. hMATE2 and hMATE2-K have 48% and 52% amino acid identity with hMATE1, respectively. Transport activity of hMATE2 was demonstrated after reconstitution of the transporter into proteoliposomes (Komatsu et al., 2011). After expression in HEK293 cells, hMATE2 has been localized to intracellular vesicles and no transporter-mediated cellular uptake could be detected (Komatsu et al., 2011). Future experiments are required to clarify whether hMATE2 plays a role for cation uptake into intracellular compartments and whether it can be targeted to the plasma membrane in vivo. Like hMATE1, hMATE2-K is a polyspecific transporter of organic cations and zwitterions and noncharged compounds, showing broadly overlapping substrate selectivity with hMATE1 (Tables 1–4) (Tanihara et al., 2007; Astorga et al., 2012). Similar to hMATE1, hMATE-K2–mediated organic cation transport is stimulated by an opposed proton gradient (Masuda et al., 2006). It has been reported that hMATE2-K has a higher affinity for protons than hMATE1 (Astorga et al., 2012).
The transcription of hMATE2-K was shown to be repressed by binding of the transcription factor MZ1 to the promoter (Choi et al., 2011).
III. Structure–Function Relationships in Organic Cation Transporters
A. Primary Structures and Membrane Topology of Human Organic Cation Transporters
The OCTs, OCT1, OCT2, OCT3, OCTN1, and OCTN2, are members of the SLC22 family, which belongs to the MFS (Pao et al., 1998) (Fig. 1). The OCTs of the SLC22 family have 12 predicted TMHs with intracellular NH2 and COOH termini (Fig. 2A). They contain a large extracellular loop between TMH1 and TMH2 and a large intracellular loop between TMH6 and TMH7. The large extracellular loop comprises four or six cysteine residues, which may form disulfide bridges (Keller et al., 2011; Brast et al., 2012) and at least one consensus sequence for N-glycosylation. The large intracellular loop contains consensus sequences for phosphorylation (Koepsell et al., 1999). The OCTs hMATE1 and hMATE2-K are members of the SLC47 family, which also belongs to the MATE family like transporter NorM from Vibrio cholera (He et al., 2010) and transporter MATE from Pyrococcus furiosus (PfMATE) (Tanaka et al., 2013) (Fig. 1). Different from the OCTs of the SLC22 family, NorM and PfMATE, hMATE1, and hMATE2-K contain an additional 13th C-terminal TMH, a large intracellular loop between TMH12 and TMH13, and a short extracellular C terminus (Fig. 2B) (Zhang and Wright, 2009; Zhang et al., 2012).

Predicted membrane topology of human OCTs (A) belonging to the SLC22 family and of hMATE1 (B) that belongs to the MATE family of transporters.
B. Solved Crystal Structures of Transporters of the Major Facilitator Superfamily and Multidrug and Toxin Exclusion Family
Crystal structures of bacterial and fungal transporters of the MFS and of the MATE family have been solved that are in four different conformations (Bai et al., 2017b). These include the L-fucose symporter FucP from Escherichia coli (Dang et al., 2010), the D-xylose–proton symporter XylE from E. coli (Sun et al., 2012), the MATE transporters NorM from V. cholerae (He et al., 2010), and transporter PfMATE (Tanaka et al., 2013) in outward-open conformations; the lactose–proton symporter LacY from E. coli in outward-facing occluded state (Kumar et al., 2014); the multidrug transporter EmrD from E. coli in an occluded state (Yin et al., 2006), the oligopeptide-H+ symporters PepTso from Shewanella oneidensis (Newstead et al., 2011), and the high-affinity phosphate transporter PiPT from Piriformospora indica (Pedersen et al., 2013) in inward-facing, occluded conformations; and LacY from E. coli (Abramson et al., 2003), the glycerol-3-phosphate-phosphate antiporter GlpT from E. coli (Huang et al., 2003), and the peptide–proton symporter PepTst from Streptococcus thermophiles (Solcan et al., 2012) in inward-open conformations. Examples for resolved structures in different conformations are depicted in previous reviews (Yan, 2013; Bai et al., 2017b). The resolved three-dimensional (3D) structures have the following basic features: they consist of two closely associated domains comprising the six N-terminal and six C-terminal TMHs. Both domains exhibit some sequence homology and are supposed to originate from gene duplication or a fusion event (Maiden et al., 1987). The translocation pathway is formed by the contact regions of both transporter domains that saddle the substrate binding site(s). Different from most TMHs that are straight, individual TMHs are bended. Bending of TMHs and changing of intramolecular TMH positioning are supposed to be associated with transport-related structural changes. To date, no crystal structures of an individual transporter in the outward-open, occluded, and inward-open conformation are available; however, for lactose permease LacY of E. coli, outward-facing occluded and inward-open conformations have been crystallized, an occluded compact structure has been predicted by molecular dynamic simulations and double electron-electron resonance measurements, and an outward-open conformation has been modeled assuming a rigid-body movement of both transporter parts during transition from the inward-open to the outward-open conformation (Abramson et al., 2003; Holyoake and Sansom, 2007; Smirnova et al., 2007; Kumar et al., 2014). Based on the available crystal structures and functional studies on different transporters of the MFS, it is generally assumed that transport by MFS and MATE transporters is combined with a series of structural changes that include the following: 1) a conformation with (a) substrate binding site(s) that is (are) accessible from the cis side of the plasma membrane, 2) a conformation in which the substrate(s) is (are) occluded within the transporter, and 3) a conformation in which the substrate(s) can be released at the trans-side of the plasma membrane. Transporters of the MFS family may be uniporters, symporters, or antiporters. Uniporters transport one type of substrate and are driven by the concentration gradient of the substrate and/or the membrane potential when the substrate is charged. Symporters transport two or more substrates in the same direction across the plasma membrane, and translocation of one substrate is energetically linked to the other. Antiporters transport two or more substrates at the same time in opposite directions across the plasma membrane, and translocation of substrates in different directions is energetically linked. Considering the overall similarity of the TMH arrangement in crystallized MFS members (Pedersen et al., 2013), the different functional properties and substrate specificities of MFS transporters are supposed to originate from differences in a few residues within the substrate binding sites and translocation pathways, and from minor variations in TMH arrangements and TMH bending.
C. Homology Three-Dimensional Models of Mammalian Organic Cation Transporters
In the absence of crystal structures of mammalian MFS transporters, our vision on 3D structures of OCTs is based on homology models that were derived from the crystal structures of bacterial and fungal transporters. Homology models of the inward-open conformation have been reported for rOCT1 (Popp et al., 2005), hOCT1 (Boxberger et al., 2018), rOCT2 (Schmitt et al., 2009), rabbit OCT2 (Zhang et al., 2005), hOCT2 (Pelis et al., 2006), and hOCT3 (Chen et al., 2010a), and of the outward-open conformation for rOCT1 (Volk et al., 2009), hOCT1 (Dakal et al., 2017), mOCT3 (Song et al., 2019), and hMATE2-K (Choi et al., 2011). Due to the low amino acid identity of less than 20% between mammalian OCTs and the crystallized transporters (Table 5), the homology models can only be frameworks of mammalian OCT 3D structures. They do not allow conclusions concerning molecular interaction of substrates with individual amino acids. To this end, our molecular understanding of substrate recognition and transport mechanisms is based on mutagenesis analysis that is interpreted in the context of the homology models. In response to single-point mutation, effects on transport rates and apparent Km values of substrates, on IC50 values of inhibitors, and on KD values of a substrate were determined. The interpretation of these data is limited because the observed effects on apparent Km values do not necessarily reflect effects on substrate binding to the outward-facing conformation, that effects on IC50 values may be dependent on the employed substrate, and that binding measurements are technical difficult and may not allow to distinguish between binding to the outward-open or inward-open transporter conformation. An additional important limitation is that, rather than altering the molecular interaction of a cation, the exchange of an amino acid may exhibit an indirect effect on cation binding to a nearby or distant residue.
Modeling of tertiary structures of OCTs and hMATE2-K
The analysis of homology was performed with program EMBOSS Needle (EMBL-EBI).
D. In-Depth Functional Characterization of Organic Cation Transporter 1 and Organic Cation Transporter 2
A detailed functional characterization of rOCT1 and rOCT2 provided insight into the functional mechanisms of the OCT-subfamily OCT1–3. Using tracer uptake studies and electrical measurements in oocytes of X. laevis expressing rOCT1 or rOCT2 (Busch et al., 1996b; Nagel et al., 1997; Schmitt and Koepsell, 2005) and electrical measurements in plasma membrane in giant patches from oocytes expressing rOCT2 (Budiman et al., 2000), it was shown that rOCT1 and rOCT2 are sodium-independent electrogenic transporters that translocate organic cations in both directions across plasma membranes, and also accept individual inorganic cations as substrate. Experimental proof was provided that rOCT1 and rOCT2 operate as transporters rather than channels by demonstrating trans-stimulation. Thus, rOCT1-mediated uptake of MPP into proteoliposomes, in which the membrane potential was clamped, was stimulated by the alternative substrate choline on the trans-side (Keller et al., 2005). Measuring uptake of TEA or MPP and electrical charge simultaneously in oocytes expressing rOCT2 (Schmitt et al., 2009), charge to cation stoichiometries of about one were obtained at membrane potentials of −50 mV. This indicates absence of anorganic ion leakage at −50 mV, implying the existence of transporter conformations with occluded substrates. At a membrane potential of 0 mV, charge to cation ratios between 3 and 4 were obtained for uptake of TEA or MPP. This is interpreted to indicate cotranslocation of two or three inorganic cations under this condition.
Interaction of the nontransported inhibitors corticosterone and TBuA with rOCT2 was measured from extracellular or intracellular sides, employing intact oocytes expressing rOCT2 or inside-out giant patches from rOCT2-expressing oocytes, respectively (Volk et al., 2003). Inward currents induced by superfusion of intact oocytes with choline and outward currents induced by superfusion of inside-out oriented giant patches with choline were inhibited by addition of corticosterone or TBuA to the superfusion solutions. The data revealed that corticosterone and TBuA inhibit the choline–induced currents from extracellular and intracellular with different efficacies showing different apparent Ki values. Presuming that corticosterone and TBuA interact with the substrate-binding region of rOCT1, the results indicate that the substrate-binding region may be exposed to extracellular or intracellular surfaces, as predicted by 3D structures of crystallized MFS transporters.
Using potential-induced fluorescence changes of fluorescence-labeled rOCT1, high-affinity binding sites of TEA, MPP, and TBuA were identified (Gorbunov et al., 2008). In a rOCT1 variant in which free cysteine residues had been removed, phenyalanine 483 in TMH11 located close to the extracellular surface was replaced by cysteine, which was subsequently labeled with tetramethylrhodamine-6-maleinimide. Effects of the substrates choline, TEA, MPP, and the inhibitor TBuA on potential-induced fluorescence changes were measured, and EC50 were determined (Gorbunov et al., 2008). The data indicated that choline, TEA, and MPP not only interacted at low-affinity binding sites with EC50 values similar to the apparent Km values of the substrates (EC50: 290 µM choline, 57 µM TEA, 0.86 µM MPP) but also at an additional high-affinity site (EC50: 9 nM choline, 50 nM TEA, 24 pM MPP). For TBuA, three interaction sites with EC50 values of 1 pM, 32 nM, and 277 nM were obtained.
E. Mutagenesis Studies in Rat Organic Cation Transporter 1, Rat Organic Cation Transporter 2, and Human Organic Cation Transporter 2
In rOCT1, detailed mutagenesis experiments were performed that induced effects on structure, transport activity, and substrate selectivity. These studies increased the understanding of structure–function relationship in OCT1–3. Some mutations were also studied in rOCT2 and hOCT2.
The impact of the large extracellular loop of rOCT1 on oligomerization and transport was investigated (Keller et al., 2011). The large extracellular loop located between TMH1 and TMH2 contains six cysteine residues that are conserved in OCT1–3 and form disulfide bridges (Pelis et al., 2012). It was observed that cell-free–expressed rOCT1 solubilized with mild detergents formed oligomers. Oligomerization of rOCT1 was also detected when the transporter was expressed in HEK293 cells (Keller et al., 2011). In these studies, it could not be distinguished whether rOCT1 forms homodimers or homo-oligomers. Precipitation experiments were performed with conjointly expressed, differentially tagged rOCT1 wild-type (WT) and rOCT1 variants. In the variants, either the large extracellular loop of rOCT1 was replaced by the respective loop of rat organic anion transporter (OAT)1, or cysteine residues in the large extracellular loop of rOCT1 were exchanged for serines. The obtained data indicate that the structure of the large extracellular loop, and in particular the integrity of four cysteine residues in this loop, is required for oligomerization. Disulfide bridging between the cysteines is required for oligomerization because no oligomer formation was observed in the presence of dithiothreitol. The data are consistent with a dimeric quarternary structure of rOCT1 in the plasma membrane, as has been shown for several bacterial transporters of the MFS (Veenhoff et al., 2001; Safferling et al., 2003). A series of experiments was performed trying to evaluate whether the rOCT1 monomers transport independently (Keller et al., 2011). To this end, Vmax and apparent Km values measured in proteoliposomes containing rOCT1 WT versus nonoligomerizing rOCT1 loop variants were compared. In addition, Vmax and Km values of rOCT1 reconstituted into proteoliposomes or expressed in oocytes were measured in absence and presence of dithiothreitol. Moreover, Vmax and Km values of a rOCT1-tandem protein mimicking the rOCT1 dimer were measured when both rOCT1 molecules were functional, or when one molecule was blocked by modification of a cysteine residue that had been introduced into the substrate-binding region. The data indicate that rOCT1 monomers can operate independently, as has been described for bacterial transporters of the MFS (Ambudkar et al., 1990; Auer et al., 2001). They suggest that the structure of the large loop has some minor impact on Km and turnover of the transporter. Oligomerization and the critical role of the sulfhydryl groups in the large extracellular loop for oligomerization have also been described for hOCT2 (Brast et al., 2012).
In rOCT1, effects of point mutations on velocity and selectivity of transport, selectivity of inhibitors, and binding of MPP were investigated in detail. In an early study, Asp475 in the middle of TMH 11 (Fig. 3) was replaced by glutamate, and effects on apparent Km values and Vmax values of choline, TEA, N1-methylnicotinamide, and MPP, and on IC50 values of some inhibitors were investigated (Gorboulev et al., 1999). Asp475 is conserved in OCT1–3, whereas OCTN1, OCTN2, and the organic anion transporters OAT1–3 contain the positively charged arginine residue in this position. The Asp475Glu mutant of rOCT1 showed 89% to 98% reduced Vmax values, although targeting of the transporter to the plasma membrane was not largely impaired. The apparent Km values for choline, TEA, and N1-methylnicotinamide were decreased 4- to 15-fold, whereas the apparent Km value for MPP was not altered. The IC50 values for inhibition of 10 µM TEA uptake by the nontransported inhibitors TBuA and tetrapentylammonium (TPeA) were decreased 5-fold. The data suggested a central role of Asp475 for substrate binding of structurally different substrates. Because it has been recently shown that Asp475 is directly involved in MPP binding to a transport-related low-affinity MPP binding site (Keller et al., 2019), Asp475 probably interacts with all cationic substrates during translocation.

Views into the modeled outward-open (upper panel) and inward-open (lower panel) binding cleft of rOCT1. Modeling was performed, as described (Popp et al., 2005; Volk et al., 2009). Trp218, Arg440, and Asp475 located within the inner parts of the modeled outward-open and inward-open clefts are indicated.
In this binding study, MPP binding was measured to fusion proteins of green fluorescent protein (GFP) with rOCT1 WT (GFP-rOCT1) or rOCT1 mutants (Keller et al., 2019). The GFP fusion proteins were generated by cell-free expression and incorporated into nanodiscs during translation. Measurements of MPP uptake into proteoliposomes were performed in parallel. The nanodiscs were formed by dialysis from solubilized mixtures of lipids and a nondimerizing variant of the membrane scaffold protein 1. In nanodiscs formed with appropriate lipids, per rOCT1 monomer about two low-affinity MPP binding sites with a common apparent dissociation constant (KD) of 36 µM and one high-affinity MPP binding site with a KD of 0.23 µM were determined. The same data were obtained when oligomerization of GFP-rOCT1 was prevented by replacement of the cysteines in the large extracellular loop of rOCT1. The apparent KD of the low-affinity binding was similar to the apparent Km value (19 µM) obtained for MPP transport in proteoliposomes. Of note, the apparent Km values for MPP uptake measured after reconstitution of rOCT1 or GFP-rOCT into proteoliposomes were similar; however, they were about 10-fold higher than the apparent Km values for MPP uptake that were determined after expression of rOCT1 in oocytes or HEK293 cells.
Asp475 belongs to a rOCT1 motif of five amino acids in positions 474–478 that are located in the middle of TMH11. Cys474, Asp475, Gly477, and Gly478 are conserved in OCT1–3. Cys474, Asp475, and Gly478 are supposed to interact directly with substrates during transport somehow lining the transport path. As observed after replacement of Asp475 in rOCT1 by glutamate, after replacement of Cys474 in hOCT2 with alanine, the Vmax values for transport of TEA and MPP were decreased, the apparent Km for TEA was decreased, and the apparent Km for MPP was not altered (Pelis et al., 2012). In addition, some evidence was provided that Cys474 in hOCT2 contacts the aqueous phase because it could be modified by the hydrophilic sulfhydryl group reagent (+)-biotinyl-3-maleimidopropionamidyl-3,6-dioxaoctanediamine (maleimide-PEO2-biotin) (Pelis et al., 2006). Maleimide-PEO2-biotin inhibited transport irreversibly, and labeling of Cys474 with maleimide-PEO2-biotin was reduced in presence of TPeA. Location of Gly478 in rOCT1 within the transport path was demonstrated in affinity-labeling experiments (Egenberger et al., 2012). These experiments were performed with the variant rOCT1(10ΔC) in which all cysteine residues with exception of those in the large extracellular loop were replaced by alanine or serine (Sturm et al., 2007). Affinity labeling of rOCT1(10ΔC) was performed with the TEA-derived sulfhydryl group reagent 2-(trimethylammonium) ethylmethanethiosulfonate (MTSET), which is transported by rOCT1(10ΔC). When Gly478 was exchanged against cysteine, MTSET blocked transport of organic cations irreversibly, and blockage was blunted when the labeling was performed in presence of substrates (Egenberger et al., 2012). The critical role of Gly478 is supported by the observation that the IC50 values for inhibition of MPP uptake by TBuA were decreased when Gly478 in rOCT1 or rOCT1(10ΔC) was replaced by cysteine.
Compared with channel activity, transporter function is supposed to involve more substantial structural changes. In OCTs, transport-related structural changes include parts that are not directly involved in substrate binding and translocation such as TMHs 3, 6, 9, and 12 (Fig. 3). In rOCT1 and rOCT2, transport-related structural changes have been recorded by measuring cation effects on membrane capacitance in oocytes expressing rOCT2 or rOCT1(10ΔC) (Schmitt and Koepsell, 2005; Gorbunov et al., 2008) and by measuring cation effects on potential-induced fluorescent changes in rOCT1(10ΔC) containing fluorescence-labeled cysteine residues close to the extracellular surface of plasma membrane (Gorbunov et al., 2008; Egenberger et al., 2012). In the latter experiments, cysteine residues were introduced by replacing amino acids in peripheral parts of TMHs 4 (Cys260), 8 (Cys380), and 11 (Cys483), and fluorescence labeling was performed with tetramethylrhodamine-6-maleimide (TMRM), which does not enter the transport path. It was observed that choline, MPP, and TBuA exhibited differential effects on voltage-dependent fluorescent changes when rOCT1(10ΔC) was labeled in different positions. When Gly478 within the transport path was replaced by cysteine, voltage-dependent fluorescence changes of rOCT1(10ΔC) labeled in two positions with TMRM were altered. In addition, potential-dependent fluorescence changes observed in TMRM-labeled rOCT1(10ΔC) containing the Gly478Cys mutation were changed when Cys478 was affinity-labeled with MTSET. The data indicate extended potential- and cation-dependent structural changes in rOCT1 when Gly478 is exchanged by cysteine or when the introduced cysteine residue is modified with MTSET. Glycine residues in TMHs provide flexibility, allowing bending during transport that may be essential for formation of occluded conformations (Pace and Scholtz, 1998). Hence, Gly477-Gly478 in OCT1–3 is supposed to represent a hinge domain in the middle of TMH11 that allows bending during transport.
Trying to determine the impact of amino acids in TMH4 on substrate binding and/or translocation, the amino acids in TMH4 of rOCT1 were replaced individually, and effects on apparent Km values of TEA and MPP transport were measured after expression of the mutants in oocytes (Popp et al., 2005). The apparent Km values for TEA and MPP uptake were increased or decreased when Val213, Trp218, or Phe222 was mutated. In mutant Thr226Ala, the apparent Km value for MPP, and in mutant Val229Ala, the apparent Km for TEA, were increased, respectively. Because Val213, Trp218, Phe222, Tyr226, and Val229 are located on the same side of TMH4, the data suggest that part of the substrate-binding region and transport path is formed by TMH4. Based on these data, it cannot be distinguished whether the individual mutations change a direct interaction of the respective amino acid with a substrate or exhibit an allosteric effect on substrate interaction with nearby amino acids.
For inhibition of TEA uptake or MPP uptake by extracellular corticosterone, more than 30 times lower IC50 values were obtained for rOCT2 compared with rOCT1. Investigating the molecular basis for this difference, it was observed that after replacement of Ile443, Tyr447, and Glu448 in TMH10 of rOCT1 by alanine, leucine, and glutamine located in the corresponding positions of rOCT2, the same IC50 values for corticosterone inhibition were observed as in rOCT2 (Gorboulev et al., 2005). In mutant rOCT1(Ile443Ala) the apparent Km value for TEA uptake was decreased, whereas in double-mutant rOCT1(Tyr447Leu/Glu448Gln) the apparent Km value for MPP uptake was decreased, pointing to a role of these amino acids for binding and/or translocation of these substrates (Gorboulev et al., 2005).
Effect of mutations in rOCT1 on inhibition of TEA-induced inward currents by extracellular and intracellular corticosterone was characterized in cRNA-injected oocytes or in stably transfected HEK293 cells (Volk et al., 2009). For current measurements in oocytes, mutations were performed in rOCT1(10ΔC), which showed higher TEA-induced inward currents and similar efficacy of corticosterone inhibition than rOCT1. Amino acids lining the modeled outward-facing and/or inward-facing conformation of rOCT1 were selected for mutagenesis. For interpretation of the data, corticosterone-docking simulations to the modeled outward- and inward-open cleft of rOCT1 were performed. After mutation of Phe160 in TMH2, Trp218 in TMH4, Arg440 or Leu447 in TMH10, or Asp475 in THM11, the IC50 values for inhibition of TEA-induced currents or of TEA uptake by corticosterone added from extracellular or intracellular were changed. These amino acids are located within the inner parts of the modeled outward- and inward-facing cleft of rOCT1 (Fig. 3) and were predicted to interact with corticosterone by docking simulations. After replacement of Tyr222 by phenylalanine or Gln448 by glutamate, the IC50 value for inhibition of TEA-induced currents by extracellular corticosterone was not altered. This is consistent with the inaccessibility of these amino acids in the modeled outward-facing cleft (Volk et al., 2009). The data suggest that amino acids in TMH4 (Trp218) and TMH11 (Asp475) located in the inward- and outward-facing conformations of rOCT1 interact with TEA, MPP, and corticosterone.
To determine whether, in addition to amino acids in TMH4 and Asp475 in TMH11, also Phe160 in TMH2 and Arg440 and Leu447 in TMH10 are critical for translocation of TEA and/or MPP, effects of mutations in these positions on apparent Km values for uptake of TEA and/or MPP into stably transfected HEK293 cells were investigated (Gorboulev et al., 2018). The apparent Km value for uptake of TEA was altered when Arg440 was replaced by lysine or when Leu447 was replaced by tyrosine, whereas the apparent Km value for MPP was changed in the Phe160Tyr mutant. The data suggest that Arg440 and Lys447 interact with TEA and that Phe160 interacts with MPP during transport.
To further characterize the outward-facing binding site, it was investigated which of the amino acids supposed to interact with extracellular corticosterone also interact with the nontransported inhibitors TBuA and TPeA in addition to Asp475 (Gorboulev et al., 2018). After mutation of Trp218, the IC50 values for inhibition of MPP uptake by TBuA and TPeA were changed, whereas the exchange of Arg440 by lysine did not alter the IC50 values of both inhibitors. After mutation of Phe160 and Tyr222, only the IC50 for TBuA, and after mutation of Leu447, only the IC50 for TPeA was changed. Taken together the data suggest that TBuA interacts with Phe160, Trp218, Tyr222, and Asp475, whereas TPeA interacts with Trp218, Leu447, and Asp475.
Extending the binding studies to GFP-rOCT1 mutants, it was also investigated whether binding of MPP to the two low-affinity binding sites and the allosteric high-affinity MPP binding site in the rOCT1 monomer was changed when, in addition of Asp475, Phe160, Trp218, Arg440, Leu447, or Gln448 was mutated (Keller et al., 2019). MPP-binding measurements were performed after incorporation of GFP-rOCT1 WT or mutants into nanodiscs, whereas MPP uptake was measured in reconstituted proteoliposomes. After replacement of Phe160 by tyrosine, Leu447 by phenylalanine or tyrosine, and Gln448 by glutamate, maximal binding to high- and low-affinity MPP binding sites was not changed. This means that binding to one high-affinity MPP binding site and two low-affinity MPP binding sites per rOCT1 monomer was not affected. However, as in Asp475Glu mutant, after replacement of Trp218 by tyrosine, instead of two, only about one low-affinity MPP binding site per monomer was found, whereas high-affinity binding of MPP was not altered (Fig. 4A). Because also about one high-affinity and one low-affinity MPP binding site per rOCT1 monomer were also observed in double-mutant Asp475Glu/Trp218Tyr, it was concluded that Asp475 and Trp218 contribute to the same low-affinity MPP binding site. Only about one low-affinity and one high-affinity MPP binding site were also observed when Arg440 was replaced by lysine (Fig. 4A). In double-mutant Arg440Lys/Asp475Glu, low-affinity binding of MPP was abolished, whereas high-affinity MPP binding was not changed. Therefore, it was concluded that Arg440 contributes to a different low-affinity MPP binding site than Asp475 and Trp218. After reconstitution into proteoliposomes, the Vmax of MPP uptake was decreased by 44% in mutant Trp218Tyr, by 79% in mutant Asp475Glu, by 29% in mutant Arg440Lys, and by 96% in double-mutant Asp475Glu/Arg440Lys. This indicates that the low-affinity MPP binding sites are involved in transport. The apparent dissociation constants of the low-affinity MPP binding sites (KD low-aff.) appear to be similar because they could not be distinguished and only one common KD low-aff. value was detectable. Of note, the common KD low-aff. value of MPP binding to GFP-rOCT1 (36 µM) was similar to the apparent Km measured for MPP uptake by GFP-rOCT1 in proteoliposomes (19 µM). This suggests that the Km value is mainly determined by MPP binding to the transporter. In GFP-rOCT1 mutants Trp218Tyr, Asp475Glu, and Trp218Tyr/Asp475Glu, the KD low-aff. and Km values were similar to GFP-rOCT1-WT, suggesting that blockage of binding to and translocation via this low-affinity site do not alter binding to and translocation by the other low-affinity site. At variance, the KD low-aff. and the Km value in mutant Arg440Lys were 2.2 or 3.6 times higher compared with GFP-rOCT1-WT, suggesting some effect of this mutation on the other low-affinity MPP binding site. In nanodiscs containing GFP-rOCT1, MPP may bind to the outward- or inward-facing conformation of rOCT1. However, the neighboring location of Trp218 and Asp475 and the more distant location of Arg440Lys in the modeled outward-facing conformation (Fig. 3 upper panel; Fig. 4B) suggest that binding was measured to the outward-facing conformation.

Effects of mutations of amino acids lining the modeled outward-open cleft of rOct1 on MPP binding to low-affinity and high-affinity binding sites. (A) Numbers of MPP molecules per transporter monomer that bind to GFP-fusion proteins with Oct1 WT or the indicated mutants. Binding measurements were performed to fusion proteins that had been reconstituted into nanodiscs, and maximal low-affinity and high-affinity binding was determined. *Significant difference compared with rOCT1. •Significant difference compared with all other rOct variants. (B) Hypothetic model based on the observation that Trp218 (green) and Asp475 (red) are located in neighboring positions in the modeled outward-open cleft and more distant in the modeled inward-open cleft. Arg440 is indicated in blue.
The data suggest that translocation of MPP or other organic cations may be initiated via substrate binding to two separate low-affinity binding sites. The two low-affinity substrate binding sites may operate independently or in a concerted mode, inducing translocation-related conformational changes. At substrate concentrations above the Km of the respective substrate, two substrate molecules may be transported together, as depicted for MPP in Fig. 4B. In this situation, the high-affinity binding site(s) of the respective substrate is (are) occupied, and binding of inhibitors to high-affinity sites may not influence transport. At concentrations of MPP or other transported cations far below the respective Km values, only one substrate molecule is transported per transport cycle, and binding of the transported substrate or other cations to high-affinity sites may exhibit allosteric effects on transport.
F. Mutagenesis Studies in Human Novel Organic Cation Transporter 1 and Human Novel Organic Cation Transporter 2
The amino acid sequences of hOCTN1 and hOCTN2 are 88% identical, showing the smallest conservations between the large intracellular loops and the intracellular C termini. Both transporters accept organic cations, zwitterions, and noncharged compounds as substrates (Tables 2 and 4). They have partially overlapping substrate selectivities (Table 4) and employ partially different transport mechanisms. For example, hOCTN1 is a highly efficient high-affinity transporter for ergothioneine, which is not transported by hOCTN2. Human hOCTN2 has a more than 100 times lower Km for transport of L-carnitine than hOCTN1, and, different from hOCTN2, cellular uptake of TEA by hOCTN1 is stimulated by an outwardly directed proton gradient (Tamai et al., 1998). In hOCTN1, two binding sites are supposed to be involved in substrate recognition triggering translocation, because hOCTN1-mediated transport of cytarabine could not be inhibited by ergothioneine or TEA, but was inhibited by nitrobenzylmercaptopurine ribonucleoside, whereas hOCTN1-mediated transport of ergothioneine was not inhibited by nitrobenzylmercaptopurine ribonucleoside (Drenberg et al., 2017). In a mutant in which Leu503 in hOCTN1 is replaced by phenylalanine, higher apparent Km values were obtained for L-carnitine and gabapentin, whereas lower apparent Km values were determined for ergothioneine and TEA (Table 8). Because Leu503 is located in TMH12, which probably does not contribute to the substrate-binding region and translocation path(s), the mutation is supposed to induce an allosteric alteration of (a) transport-relevant part(s) of the transporter. Trying to identify amino acids in hOCTN1 that are responsible for the different efficacy of hOCTN1 and hOCTN2 for transport of L-carnitine verus ergothioneine, combinations of amino acids that differ between both transporters were replaced mutually (Bacher et al., 2009). Transport of L-carnitine by hOCTN1 was increased when a combination of amino acids in TMHs 5, 7, 8, 9, and 10 was exchanged, whereas transport of ergothioneine was not altered. The data support the existence of different transport-relevant binding sites for the two substrates.
hOCTN2 mediates Na+-dependent transport of L-carnitine as well as Na+-independent transport of TEA. Because competitive interaction was observed for inhibition of TEA uptake by L-carnitine and a mixed type of interaction for TEA inhibition of L-carnitine uptake (Ohashi et al., 2002), overlapping or closely associated binding sites for the two substrates were presumed. This notion is supported by differential effects of mutations on efficacy of L-carnitine versus TEA transport. Thus, the exchange of Pro478 in TMH11 against leucine resulted in a strong reduction of L-carnitine transport and an increase of TEA transport (Seth et al., 1999). Similarly, a reduction of L-carnitine transport and no change in TEA transport were observed when Tyr211 in TMH4 was replaced by phenylalanine (Seth et al., 1999). In both mutants, the sodium dependence of carnitine uptake was not changed. A selective effect on L-carnitine transport was also observed when Ser467 in TMH 11 was replaced by cysteine (Ohashi et al., 2002). The efficacy of L-carnitine transport was decreased because the apparent Km for carnitine transport was increased 15-fold, whereas transport of several tested organic cations such as TEA, quinidine, and verapamil was not affected. As observed for the mutants Pro478Leu and Tyr211Phe, mutant Ser467Cys did not alter the activation of L-carnitine transport by sodium. The data suggest that amino acids in TMH11 are involved in transport-related binding of L-carnitine. Because hOCTN2 contains an arginine in amino acid position 471, which corresponds to Asp475 in rOCT1, similar to the organic anion transporters of the SLC22 family, the carboxyl group of L-carnitine may interact with this Arg471. The EC50 for sodium stimulation of L-carnitine transport was decreased to different degrees when Glu452 in the intracellular loop between TMH10 and TMH11 was replaced by different amino acids (Wang et al., 2000b). Data allowing educated speculations concerning the molecular effect of this mutation are not available.
G. Mutagenesis in Human Multidrug and Toxin Exclusion 1 and Human Multidrug and Toxin Exclusion Kidney-Specific 2
After replacement of His386 in TMH10 of hMATE1 and histamine in the corresponding position of hMATE2-K and of rat MATE (rMATE)1 by glutamine, TEA uptake was largely decreased, although these mutations were not supposed to decrease expression. Because pH dependence of TEA uptake-mediated rMATE1 was not changed dramatically, this histidine residue is probably not directly involved in proton binding (Asaka et al., 2007b).
Replacement of Cys59 or Cys123 of hMATE1 and in corresponding positions of hMATE-K2 and rMATE1 by glycine induced a large decrease of TEA uptake (Asaka et al., 2007b). The location of Cys59 at the transition of TMH1 to the extracellular loop between TMH1 and TMH2 of hMATE1 and of Cys123 in TMH3 of hMATE1 suggests that these mutations induced allosteric effects on TEA uptake.
IV. Expression and Locations of Human Organic Cation Transporters in Cells, Tissues, Organs, and Tumors
A. Expression and Membrane Locations of Human Organic Cation Transporter 1, Human Organic Cation Transporter 2, and Human Organic Cation Transporter 3
hOCT1 is one of the abundantly expressed drug transporters in liver (Nishimura and Naito, 2005; Hilgendorf et al., 2007; Drozdzik et al., 2019). In various other organs and tissues, including eye, brain, small intestine, kidney, lung, urinary bladder, heart, placenta, and skeletal muscle, hOCT1 is expressed at much lower levels (Table 6). In the eye, hOCT1 mRNA was detected in the cornea and the choroidial–retinal barrier (Zhang et al., 2008). In brain, hOCT1 mRNA is expressed in microvessels (Geier et al., 2013). Noteworthily, hOCT1 expression was also observed in adipocytes (Moreno-Navarrete et al., 2011) and in peripheral leukocytes, lymphocytes, and monocytes (Nishimura and Naito, 2005; Minuesa et al., 2008). Immunohistochemical localization of hOCT1 has only been performed in a few tissues. In the liver, hOCT1 was localized to the sinusoidal membrane of hepatocytes, as has been described for rOCT1 (Meyer-Wentrup et al., 1998; Nies et al., 2009). In rodents, the highest expression of OCT1 was observed in hepatocytes around the central veins, which represent the major site for glycolysis and lipid metabolism (Meyer-Wentrup et al., 1998). In small intestine, hOCT1 was localized to the BBM of enterocytes (Han et al., 2013). Luminal location of hOCT1 was also detected in kidney where hOCT1 immunoreactivity was observed at the BBM of proximal and distal tubules (Tzvetkov et al., 2009). In lung, immunoreactivity for hOCT1 was detected in ciliated cells of airway epithelia, showing a predominantly intracellular location (Lips et al., 2005). In the bladder, hOCT1-related immunoreactivity was observed in the plasma membrane of urothelial cells (Lips et al., 2007).
Abundance of mRNA and protein of human organic cation transporters in various organs, tissues, and cells
The degree of expression of mRNA (crosses) is estimated from observations reported in the literature. The related references are indicated in normal face. Due to partially differing results, only an arbitrary classification could be performed. Detection of protein by Western blotting, immunohistochemistry, or proteomics is indicated by asterisks. The related references are indicated in italics when only protein expression was investigated and in underlined normal face when both mRNA and protein were not determined. The clasification has been performed on the basis of the following publications: hOCT1: Gorboulev et al., 1997; Pietig et al., 2001; Alcorn et al., 2002; Motohashi et al., 2002; Bottalico et al., 2004, 2007; Lips et al., 2005, 2007; Nishimura and Naito, 2005; Ballestero et al., 2006; Hilgendorf et al., 2007; Meier et al., 2007; Minuesa et al., 2008; Okabe et al., 2008; Zhang et al., 2008; Nies et al., 2009; Tzvetkov et al., 2009; Moreno-Navarrete et al., 2011; Gupta et al., 2012; Geier et al., 2013; Han et al., 2013; Drozdzik et al., 2014, 2019; Bexten et al., 2015; Cai et al., 2016; Arner et al., 2018; Breining et al., 2018, skin: K. Lips and H. Koepsell, unpublished data, hOCT2: Gorboulev et al., 1997; Busch et al., 1998; Pietig et al., 2001; Alcorn et al., 2002; Motohashi et al., 2002; Bottalico et al., 2004, 2007; Lips et al., 2005, 2007; Nishimura and Naito, 2005; Hilgendorf et al., 2007; Minuesa et al., 2008; Okabe et al., 2008; Filipski et al., 2009; Moreno-Navarrete et al., 2011; Bschleipfer et al., 2012; Geier et al., 2013; Sprowl et al., 2013; Bexten et al., 2015; Cai et al., 2016; Arner et al., 2018; Breining et al., 2018; Dolberg and Reichl, 2018, skin: K. Lips and H. Koepsell, unpublished data, hOCT3: Wu et al., 2000; Motohashi et al., 2002; Bottalico et al., 2004, 2007; Lips et al., 2005, 2007; Müller et al., 2005; Nishimura and Naito, 2005; Sata et al., 2005; Hilgendorf et al., 2007; Minuesa et al., 2008; Okabe et al., 2008; Nies et al., 2009; Duang and Wang, 2010; Solbach et al., 2011; Bschleipfer et al., 2012; Geier et al., 2013; Lee et al., 2014a; Bexten et al., 2015; Cai et al., 2016; Arner et al., 2018; Breining et al., 2018; Drozdzik et al., 2019; Song et al., 2019, skin: K. Lips and H. Koepsell, unpublished data, hOCTN1: Tamai et al., 1997; Pietig et al., 2001; Alcorn et al., 2002; Motohashi et al., 2002; Tokuhiro et al., 2003; Xuan et al., 2003; Kobayashi et al., 2004; Peltekova et al., 2004; Gründemann et al., 2005; Nishimura and Naito, 2005; Hiasa et al., 2006; Bottalico et al., 2007; Hilgendorf et al., 2007; Horvath et al., 2007; Meier et al., 2007; Minuesa et al., 2008; Okabe et al., 2008; Grigat et al., 2009; Markova et al., 2009; McBride et al., 2009; Sugiura et al., 2010; Bexten et al., 2015; Visentin et al., 2017b; Arner et al., 2018; Berg et al., 2018; Dolberg and Reichl, 2018, hOCTN2: Tamai et al., 1998; Wu et al., 1998b; Pietig et al., 2001; Motohashi et al., 2002; Tokuhiro et al., 2003; Xuan et al., 2003; Peltekova et al., 2004; Nishimura and Naito, 2005; Grube et al., 2006; Hilgendorf et al., 2007; Horvath et al., 2007; Meier et al., 2007; Minuesa et al., 2008; Okabe et al., 2008; Grigat et al., 2009; Geier et al., 2013; Bexten et al., 2015; Mooij et al., 2016; Berg et al., 2018; Dolberg and Reichl, 2018, hMATE1: Otsuka et al., 2005; Masuda et al., 2006; Tanihara et al., 2007; Ahmadimoghaddam et al., 2013; Geier et al., 2013; Motohashi et al., 2013; Bexten et al., 2015; Cai et al., 2016; Nies et al., 2016; Arner et al., 2018; Berg et al., 2018; Breining et al., 2018; Drozdzik et al., 2019, hMATE2-K: Masuda et al., 2006; Tanihara et al., 2007; Geier et al., 2013; Motohashi et al., 2013; Cai et al., 2016; Arner et al., 2018.
The expression of hOCT2 is less ubiquitous than hOCT1 and hOCT3 (Table 6). The highest expression of hOCT2 mRNA was observed in kidney, whereas less mRNA expression was detected in several other organs, for example in lung, brain, spinal cord, placenta, and nasal mucosa. Expression of hOCT2 mRNA was also detected in dorsal root ganglia (Sprowl et al., 2013). No expression was detected in many organs, including small intestine, colon, liver, and heart (Table 6). In kidney, hOCT2 has been localized by immunohistochemistry to the basolateral membrane of renal proximal tubules, as has been described for rOCT2 (Karbach et al., 2000; Motohashi et al., 2002, 2013). In airway epithelia of the lung, hOCT2-related immunoreactivity was detected in apical membrane of ciliated epithelial cells and in plasma membranes of basal cells (Lips et al., 2005). In brain, hOCT2 was localized by in situ hybridization and immunohistochemistry in neurons at different brain areas (Busch et al., 1998). In addition, hOCT2 mRNA was observed in isolated microvessels (Geier et al., 2013). In rats and/or mice, OCT2 has also been localized to neurons of different neuronal circuits (Bacq et al., 2012; Couroussé and Gautron, 2015), in nerve cells of the spinal cord, and to the apical membrane of epithelial cells in the choroid plexus (Sweet et al., 2001). However, it has not been verified whether these locations in rodents reflect the situation in humans.
hOCT3 is expressed in many organs and tissues. High mRNA abundance was observed in adrenal gland, prostate, salivary gland, and skeletal muscle (Table 6). Lower, but distinct mRNA expression was detected in adipose tissue, bone marrow, colon, liver, lung, stomach, small intestine, heart, testis, trachea, thyroid gland, uterus, and placenta, whereas less abundant amounts of hOCT3 mRNA were observed in various other organs, including brain, kidney, and urinary bladder, and in monocytes (Table 6). Immunohistochemistry in the submandibular gland revealed a predominant localization of hOCT3 in luminal membranes of acini and ducts (Lee et al., 2014a). In skeletal muscle, hOCT3-related immunoreactivity was observed in the plasma membrane of the muscle cells (Chen et al., 2010a), whereas in liver, hOCT3 was immunolocalized to the sinusoidal membrane of hepatocytes (Nies et al., 2009). In the lung, hOCT3 protein was detected in bronchial epithelial cells and localized to the luminal membrane of ciliated cells, the basolateral membrane of intercalated cells, and the entire plasma membrane of basal cells (Lips et al., 2005). At variance, in small intestine hOCT3-related immunoreactivity was observed in the luminal membrane of the enterocytes (Müller et al., 2005). Immunostaining in heart suggests that hOCT3 is located at the endothelium of capillaries and small vessels (Solbach et al., 2011). In the placenta, hOCT3-related immunostaining was observed in trophoblast cells (Solbach et al., 2011), and subcellular fractionation and Western blotting of placenatal cells revealed that hOCT3 is located in basolateral membranes facing the fetal side (Sata et al., 2005). hOCT3 mRNA was observed in various brain regions, including substantia nigra, nucleus caudatus, pons, and cerebellum (Duan and Wang, 2010). Expression of mRNA and protein was detected in isolated brain microvessels and in primary cultured astrocytes (Inazu et al., 2003; Geier et al., 2013). In kidney hOCT3 protein was located to the basolateral membrane of renal proximal tubular cells (Chen et al., 2010a), whereas in urothelial cells hOCT3-related immunoreactivity was observed at the entire plasma membrane (Lips et al., 2007; Bschleipfer et al., 2012).
B. Expression and Membrane Locations of Human Novel Organic Cation Transporter 1 and Human Novel Organic Cation Transporter 2
In nearly all investigated organs, tissues’ and cells’ mRNA of hOCTN1 was detected; however, with the exceptions of bone marrow, colon, kidney, and skeletal muscle, only low mRNA concentrations were observed (Table 6). The expression of hOCTN1 in bone marrow, spleen, lymphocytes, macrophages, monocytes, and erythrocyte progenitor cells suggests relevance of hOCTN1 for blood formation and immune response. In small intestine, hOCTN1 has been localized to the BBM of enterocytes (Sugiura et al., 2010). In kidney, hOCTN1 is probably located in the BBM of renal proximal tubules because a luminal location has been demonstrated for OCTN1 in mice, and it has been demonstrated that hOCTN1 interacts with the PDZ (PSD-95, Dlg, and ZO-1) domain of proteins that are expressed in the BBM of renal proximal tubules (Gisler et al., 2001; Tamai et al., 2004; Kato et al., 2005). In lung, hOCTN1-related immunoreactivity was observed in the luminal membrane of tracheal and bronchial epithelia, and in alveolar epithelial cells (Berg et al., 2018). In skin, hOCTN1 is mainly expressed in the epidermis, where it was localized to the basal membrane of proliferating basal cells and to terminally differentiated granular keratinocytes (Markova et al., 2009).
hOCTN2 is also expressed ubiquitously. Relatively high mRNA concentrations were observed in adrenal gland, brain vessels, colon, heart, kidney, mammary gland, salivary glands, and skeletal muscle. hOCTN2 mRNA was also observed in many other organs and cells, including heart, small intestine, kidney, lung, brain, spleen, lymphocytes, macrophages, and monocytes (Table 6). In addition, hOCTN2 has been detected in exosomes (Console et al., 2018). In heart, hOCTN2 has been immunolocalized to vascular endothelial cells (Grube et al., 2006). Immunolocalization of hOCTN2 in human small intestine and human kidney has not been reported. However, because OCTN2 was localized to the BBM of small intestine of renal proximal tubules in rodents (Tamai et al., 2001; Kato et al., 2006) and hOCTN2 binds to the BBM-associated PDZ containing proteins NHERF2 and PDZK1 (Kato et al., 2005), a luminal localization of hOCTN2 in small intestine and kidney is also probable in humans. In the lung, hOCTN2-related immunoreactivity was observed at the luminal membrane of respiratory epithelia and in alveolar epithelia (Horvath et al., 2007).
C. Expression and Membrane Locations of Human Multidrug and Toxin Exclusion 1 and Human Multidrug and Toxin Exclusion Kidney-Specific 2
mRNA of hMATE1 has been detected in many organs, tissues, and cells (Table 6). The highest concentrations of hMATE1 mRNA were found in adrenal gland, kidney, liver, and skeletal muscle (Otsuka et al., 2005; Masuda et al., 2006; Nies et al., 2016). Noteworthily, hMATE1 mRNA was also detected in brain, showing an 11-fold higher mRNA concentration in isolated brain microvessels than in brain homogenate (Geier et al., 2013). In liver, hMATE1-related immunoreactivity was observed at the canalicular membrane of hepatocytes (Otsuka et al., 2005). In kidney, hMATE1 was immunolocalized to the BBM of renal proximal tubules (Otsuka et al., 2005; Tanihara et al., 2007; Motohashi et al., 2013). In individual proximal tubular cells, coexpression of hMATE1 with hOCT2 and the organic anion transporter hOAT1 in the basolateral membrane has been demonstrated (Motohashi et al., 2013).
The most abundant levels of hMATE2-K mRNA were observed in kidney (Masuda et al., 2006). Significant hMATE2-K–mRNA concentrations were also detected in brain microvessels (Geier et al., 2013), and small concentrations of hMATE2-K mRNA were identified in several additional organs (Table 6). hMATE-K2 was localized to the BBM of renal proximal tubules (Masuda et al., 2006; Tanihara et al., 2007). In individual tubular cells, coexpression of hMATE2-K in the BBM with hOCT2 in the basolateral membrane was demonstrated (Motohashi et al., 2013).
D. Transporters That Mediate Organic Cation Transport in Small Intestine
Frequently, several OCTs are expressed in the same cell and are often located in the same plasma membrane of polarized cells. To anticipate cellular uptake and transcellular movement of drugs transported by OCTs, transport activities of coexpressed more selective transporters also must be considered.
In small intestinal enterocytes, hOCT1, hOCT3, hOCTN1, and hOCTN2 are located in the BBM, where they are predominantly involved in the first step of organic cation absorption (Fig. 5). In addition to absorption, the OCTs in the BBM may mediate efflux of organic cations performing electroneutral cation exchange (hOCT1, hOCT3, hOCTN1, hOCTN2) or proton–cation exchange (hOCTN1). To date, transporters in the basolateral membrane of enterocytes that mediate organic cation uptake have not been identified. The small intestinal BBM also contains more selective transporters that may contribute to cation absorption or secretion. For example, the choline transporter (CHT)1 (SLC5A7), the norepinephrine (NE) transporter (NET)1 (SLC6A2), the dopamine (DA) transporter (DAT)1 (SLC6A3), the serotonin (SE) transporter (SERT) (SLC6A4), the thiamine transporter (THTR)2 (SLC19A3), the plasma membrane monoamine transporter (PMAT) (SLC29A4), and the choline-like transporters (CTL)1–5 (SLC44A1–5) may participate in absorption of individual cations (Said et al., 2004; Traiffort et al., 2005; Gröer et al., 2013; Han et al., 2015), whereas the human multidrug resistance protein 1 (hMDR1; ABCB1) mediates extrusion of some hydrophobic cations across the BBM (Schinkel and Jonker, 2003).

Location of OCTs in enterocytes of human small intestine.
E. Transporters That Mediate Organic Cation Transport in Liver
In the liver, uptake of organic cations from the portal vein into hepatocytes is mainly mediated by hOCT1 (Fig. 6). However, in individuals with relatively low expression of hOCT1 and high hepatic expression of hOCT3 (Nies et al., 2009), or concerning substrates with lower Km values for hOCT3 compared with hOCT1 (Table 4), hOCT3 may contribute significantly (Fig. 6). hOCT1 and hOCT3 are mainly involved in electrogenic cation uptake, but may also mediate release of organic cations into the portal vein. The proton–cation exchanger hMATE1 in the biliary membrane is probably most important for the second step of biliary secretion of many organic cations (Fig. 6). Of note, hMDR1 is also located in the biliary membrane and may be pivotal for cellular efflux of hydrophobic cationic substrates (Schinkel and Jonker, 2003). In human hepatocytes, expression of additional transporters that accept some cations as substrates, such as NET (SLC6A2), SERT (SLC6A4), PMAT (SL29A4), and THTR1 (SLC19A2), has been reported (Nishimura and Naito, 2005; Roth et al., 2012); however, the biomedical relevance of these transporters has not been established.

Location of OCTs in hepatocytes of human liver.
F. Transporters that Mediate Organic Cation Transport in Kidney
In renal proximal tubules, many transporters are involved in secretion and reabsorption of organic cations. hOCT2, which is abundantly expressed in basolateral membranes of the tubular cells (Motohashi et al., 2002), is critically involved in cellular uptake of many organic cations. hOCT2 operates in line with hMATE1 and hMATE-K2 in the BBM (Otsuka et al., 2005; Masuda et al., 2006) that mediate cellular release of various cations into the tubular lumen (Fig. 7). Hydrophobic organic cations may be transported by hMDR1 into the tubular lumen (Schinkel and Jonker, 2003). Uptake of organic cations across the basolateral membrane is complemented by hOCT3 (Chen et al., 2010a), whereas cation release across the BBM into the tubular lumen is supplemented by hOCTN1 and hOCTN2. hOCTN1 may operate as proton–cation exchanger like MATE1 and MATE2-K. Reabsorption of organic cations from the tubular lumen may be mediated by hOCT1 (Tzvetkov et al., 2009), hOCTN1 (Tamai et al., 2004), or hOCTN2, which are located in the BBM (Kato et al., 2006), in combination with cation release across the basolateral membrane via cation exchange by hOCT2 and/or hOCT3. In kidney, expression of PMAT, NET1, DAT1, SERT, CHT1, CTL2, and CTL4 also has been demonstrated (Engel et al., 2004; Nishimura and Naito, 2005; Traiffort et al., 2005). These transporters may participate in renal secretion and/or reabsorption of organic cations.

Location of OCTs in proximal epithelial cells of human kidney.
G. Transporters that Mediate Organic Cation Transport in Lung
In lung, hOCT1–3, hOCTN1, and hOCTN2 have been localized to the luminal membrane of ciliated bronchial epithelial cells (Lips et al., 2005; Horvath et al., 2007; Berg et al., 2018) (Fig. 8). Whereas the luminal OCTs mediate the first step in the absorption of inhaled cationic drugs, the transporters in the basolateral membrane that enable drug release into the interstitium have not been identified. Because hOCT2 and hOCTN1 can mediate cellular release of acetylcholine across the luminal membrane, these transporters are supposed to be involved in non-neuronal cholinergic reactions (Lips et al., 2005; Pochini et al., 2012). Choline uptake into bronchial epithelial cells by hOCT1, hOCT2, and hOCTN2 (Table 2) may be important for the anabolic cell metabolism. In addition, inhaled toxic cations that entered the epithelial cells may be excreted by exchange against choline (Table 3). Hydrophobic cations that entered the epithelial cells may also be expelled by hMDR1, which is also located in the luminal membrane (Berg et al., 2018).

Location of OCTs in ciliated epithelial cells of human trachea.
H. Transporters that Mediate Organic Cation Transport in Brain
OCTs in brain are supposed to play an important role for the local adjustment of neurotransmitter concentrations in brain interstitium and may modulate the tonus of neuronal activities. Evidence has been provided on protein and/or mRNA level that hOCT1–3, hOCTN2, hMATE1, and hMATE2-K are expressed in brain microvessels (Fig. 9; Table 6). The relatively high expression levels of these transporters suggest that the OCTs are involved in uptake of endogeneous compounds such as choline, L-carnitine, and thiamine (Table 2) and of cationic drugs (Table 4) across the blood brain barrier (BBB). In addition, the OCTs in the BBB may participate in the removal of organic cations from brain, such as hMDR1 in the BBB (Schinkel and Jonker, 2003). To date, the physiologic and biomedical role of the OCTs in the BBB is poorly understood. One reason is that it has not been distinguished whether the OCTs are located in the luminal and/or basolateral membrane of the endothelial cells. It has been observed that hOCT2 is expressed in neurons (Busch et al., 1998), and that hOCT3 is expressed in neurons and glial cells (Inazu et al., 2003; Duan and Wang, 2010). These transporters are involved in the reuptake of secreted neurotransmitters (Table 2) and are supposed to modulate neuronal activities.

Location of OCTs in human brain. It has not been resolved whether the depicted OCTs are located in the luminal and/or basal membrane of the small brain vessels.
I. Organic Cation Transporters That Are Expressed in Tumors
OCTs are expressed in various tumors, such as breast cancer, colon cancer, glioblastoma, hepatocellular carcinoma, lung non-small cell carcinoma, esophageal cancer, renal cancer, and myeloic leukemia cells (Table 7). In some tumors, several OCTs are expressed. For example, hOCT1, hOCT2, hOCT3, hMATE1, and hMATE-K2 were detected in breast cancer; hOCT1, hOCT3, and hOCTN1 in hepatocellular carcinoma; hOCT1, hOCT2, hOCT3, hOCTN1, and hOCTN2 in lung non-small cell carcinoma; and hOCT1 and hOCTN1 in myeloic leukemia cells (Wang et al., 2008; Drenberg et al., 2017). In some cancers, OCTs exhibit different expression levels compared with the surrounding tissues. For example, in hepatocellular carcinoma, expression of hOCT1 was decreased (Schaeffeler et al., 2011; Heise et al., 2012; Herraez et al., 2013; Al-Abdulla et al., 2019); in lung, non-small cell carcinoma; and in renal carcinoma, expression of hOCT2 was decreased (Monks et al., 2007; Liu et al., 2016b), whereas in breast cancer, ovary cancer, prostate cancer, and uterine cancer, the expression of hOCT3 was decreased (Rhodes et al., 2004; Tomlins et al., 2007; Chen et al., 2013; Cai et al., 2016). The decreased expression levels of hOCT1 in hepatic cancer and of hOCT3 in prostate carcinoma were correlated with promoter methylation (Schaeffeler et al., 2011; Chen et al., 2013). In hepatocellular and prostate cancer, the expression of hOCT1 and hOCT3 was negatively correlated with tumor malignancies (Tomlins et al., 2007; Heise et al., 2012). At variance, in glioblastoma the expression of hOCTN2 was increased, and the expression level was positively correlated with malignancy (Fink et al., 2019). Positron emission tomography (PET) with 14F-labeled model substrates (Wei et al., 2016; Visentin et al., 2017b, 2018), 11C-labeled choline (Glunde et al., 2015), 11C-labeled metformin (Sundelin et al., 2017), or 11C-labeled sulpiride (Takano et al., 2017) may be used to improve the localization of tumors in which expression of OCTs is different compared with the surrounding tissue.
Expression of human organic cation transporters in tumors in different organs detected on mRNA and/or protein level
hOCT1: Kantarjian et al., 2004; Ballestero et al., 2006; Zhang et al., 2006; Monks et al., 2007; Wang et al., 2008; Schaeffeler et al., 2011; Heise et al., 2012; Herraez et al., 2013; Lin et al., 2013; Cai et al., 2016; Visentin et al., 2017b; Al-Abdulla et al., 2019, hOCT2: Rhodes et al., 2004; Zhang et al., 2006; Monks et al., 2007; Filipski et al., 2009; Burger et al., 2010; Lin et al., 2013; Cai et al., 2016; Liu et al., 2016b; Visentin et al., 2018, hOCT3: Rhodes et al., 2004; True et al., 2006; Monks et al., 2007; Tomlins et al., 2007; Wang et al., 2007; Eeles et al., 2008; Yokoo et al., 2008; Cui et al., 2011; Schaeffeler et al., 2011; Heise et al., 2012; Lin et al., 2013; Cai et al., 2016; Hu et al., 2018, hOCTN1: Rhodes et al., 2004; Monks et al., 2007; Wang et al., 2007; Drenberg et al., 2017; Visentin et al., 2017b; Hu et al., 2018, hOCTN2: Rhodes et al., 2004; Monks et al., 2007; Wang et al., 2007; Fink et al., 2019, MATE1: Cai et al., 2016, hMATE2-K: Cai et al., 2016; Liu et al., 2016b.
V. Model Substrates and Endogenous Compounds That Are Transported by Human Organic Cation Transporters
A. Model Substrates of Human Organic Cation Transporters
For analysis of transport by OCTs, model substrates have been employed (Table 1). Transport activity was evaluated by measuring fluorescence of fluorescent substrates (ASP, 4′,6-diamidino-2-phenylindole, N,N,N-trimethyl-2-[methyl(7-nitrobenzo[c][1,2,5]oxadiazol-4-yl)amino]ethanaminium iodide, and rhodamine 123), by measuring radioactivity of 3H- or 14C-labeled substrates (MPP, TEA, or N-methylquinidine) or by performing PET with 18F-labeled compounds (fluoromethyl choline, fluoro-L-α-methyltyrosine). The model substrates have partially different but overlapping specificity for individual OCTs.
B. Neurotransmitters and Neuromodulators That Are Transported by Human Organic Cation Transporters
Various endogeneous cations and zwitterions are transported by hOCTs implicating distinct physiologic roles of OCTs in different organs (Table 2). For example, neurotransmitters are transported by hOCT1, hOCT2, and/or hOCT3, which are expressed in brain. Acetylcholine is transported by hOCT2 and hOCTN1, whereas DA, SE, epinephrine, NE, and histamine are transported by hOCT1, hOCT2, and hOCT3 (Table 2). Because these transporters operate most efficiently as electrogenic cation uptake systems, it is probable that they mediate reuptake of released neurotransmitters and modulate neurotransmission. Because a detailed immunohistochemical localization of hOCT1–3 in human brain is missing, our current understanding about impact of OCT-mediated neurotransmitter uptake in brain is based on experiments with rodents (see Cerebral Functions of Organic Cation Transporter 2 and Organic Cation Transporter 3 in Rodents). These data suggest that hOCT2 and hOCT3 modulate behavior patterns, psychologic functions, and central metabolic regulations.
Exocytotic discharge of histamine from mast cells, basophilic granulocytes, or different resident cells in skin, connective tissue, or bronchi mediates allergic reactions. The observations that hOCT3 mediates highly efficient cellular uptake of histamine and is expressed in skin, adipose tissue, and airway epithelial cells suggest that it is involved in termination of allergic reactions. Because hOCT1 and hOCT2 are also expressed in bronchi, they may serve a similar function in the lung. hOCT1 and hOCT3 in the BBM of small intestine (Fig. 5) are supposed to be involved in the absorption of histamine from food, which may be relevant for food–histamine incompatibility.
The neuromodulator agmatine that is present in plasma and various tissues, including brain (Raasch et al., 1995), is transported by hOCT1–3 (Table 2). Agmatine is generated by decarboxylation of arginine. It binds to α2-adrenoreceptors at imidazoline binding sites and may replace the antihypertensive drug clonidine (Li et al., 1994). Intracellular agmatine induces expression of antizyme that suppresses polyamine-induced proliferation of cells. Antizyme blocks ornithine decarboxylase activity as well as cellular uptake of arginine, which leads to a decrease of intracellular polyamines (Satriano et al., 1998). Hence, agmatine exhibits antiproliferative effects (Babál et al., 2001).
hOCT1–3 also transport salsolinol and histidyl-proline diketopiperazine [Cyclo (His-Pro)] (Table 2). Salsolinol is a neurotoxic metabolite of DA. Salsolinol and its derivative N-methyl-salsoninol are accumulated in the substantia nigra of patients with Parkinson’s disease (Naoi et al., 2002). Both metabolites are supposed to be involved in glutamate-induced, Ca2+-mediated excitotoxic cell injury of dopaminergic neurons. In vitro experiments with hOCT2-expressing cells indicate that Cyclo(His-Pro), a metabolite of thyrotropin-releasing hormone occurring in brain, exhibits a protective effect on salsolinol-induced cell injury (Taubert et al., 2007).
C. Metabolites and Food Components That Are Transported by Human Organic Cation Transporters
Choline is a crucial dietary component that is required for synthesis of phospholipids, methyl metabolism, cholinergic signal transduction, intracellular signaling, and lipid–cholesterol metabolism (Zeisel and Blusztajn, 1994; Zeisel, 2000). Choline is absorbed in small intestine and reabsorbed or secreted in renal proximal tubules dependent on the choline concentration in the blood (Dantzler et al., 1998). Choline is transported into various cells, including hepatocytes and cholinergic neurons. In hepatocytes, choline is essential for the formation of low-density lipoproteins (LDL), which contain phosphatidylcholine. In cholinergic neurons, choline is needed for synthesis of acetylcholine (Zeisel and Blusztajn, 1994). For the transfer of choline across plasma membranes, transporters are essential. Because the choline concentration in the small intestinal lumen, the portal vein, and at cholinergic synapses may change dramatically, and choline in the systemic blood may increase transiently after a choline-rich meal, efficient choline uptake at different choline concentrations must be ensured at various locations. This is accomplished by high-affinity and low-affinity choline transporters. High-affinity choline transporters belonging to the SLC5 and SLC44 transporter families have been identified. Human CHT1 (SLC5A1) is mainly expressed in cholinergic neurons and mediates Na+- and Cl−-dependent choline uptake with a Km of ∼2 µM (Apparsundaram et al., 2000; Okuda and Haga, 2000), whereas human CLT1 (SLC44A1) is expressed in brain, spinal cord, and lung and mediates Na+ independent uptake of choline (Traiffort et al., 2013). Choline transport has also been demonstrated for a splice variant of human CLT2 (SLC44A2), which is expressed in various tissues, including the inner ear, small intestine, and kidney (Kommareddi et al., 2010; Traiffort et al., 2013). hOCT1, hOCT2, hOCTN1, and hOCTN2 are low-affinity, high-capacity choline transporters (Table 2). Considering the locations of these transporters in enterocytes and proximal tubular cells (Figs. 5 and 7), hOCT1, hOCTN1, and hOCTN2 contribute to absorption and/or excretion of choline in small intestine, whereas hOCT1, hOCT2, hOCTN1, and hOCTN2 may be involved in renal secretion and/or reabsorption of choline. hOCT1 in the sinusoidal membrane of hepatocytes (Fig. 6) may mediate uptake of choline. In brain, hOCT2 in cholinergic neurons may be important for postexcitatory reuptake of choline.
Thiamine, generally known as vitmin B1, plays an important role in cell metabolism. After uptake into cells, thiamine is phosphorylated to thiaminepyrophosphate, which serves as a cofactor of key metabolic enzymes such as pyruvate dehydrogenase, α-ketoglutarate dehydrogenase, and acetyl-CoA carboxylase. For small intestinal thiamine absorption and thiamine uptake into cells, transporters are required that are efficient at a broad range of thiamine concentrations. Dependent on the food, thiamine concentration in the intestinal lumen can vary from 0 to >100 µM. The thiamine concentration in systemic blood plasma of healthy individuals is between 40 and 120 nM (Thornalley et al., 2007); however, the thiamine plasma concentration in the portal vein may be orders of magnitude higher dependent on food intake. Two high-affinity thiamine transporters called human thiamine transporters (hTHTR)1 (SLC19A2) and hTHTR2 (SLC19A3) with respective Km values of ∼2.5 µM and 27 nM have been cloned (Dutta et al., 1999; Said et al., 2004). Expression of hTHTR1 and hTHTR2 was observed in skeletal muscle, heart, placenta, liver, kidney, small intestine, and large intestine (Dutta et al., 1999; Eudy et al., 2000; Reidling et al., 2002; Said et al., 2004). Thiamine is also transported by hOCT1–3, hMATE1, and hMATE2-K (Table 2). For hOCT1, hOCT2, hMATE1, and hMATE2-K, apparent Km values between 3.5 and 780 µM have been determined (Table 2). For thiamine transport by hOCT2 and hMATE1, largely diverging Km values have been reported from different laboratories. Considering the expression and location of hOCT1 and hOCT3 in the luminal membrane of enterocytes (Fig. 5) and the sinusoidal membrane of hepatocytes (Fig. 6) (Müller et al., 2005; Nies et al., 2009; Han et al., 2013), these transporters are supposed to be involved in small intestinal thiamine absorption and thiamine uptake into hepatocytes. At very low thiamine concentrations in the food, thiamine uptake across the BBM of enterocytes may be mediated by hTHTR2 with a Km value of 27 nM, whereas thiamine uptake by hOCT1 and hOCT3 may be relevant at high thiamine content of the food. The observation that treatment of patients with pyrimethamine, which inhibits transport by MATE1 and MATE2-K with IC50 values <0.01 µM, decreased urinary thiamine excretion (Kato et al., 2014) suggests that MATE1 and/or MATE2-K are critically involved in renal thiamine secretion.
Creatinine is a degradation product of creatine that plays an important role in the energy supply for skeletal muscle. Creatine is supplied with the food and is synthesized in the liver from arginine, glycine, and activated methionine. After intacellular synthesis, creatine is released into the blood. It enters skeletal muscle cells via the Na+- and Cl−-dependent creatine transporter SLC6A8 (Verhoeven et al., 2005). In muscle cells, creatine is phosphorylated, providing an energy store for ATP synthesis. More than 90% of the total body creatine/phosphocreatine is present in skeletal muscle. Each day about 2% of the creatinine/phosphocreatine pool dehydrates to creatinine (Edison et al., 2007), which is released into the blood and excreted with the urine. Renal excretion occurs by glomerular filtration in combination with active secretion in proximal tubules. In healthy individuals, the secretory component of creatinine excretion amounts to 10% to 40% of urinary excretion (Levey et al., 1988). Active secretion of creatinine is mediated by organic anion transporter hOAT2 and by hOCT2 in the basolateral membrane in cooperation with MATE2-K and MATE1 in the BBM (Opravil et al., 1993; Urakami et al., 2004; Endres et al., 2006; Imamura et al., 2011; Kusuhara et al., 2011; Ciarimboli et al., 2012; Lepist et al., 2014; Chu et al., 2016). In the presence of cimetidine, which inhibits uptake by hOCT2, MATE1, and MATE2-K with similar affinity (Table 4), the creatinine clearance is similar to the clearance of inulin, which is exclusively excreted by glomerular ultrafiltration (Kabat-Koperska et al., 2004). The involvement of hMATE1 and/or hMATE2-K in creatinine secretion is concluded from the clinical observation that serum creatinine was increased when patients were treated with pyrimethamine, which is a high-affinity inhibitor of MATE1 and hMATE2-K (Table 4) (Opravil et al., 1993; Kusuhara et al., 2011).
L-carnitine is mainly supplied by the food, but can be synthesized in kidney, liver, and brain (Vaz and Wanders, 2002). L-carnitine is essential for β-oxidation. Uptake of L-carnitine and its derivative acetyl-L-carnitine across plasma membranes is mainly mediated by hOCTN2, which is ubiquitously expressed (Tables 2 and 6). For uptake of L-carnitine and acetyl-L-carnitine by hOCTN2, respective apparent Km values between 3.5 and 8.5 µM have been reported (Table 2). The Km value for L-carnitine is more than 5-fold lower than the mean free concentration of carnitine in the plasma (Schmidt-Sommerfeld et al., 1988). hOCTN2 in the BBM of enterocytes and renal proximal tubular cells (Figs. 5 and 7) mediates the first steps in intestinal carnitine absorption and renal carnitine reabsorption. Primary systemic carnitine difficiency (SCD) is a genetic disease that is due to loss-of-function polymorphisms in hOCTN2 (Nezu et al., 1999; Longo, 2016) (see Genetic Variants in SLC22A5 Cause Primary Systemic Carnitine Deficiency). In patients with SCD, the carnitine concentration in the blood is decreased due to impaired intestinal absorption and renal reabsorption of carnitine (Nezu et al., 1999; Longo, 2016). Human hOCTN1, which is colocated with hOCTN2 in the BBM of small intestine and renal proximal tubules and also accepts L-carnitine as substrate (Table 2), does apparently not compensate for loss of hOCTN2 function. SCD may cause cerebral symptoms early in live and progressive skeletal weakness and cardiomyopathy later on (Karpati et al., 1975; Stanley et al., 1991). These symptoms suggest important roles of hOCTN2 for uptake of L-carnitine and acetyl-L-carnitine across the BBB and into muscle cells. Of note, neuroprotective effects of L-carnitine during traumatic and hypoxic brain injury have been reported (Ferreira and McKenna, 2017). Recent data suggest that hOCT1 can mediate cellular efflux of acylcarnitines (Kim et al., 2017).
L-carnitine, choline, betaine, and phosphatidylcholine in lipid-rich food are metabolized by gut flora, whereby trimethylamine is generated. In the liver, trimethylamine is oxidized to trimethylamine N-oxide (TMAO), which is excreted in the kidney (Barrett and Kwan, 1985; Bain et al., 2005). High plasma TMAO concentrations have been associated with development of chronic kidney and cardiovascular diseases (Brown and Hazen, 2014; Tang et al., 2015; Kim et al., 2016). The observation that TMAO is transported by hOCT1 and hOCT2 (Table 2) suggests that hOCT1 may mediate efflux of TMAO from hepatocytes into the blood, whereas hOCT2 may be involved in renal secretion of TMAO.
Ergothioneine is an antioxidant food component, which is present in plants and mushrooms. It is efficiently transported by hOCTN1 (Gründemann et al., 2005; Grigat et al., 2007). Because OCTN1 has been located to the BBM of small intestinal enterocytes in humans and mice (Sugiura et al., 2010) and ergothioneine absorption was decreased in Octn1−/− mice, hOCTN1 is probably involved in ergothioneine absorption. The expression of hOCTN1 in lymphocytes, granulocytes, erythroid progenitor cells, monocytes, and macrophages (Table 6) suggests that the integrity and/or functionality of these cells is (are) influenced by hOCTN1-mediated ergothioneine uptake. Ergothioneine uptake by hOCTN1 in erythroid progenitor cells may increase the concentration of ergothioneine in erythrocytes and thereby protect oxyhemoglobolin against oxidation to methemoglobin (Arduini et al., 1992).
VI. Toxins That Are Transported by Human Organic Cation Transporters
Harmful effects of toxins, which are transported by OCTs, may be correlated with the activity and expression levels of OCTs and may be attenuated by coapplication of alternative substrates and/or nontransported inhibitors. Toxins transported by OCTs are the carcinogenic mycotoxin aflatoxin that contaminates food supporting growth of Aspergillus fungi (Wogan et al., 2012), the mutagenic dye ethidium used in biochemical research (Turner and Denny, 1996), the pyrrolizidine alkaloid monocrotaline found in Crotalaria plants (Tu et al., 2013), and the herbicide paraquat (1,1′-dimethyl-4,4′bipyridylium dichloride) (Vale et al., 1987) (Table 3). The four toxins are hepatotoxic. Regarding paraquat, it has been described that paraquat poisoning is characterized by high lung toxicity that may induce lung fibrosis (Dinis-Oliveira et al., 2008) and is nephrotoxic (Vale et al., 1987). In addition, paraquat may induce Parkinson’s disease by destroying dopaminergic neurons in the substantia nigra (Ritz et al., 2009; Tanner et al., 2011). Because all above-named toxins are transported by hOCT1, their small intestinal absorption may be dependent on the expression and activity of hOCT1 in small intestine and may be decreased after ingestion of substrates and/or inhibitors of hOCT1 (Fig. 5). In addition, the hepatotoxicity of these toxins may be dependent on expression and functional activity of hOCT1 in the liver (Fig. 6). Transport of aflatoxin, ethidium, and paraquat by hOCT2 expressed in kidney suggests that the renal excretion and a potential renal toxicity of these compounds may depend on renal expression and functionality of hOCT2 (Fig. 7). In case of paraquat, which is also transported by hMATE1, renal excretion and toxicity may also be modulated by renal expression and functionality of hMATE1. Transport of paraquat across the luminal membrane of bronchial epithelial cells via hOCT1 or hOCT2 (Fig. 8) may be relevant for paraquat-induced lung toxicity (Lips et al., 2005). Moreover, hOCT1, hOCT2, and hMATE1 in the BBB (Fig. 9) may be involved in paraquat uptake into brain, and hOCT2-mediated uptake of paraquat into neurons of the substantia nigra may be critical for sporadic occurrence of Parkinson’s disease.
VII. Drugs That Are Substrates and/or Inhibitors of Human Organic Cation Transporters
A. General Considerations
About 40% of all prescribed drugs are organic cations (Neuhoff et al., 2003). Many of these are substrates and/or inhibitors of hOCTs. To anticipate the roles of OCTs on pharmacokinetics, treatment efficacies, and potential drug toxicities, the interaction of drugs with the individual hOCTs must be known in addition to the location of the OCTs. Moreover, the capability of passive drug permeation across plasma membranes and colocation of transporters from other families with overlapping substrate selectivity needs to be considered. It is also mandatory to know which drugs are transported by individual hOCTs or whether they are nontransported inhibitors. The transport efficiacy and the inhibitory potential of individual transporters can be anticipated from in vitro determinations of apparent Km and IC50 values. To anticipate the clinical relevance of individual OCTs, clinically relevant drug concentrations must be known. For this purpose, total plasma concentrations must be determined and drug binding to plasma proteins needs to be considered.
Recently, evidence has been provided that the efficacy of drugs to inhibit organic cation uptake by hOCT1, hOCT2, and hMATE1 is dependent on the molecular structure of the transported substrate (Belzer et al., 2013; Martínez-Guerrero and Wright, 2013; Thévenod et al., 2013; Wittwer et al., 2013). The use of different model cations (Table 1) for uptake measurements can provide one explanation why for many compounds interacting with individual OCTs largely diverging IC50 have been reported (Tables 1, 2, 4, and 9). Of note, largely diverging IC50 were also obtained for the inhibition of rOCT1-mediated MPP uptake when different MPP concentrations far below the apparent Km value for MPP were employed for the uptake measurements (Gorboulev et al., 2018). In addition to diverging IC50 values, largely diverging apparent Km values for transport of drugs by individual transporter have been reported from different laboratories (Table 4). Possible causes for differing Km values are different employed expression systems and different incubation times used for uptake measurements (Gorboulev et al., 2018). Another cause could be a recording of high- and low-affinity uptake sites when different ranges of substrate concentrations are used. Recently, apparent high- and low-affinity Km values have been distinguished for hOCT2-mediated uptake of amphetamine (Wagner et al., 2017).
In Table 4, apparent Km values and IC50 values of drugs are compiled that have been shown to be transported by at least one hOCT. It is also indicated when transport has not been detected. In Table 4, the reported IC50 values are also indicated. In Table 9, IC50 values of drugs are shown, which are supposed to be high-affinity inhibitors because an IC50 value less than 20 µM has been reported for at least one OCT. Most of these drugs have not been tested for transport. The apparent Km values reported in Table 4 range from submicromolar to millimolar concentrations. Please note that a relatively high Km does not exclude that a drug concentration far below the apparent Km may inhibit transport of another drug because the respective IC50 value may be orders of magnitudes lower than the respective Km value. For example, for hOCTN1-mediated uptake of saracatinib, an apparent Km value of 42 µM was determined, whereas for inhibition of hOCTN1-mediated uptake of 1 µM ASP by saracatinib, an IC50 value of 72 nM was obtained (Harrach et al., 2017). Dramatic differences between apparent Km and IC50 values may be obtained when the concentration of the transported drug used for inhibition experiments is very low because under this condition binding to high-affinity sites may be inhibitory. For example, Minuesa et al. (2009) determined a Km value of 1.9 mM for hOCT2-mediated lamivudine uptake, and an IC50 value of 8 pM for lamivudine inhibition of hOCT2-mediated uptake of 1.3 nM MPP (Table 4).
To date, transport by OCTs has been demonstrated for smaller number of drugs compared with inhibition. The reasons are that only a minor fraction of drugs has been tested for transport because demonstration of transport is technically more demanding. Of note, it is difficult to exclude that a drug is transported. For this purpose, a methodological approach is required that detects transport at low substrate concentrations where transporter-mediated translocation of lipophilic drugs exceeds their passive permeation across the plasma membrane. With the exceptions in which uptake measurements were performed with radioactively labeled drugs, transport has been tested by electrical measurements performed with transfected oocytes or by uptake measurements into epithelial cells measuring intracellular drug concentrations by high-pressure liquid chromatography. The two latter methods require relatively high substrate concentrations. The electrical measurements only detect relatively high charge translocation rates, whereas detection of intracellular compounds by high-pressure liquid chromatography is insensitive. In Tables 1–4, it is indicated that no transport was detected for individual inhibitory compounds; however, in many cases, such as for transport of cisplatin by hOCTN1 or hOCTN2 (Yonezawa et al., 2006), transport at low clinically relevant concentrations has not been excluded.
B. Antidiabetic Drugs
Oral application of the biguanide metformin is regularly employed for first-line treatment of type 2 diabetes (T2D) (see first paragraph of Treatment of Type 2 Diabetes with Metformin). Metformin is transported by most hOCTs (Table 4). Interaction of three additional antidiabetic drugs with OCTs has been observed (Table 9). Rapaglinide, which increases the release of insulin from pancreatic β cells, and the insulin sensitizer rosiglitazone have been identified as high-affinity inhibitors of hOCT1. The dipeptidyl-4-peptidase inhibitor sitagliptin, which increases the plasma concentration of the glucagon-like peptide-1, is a high-affinity inhibitor of hOCT2.
C. Antineoplastic Drugs
Many antineoplastic drugs interact with hOCTs. They include platinum-based drugs, nucleoside analogs, kinase inhibitors, and topoisomerase inhibitors. Cisplatin is transported by hOCT1, hOCT2, hMATE1, and hMATE2-K; oxaliplatin by all seven hOCTs; and picoplatin by hOCT1–3 (Table 4). Transport of cisplatin by hOCT2 is probably most relevant because highly efficient uptake with an apparent Km value of 11 µM has been observed (Yonezawa et al., 2006; Sprowl et al., 2013). The antineoplastic tyrosine kinase inhibitor, imatinib, is transported by hOCTN1 and hMATE1 and inhibits the hOCT1–3, hOCTN1, and hMATE2-K with high efficacy (see Table 4 and Treatment of Myeloid Leukemia with Imatinib). At variance, the antineoplastic tyrosine kinase inhibitors erlotinib, dasatinib, gefitinib, nilotinib, and sunitinib have only been identified as high-affinity inhibitors of hOCTs (Table 9). The antineoplastic tyrosine kinase inhibitor sorafenib inhibits most hOCTs with low affinity. Sorafenib is probably not transported by hOCT1 (Chen et al., 2019), as has been suggested (Minematsu and Giacomini, 2011; Johnston et al., 2014; Al-Abdulla et al., 2019). The cyclin-dependent kinase inhibitor abemaciclib has been identified as highly efficient inhibitor of hOCT2 (Chappell et al., 2019). The antineoplastic topoisomerase inhibitor etoposide is transported by hOCT2, whereas the topoisomerase inhibitor topotecan is transported by hMATE1 and hMATE2-K and inhibits hOCT2 (Table 4). At variance, the topoisomerase inhibitors irinotecan and mitoxantrone have only been identified as inhibitors of hOCTs (Table 9). Moreover, it has been shown that the alkylating cytostatic ifosfamid is transported by hOCT2 (Table 4). Based on studies with tumor cells and clinical studies, metformin is also supposed to have antineoplastic effects that are dependent on OCT-mediated metformin uptake (Heckman-Stoddard et al., 2017; Cai et al., 2019).
D. Antiallergic Drugs
Various histamine receptor antagonists, which are employed for treatment of allergy and/or gastric ulcera, interact with hOCTs. Thus, the antihistaminic antiallergic drugs fexofenandine, pyrilamine, desloratidine, epinastine, ketotifen, and tripelenamine have been identified as substrates and/or inhibitors. Fexofenandine and pyrilamine are transported by hMATE1 and hOCTN1, respectively, whereas epinastine, tripelenamine, and ketotifen inhibit individual hOCTs (Tables 4 and 9).
The antihistaminic antacids cimetidine, famotidine, and ranitidine have also been identified as substrates and/or inhibitors (Tables 4 and 9). Cimetidine is transported by hOCT1, hOCT2, hMATE1, and hMATE2-K, and it inhibits hOCT3, hOCTN1, and hOCTN2. At variance, famotidine and ranitidine are hOCT2 substrates and inhibitors of other hOCTs.
E. Antiarrhythmic, Antihypertensive, and Hypertensive Drugs
The antiarrhythmic drugs dispyramide, procainamide, quinidine, flecainide, propaferone, and mexiletine, which are sodium channel blockers, have been identified as substrates and/or inhibitors of hOCTs. Dispyramide is transported by hOCT1 and hOCT3 and inhibits hOCT2, hMATE1, and hMATE-K2. Quinidine is transported by hOCT3, hOCTN1, and hOCTN2 and inhibits the other hOCTs, whereas procainamide is transported by hOCT1–3, hMATE1, and hMATE2-K (Table 4). Flecainide, propaferone, and mexiletine have been identified as OCT inhibitors (Table 9).
The antiarrhythmic calcium channel blocker verapamil is transported by hOCTN1, hOCTN2, and hMATE2-K and inhibits the other OCTs, whereas the calcium channel blocker diltiazem has been identified as substrate of hOCT1 and as inhibitor of most other hOCTs (Table 4). In addition, the antiarrhythmic β-receptor antagonist propranolol is transported by hOCT2 and inhibits several hOCTs (Table 4). Finally, the antiarrhythmic drugs nifekalant and propaferone have been shown to inhibit various hOCTs (Table 9).
Several antihypertensive drugs interact with hOCTs. Naldolol is transported by hOCT1, hOCT2, hMATE1, and hMATE2-K, whereas diltiazem, prazosin, and captopril are transported by hOCT1, hOCT2, and hMATE2-K, respectively (Fig. 4). Spironolactone, carvediol, guanabenz, guanfacine, phentolamine, and bisprolol have been identified as OCT inhibitors (Table 9).
The hypertensive drug etilefrine is transported by hOCT3 and inhibits hOCT1 and hOCT2 (Table 4), whereas dihydroergotamine has been identified as inhibitor of hOCT2, hMATE1, and hMATE2-K (Table 9).
F. Antiemetic and Antimigraine Drugs
Several antiemetic drugs interact with hOCTs. Diphenylhydramine and tropisetron have been identified as substrates of hOCT1 (Table 4), and diphenylhydramine, ondansetron, domperidone, and granisetron as OCT inhibitors (Table 9).
Also, antimigraine 5-hydroxytryptamine 1B/D/F receptor antagonists interact with hOCTs. Thus, sumatriptan, naratriptan, rizatriptan, and zolmitriptan have been identified as substrates of hOCT1, sumatriptan as substrate of hOCT2 (Table 4), and eletriptan as high-affinity inhibitor of hOCT1 (Table 9).
G. Psychotropic and Analgetic Drugs
Several antidepressant drugs have been shown to be transported and/or to inhibit hOCTs. The DA receptor antagonist sulpiride is transported by all OCTs. The SE reuptake inhibitor fluoxetine is transported by hOCT1 and inhibits hOCT2, whereas the SE reuptake inhibitor citalopram inhibits hOCT1–3. Bupropion has been identified as substrate of hOCT2 (Table 4) and desipramine, imipramine, amitriptyline, clomipramine, and trimipramine as inhibitors of hOCTs (Table 9). The weak antidepressant berberine is transported by hOCT1–3 (Table 4). The antiepileptic drugs gabapentin and sparteine have been identified as substrate of hOCTN1 and inhibitor of hOCT2, respectively. Moreover, the antipsychotic drugs chlorpromazine, olanzapine, and prochlorperazine; the anxiolytic drugs buspirone and flurazepam; and the sedative drugs clomacran and zolpidem have been identified as inhibitors of hOCTs (Fig. 9). The analgetic drug metabolite O-desmethyltramadol is substrate of hOCT1 and the analgetic ketamine substrate of hOCT1–3.
H. Antibiotic Drugs and Antiseptic Substances
Some antibiotics have been tested for transport and/or inhibition of hOCTs. It was observed that trimethoprim is transported by hOCT1, hOCT2, hMATE1, and hMATE2-K, that ethambutol is transported by hOCT1, hOCT2, hOCTN1, and hOCTN2, and that tetracyclin is transported by MATE-K2. Cephaloridrine and levofloxacin have been identified as substrates of hOCTN2 and hMATE1, respectively. Des-fluoro (6)-quinolone has been identified as high-affinity inhibitor of hOCT2, hMATE1, and hMATE2-K and leucomycin as inhibitor of hOCT2, hMATE1, and hMATE2-K. The antiseptic compounds chlorhexidine, ethylacridinium, and tetrachlorosalicylanilide are high-affinity inhibitors of hOCTs. Chlorhexidine inhibits hOCT2, hMATE1, and hMATE2-K, whereas ethylacridinium and tetrachlorosalicylanilide inhibit hOCT2.
I. Antifungal, Antiparasitic, and Antiviral Drugs
The antifungal drugs clotrimazole, dichlorophene, and griseofulvin have been identified as inhibitors of hOCT1, and Gentian violet and sulconazole as inhibitors of hOCT2. Ketoconazole inhibits several hOCTs (Table 9).
Interaction with hOCTs has been also demonstrated for several antiparasitic drugs. Pentamidine is transported by hOCT1, hOCT2, and MATE2-K and inhibits hOCT3 and hMATE1. Quinine is transported by hMATE1 and hMATE2-K and inhibits hOCT1–3. Bithionol and pyrimethamine inhibit hOCT1, hOCT2, hMATE1, and hMATE2-K, and closantel inhibits hOCT1. The antímalarial prodrug proguanil and its active metabolite cycloguanil have been identified as substrates of hOCT1, hOCT2, hOCT3, and hMATE1.
The antiviral drugs acyclovir and ganciclovir are transported by hOCT1, MATE1, and MATE2-K; lamivudine is transported by hOCT1–3; amantadine and cobistat by hOCT2; and ribavirin by hOCTN1. Moreover, the antiviral drugs indinavir, ritonavir, abacavir, emtricitabine, tenofir disoproxil fumate, nelfinavir, saquinavir, dolutegravir, rimantadine, and darunavir have been identified as inhibitors of hOCTs (Table 9).
VIII. Genetic Variants in Human Organic Cation Transporters
A. Genetic Variants in Human Organic Cation Transporter 1
SLC22A1 coding for hOCT1 is highly polymorphic. Twenty-seven nonsynonymous SNVs have been analyzed for impact of transporter function and/or expression (Table 8). The SNVs have different effects on transport of different cations. Various nonsynonymous SNVs result in almost complete elimination of transport activity for all tested substrates (Ser29Leu, Cys88Arg, Gly220Val, Pro283Leu, Glu284Lys, Arg287Gly, Gly465Arg). This may be due to blockage of plasma membrane targeting, as demonstrated for Ser29Leu and Glu284Lys (Seitz et al., 2015), or to substrate-independent disruption of transport activity. Variants Gln97Lys, Pro117Leu, and Arg206Cys appear to decrease transport activity in a substrate-independent way. In case of Arg206Cys, this appears to be due to impaired plasma membrane targeting (Seitz et al., 2015). Arg61Cys, Ser189Leu, and Met420del are examples for genetic variants that cause substrate-dependent effects. The functional effects of these variants may involve changes in Km and/or Vmax values with corresponding effects on uptake rates measured at different substrate concentrations.
Nonsynonymous genetic variants of human organic cation transporters with analyzed impact on function and/or expression
MAFs reported from different groups are presented in the order of their appearance in the literature. Superscript letters indicate the numbers of employed individuals in the studies: a, 200; b, 60; c, 20; d, 455; e, 570; f, 220; g, 116; h, 240; i, 3023; k, 125; l, 150; m, 96; n, 7968; o, 160; p, 120; q, 100; r, 623; s, 89; t, 136; u, 68. References in which the indicated MAFs are reported are printed in italics. SLC22A1: Ser14Phe: Shu et al., 2003; More et al., 2010; Seitz et al., 2015, Ser29Leu: Seitz et al., 2015, Phe41Leu: Itoda et al., 2004, Arg61Cys: Kerb et al., 2002; Shu et al., 2003; Chen et al., 2010b, 2017b; More et al., 2010; Saadatmand et al., 2012; Tzvetkov et al., 2012, 2013, 2018; dos Santos Pereira et al., 2014; Dujic et al., 2015; Seitz et al., 2015; Matthaei et al., 2016, 2019, Leu85Phe: Shu et al., 2003, Leu85Phe: Shu et al., 2003, Cys88Arg: Kerb et al., 2002; Saadatmand et al., 2012; Dujic et al., 2015; Seitz et al., 2015, Gln97Lys: Chen et al., 2010b, Pro117Leu: Itoda et al., 2004; Seitz et al., 2015, Phe160Leu: Kerb et al., 2002; Shu et al., 2003; Itoda et al., 2004; Sakata et al., 2004; Kang et al., 2007; Chen et al., 2010b, Ser189Leu: Shu et al., 2003; More et al., 2010; Seitz et al., 2015, Pro197Ser: Herraez et al., 2013; Seitz et al., 2015, Arg206Cys: Yoon et al., 2013; Seitz et al., 2015, Gly220Val: Shu et al., 2003; Chen et al., 2010b; More et al., 2010; Seitz et al., 2015, Thr245Met: Seitz et al., 2015, Pro283Leu: Sakata et al., 2004; Kang et al., 2007, Glu284Lys: Seitz et al., 2015, Arg287Gly: Sakata et al., 2004, Pro341Leu: Shu et al., 2003; Itoda et al., 2004; Kang et al., 2007; Chen et al., 2010b; More et al., 2010; Yoon et al., 2013, Arg342His: Shu et al., 2003; Gly401Ser: Kerb et al., 2002; Shu et al., 2003; Chen et al., 2010b, 2017b; More et al., 2010; Saadatmand et al., 2012; Tzvetkov et al., 2012, 2018; dos Santos Pereira et al., 2014; Dujic et al., 2015; Seitz et al., 2015; Matthaei et al., 2019, Met408Val: Kerb et al., 2002; Shu et al., 2003; Itoda et al., 2004; Kang et al., 2007; Chen et al., 2010b; More et al., 2010, Gly414Ala: Kerb et al., 2002, Met420del: Kerb et al., 2002; Shu et al., 2003, 2007; More et al., 2010; Saadatmand et al., 2012; Tzvetkov et al., 2012, 2013, 2018; dos Santos Pereira et al., 2014; Dujic et al., 2015; Seitz et al., 2015; Chen et al., 2017b; Liang et al., 2018; Matthaei et al., 2019, Met440Ile: Shu et al., 2003, Ile449Thr: Seitz et al., 2015, Val461Ile: Shu et al., 2003, Gly465Arg: Kerb et al., 2002; Shu et al., 2003; Chen et al., 2010b; More et al., 2010; Saadatmand et al., 2012; Dujic et al., 2015; Arg488Met: Shu et al., 2003. SLC22A2: Pro54Ser: Leabman et al., 2002, Pro160Ser: Leabman et al., 2002, Phe161Leu: Leabman et al., 2002, Met165Val: Leabman et al., 2002, Met165Ile: Leabman et al., 2002, Thr199Ile: Kang et al., 2007; Song et al., 2008a, Yoon et al., 2013, Thre201Met: Kang et al., 2007; Song et al., 2008a; Yoon et al., 2013, Ala270Ser: Leabman et al., 2002; Kang et al., 2007; Song et al., 2008a,b; Chen et al., 2009a, 2017b; Zolk et al., 2009a; Yoon et al., 2013; Teft et al., 2017, Ala297Gly: Leabman et al., 2002, Arg400Cys: Leabman et al., 2002, Lys432Gln: Leabman et al., 2002. SLC22A3: Thr44Met: Chen et al., 2010a, Ala116Ser: Chen et al., 2010a, Leu186Phe: Chen et al., 2010a, Met370Ile: Lazar et al., 2008, Val388Met: Chen et al., 2010a, Thr400Ile: Chen et al., 2010a; Yoon et al., 2013, Val423Phe: Chen et al., 2010a; Yoon et al., 2013, Ala439Val: Nies et al., 2011b, Gly475Ser: Nies et al., 2011b. SLC22A4: Val159Met: Urban et al., 2007, Asp165Gly: Urban et al., 2007, Met205Ile: Urban et al., 2007; Dujic et al., 2015, Arg282Stop: Urban et al., 2007, Ile306Thr: Urban et al., 2007; Toh et al., 2009; Yoon et al., 2013; Futatsugi et al., 2016, Gly462Glu: Kawasaki et al., 2004, Leu503Phe: Peltekova et al., 2004; Newman et al., 2005b; Taubert et al., 2005; Urban et al., 2007, 2008; Toh et al., 2009; Pochini et al., 2012; Yoon et al., 2013; Dujic et al., 2015; Futatsugi et al., 2016. SLC22A5: Phe17Leu: Urban et al., 2006, Trp132Stop: Koizumi et al., 1999; Tang et al., 1999, Leu144Phe: Urban et al., 2006, Met179Leu: Koizumi et al., 1999, Tyr211Cys: Vaz et al., 1999, Arg282Stop: Vaz et al., 1999; Wang et al., 1999, Trp283Cys: Koizumi et al., 1999, Met352Arg: Seth et al., 1999, Tyr401Stop: Wang et al., 1999, Tyr449Asp: Urban et al., 2006; Amat di San Filippo et al., 2008, Ser467Cys: Koizumi et al., 1999; Ohashi et al., 2002, Glu475Arg: Wang et al., 2000a, Pro478Leu: Seth et al., 1999; Tang et al., 1999; Urban et al., 2006, Val481Phe: Urban et al., 2006, Val481Ile: Urban et al., 2006, Phe508Leu: Urban et al., 2006, Met530Val: Urban et al., 2006, Pro549Ser: Urban et al., 2006. SLC47A1: Val10Leu: Kajiwara et al., 2009, Gly64Asp: Chen et al., 2009b; Kajiwara et al., 2009; Yoon et al., 2013, Leu125Phe: Chen et al., 2009b, Kim et al., 2013; Yoon et al., 2013, Thr159Met: Meyer zu Schwabedissen et al., 2010, Ala310Val: Kajiwara et al., 2009, Asp328Ala: Kajiwara et al., 2009; Meyer zu Schwabedissen et al., 2010, Val338Ile: Chen et al., 2009b; Meyer zu Schwabedissen et al., 2010, Asn474Ser: Kajiwara et al., 2009, Val480Met: Chen et al., 2009b, Cys497Ser: Chen et al., 2009b, Cys497Phe: Meyer zu Schwabedissen et al., 2010, Gln519His: Chen et al., 2009b. SLC47A2: Lys64Asn: Kajiwara et al., 2009; Yoon et al., 2013, Pro162Leu: Choi et al., 2011, Gly211Val: Kajiwara et al., 2009; Yoon et al., 2013, Gly393Arg: Choi et al., 2011, Thr505Ile: Choi et al., 2011, Ala525Thr: Choi et al., 2011.
One SNV in the promoter region of hOCT1 −510 T>C (rs1867351) was associated with a decreased transporter expression (Tzvetkov et al., 2009). In tumor cell lines, splice variants of hOCT1 have been identified, some of which are not targeted to the plasma membrane (Hayer et al., 1999; Herraez et al., 2013).
Tzvetkov and coworkers investigated the abundance of 19 nonsynonymous SNVs in populations from America, Europe, Central Asia, North Africa plus Middle East, and Sub-Saharan Africa, and determined their effects on transport of various substrates (Seitz et al., 2015). They defined 16 different main groups of haplotype allele combinations. In addition to one group called OCT1*1 with WT activity comprising seven allele combinations, they defined 15 groups (OCT1*2–16) containing one to three different allele combinations, which exhibit more than 50% decreased or increased transport activity of at least one substrate. The authors demonstrated a strong interethnic variability of some genetic variations (Seitz et al., 2015). Interethnic variability of reduced function variants Pro341Leu and Met420del becomes apparent from the major allele frequencies (MAFs) indicated in Table 8.
In the upstream 5-kb DNA sequence of hOCT1, 11 SNVs with allele frequencies >1% were observed; however, no effect on hOCT1 transcription was identified (Bokelmann et al., 2018). At variance it was observed that a very rare SNV in the promoter (−201C>G) decreased hOCT1 transcription in the luciferace assay (Bokelmann et al., 2018).
B. Genetic Variants in Human Organic Cation Transporter 2
In the coding region of SLC22A2, 10 nonsynonymous SNVs that are rare in many investigated populations and one variant (Val270Ser) with relatively high abundance in all investigated populations were observed (Table 8). For Ala270Ser, minor allele frequencies between 0.09 and 0.16 were determined. Two nonsynonymous genetic variants with relatively high MAFs in Koreans (Thr199Ile MAF 0.01, Thr201Met MAF 0.02) and the variant Ala270Ser led to strongly decreased transport of individual substrates. In variants Thr199Ile and Thr201Met, the Vmax values for MPP transport were decreased by 95% or 96%, and the apparent Km values were increased 3.7- or 7.5-fold, whereas for metformin transport both Vmax and apparent Km values were decreased. Although partially divergent data were reported from different laboratories, also the Ala270Ser variant is supposed to induce substrate-specific effects. Thus, differential effects on Vmax and/or apparent Km values were reported for MPP, metformin, and propranolol (Table 8).
C. Genetic Variants in Human Organic Cation Transporter 3
In SLC22A3, nine nonsynonymus SNVs were identified that are rare in most investigated populations (Table 8). One exception is variant Thre44Met with a MAF of 0.017 in African Americans (Chen et al., 2010a). For variants Met370Ile, Thr400Ile, and Val423Phe, functional changes have been described.
Eight SNVs with minor MAFs between 0.01 and 0.29 have been detected in the promoter of hOCT3 (Lazar et al., 2003; Chen et al., 2013; Kwon et al., 2018). One SNV in the proximal promoter (−2G>A), which was observed with high frequencies in African American, European American, Asian American, and Mexican American populations (MAFs between 0.32 and 0.55), was not detected in individuals from Korea (Chen et al., 2013; Kwon et al., 2018). For the seven SNVs observed in the Korean population, MAFs between 0.01 and 0.29 were determined (Kwon et al., 2018). The three abundant SNVs in the Korean population with MAFs of 0.26 (−1603G>A), 0.26 (−1547T>G), and 0.29 (−29G>A) are mostly linked, forming a promoter haplotype (H2) with a frequency of 0.24 (Kwon et al., 2018). For the most abundant promoter haplotype without any of the observed SNVs (H1), a frequency of 0.70 was determined. Functional effects on hOCT3 transcription were observed for the −2G>A SNV observed in the American population and the H2 promoter haplotype detected in the Korean population. In the luciferase promoter assay, higher transcription was observed in the −2A>−2G variant and in the H2 versus H1 haplotype. Various SNVs were also detected in the 3′ untranslated sequence of the hOCT3 gene. One of these SNVs (rs2076828, C>G) caused a decreased transcription of hOCT3 in the luciferase assay (Chen et al., 2015).
D. Genetic Variants in Human Novel Organic Cation Transporter 1
In the exons of SLC22A4, four rare nonsynonymous genetic variants (Val159Met, Asp165Gly, Met205Ile, Gly462Glu), two frequent nonsynonymous genetic variants (Thr306Ile, Leu503Phe), and one rare stop codon after the triplet coding Arg285 were observed (Table 8). The MAF of variant Leu503Phe is largely different in diverse populations. In the rare variants Asp165Gly and Gly462Glu, transport of TEA and betaine was absent or largely decreased, respectively. For the most frequent mutant Thr306Ile, only minor effects on transport of TEA and betaine were observed. Mutant Leu503Phe, which is very frequently observed in Europeans and Canadians, showed complex functional changes. Whereas the Vmax values for ergothioneine and carnitine were decreased by about 50%, the Vmax values for TEA and acetylcholine were increased or unchanged, respectively. In contrast, the apparent Km values for ergothioneine and TEA were decreased, for L-carnitine increased, and for acetylcholine unchanged. Hence, this variant causes differential effects on transport of different cations, which are dependent on substrate concentrations.
In the promoter of hOCTN1, six SNVs with high MAFs in different populations were observed that did not show effects on transcription in luciferase reporter assays (Tahara et al., 2009). One SNV in intron 1 located in a RUNX1 binding site has been shown to change transcription (Tokuhiro et al., 2003).
E. Genetic Variants in Human Novel Organic Cation Transporter 2
The frequency of nonsynonymous SNVs in the SLC22A5 gene is very low (Table 8). Many identified nonsynonymous SNVs represent mutants of hOCTN2 with abolished or largely decreased L-carnitine transport, which was identified in patients suffering from SCD (see Genetic Variants in SLC22A5 Cause Primary Systemic Carnitine Deficiency). In screening for genetic variants in a group of 540 individuals from different ethnic groups, variants showing higher MAFs in individual populations were observed (Table 8). For some nonsynonymous SNVs, differential effects on transport activity, Vmax, and apparent Km of different substrates were observed.
In position −207 of the hOCTN2 promoter, cytidine was found to be monomorphic in the Asian American population, whereas hOCTN2 −207G haplotypes were frequently observed in African American and European American populations (Tahara et al., 2009). The −207G variant was associated with increased transcription in luciferase reporter assays (Peltekova et al., 2004). In individuals suspicious for SCD in which no nonsynonymous SNV causing SCD was detected, a −149G>A exchange was identified that generated a novel functional out-of-frame AUG initiation codon (Ferdinandusse et al., 2019). It was demonstrated that this initiation codon suppressed protein translation from WT ATG, resulting in a reduced expression of L-carnitine transport.
F. Genetic Variants in Human Multidrug and Toxin Exclusion 1
In SLC47A1, 12 nonsynonymous SNVs have been identified (Table 8). The genetic variants were rare (MAF <0.008) with the exceptions of Val10Leu in Japanese, Leu125Phe in Koreans, and Val338Ile and Cys497Ser in Africans. Whereas no effect on transport was observed for Val10Leu, in variant Gly64Asp transport of all tested substrates was reduced by at least 90%. In variants Ala310Val and Asp328Ala, the Vmax values for TEA transport were decreased.
In the promoter of hMATE1, two SNVs have been identified (−32G>A, −66T>C) that decrease promoter activity (Kajiwara et al., 2007; Ha Choi et al., 2009). The MAF of −32G<A was 0.037 in a Japanese population (Kajiwara et al., 2007), whereas for −66T>C, MAFs between 0.23 and 0.45 were obtained in different American populations (Ha Choi et al., 2009). In the −32G>A variant, binding of the transcription factor Sp1 was decreased.
G. Genetic Variants in Human Multidrug and Toxin Exclusion 2 Kidney-Specific
Six nonsynonymous SNVs have been identified in SLC47A2 (Table 8). Pro162Leu, Gly211Val, Thr505Ile, and Ala525Thr are expressed relatively abundantly (MAF > 0.015) in Africans, Asians, and/or Japanese. In variant Gly211Val, uptake of TEA and metformin was almost abolished, whereas in variant Pro162Leu uptake of TEA, metformin, and trospium was decreased between 75% and 85%.
In the basal promoter of hMATE2-K, four SNVs were identified. The most abundant SNV (−130G>A) with MAFs between 0.26 in European Americans and 0.49 in Asian Americans showed higher promoter activity in the presence of the transcription factor MZ1 (Choi et al., 2011).
IX. Effects of Genetic Variants in Organic Cation Transporters on Drug Treatment
A. Treatment of Type 2 Diabetes with Metformin
Metformin is the first-line drug for the treatment of T2D. It reduces blood glucose by inhibiting gluconeogenesis and increasing glycogensynthesis in the liver, by increasing insulin senitivity and peripheral glucose uptake, and probably also by altering lipid metabolism (Kirpichnikov et al., 2002; Rena et al., 2013; Kashi et al., 2016). At the molecular level, inhibition of mitochondrial glycerol-3-phosphate dehydrogenase, interference with glucagon signaling, and activation of AMP-stimulated protein kinase (AMPK) are involved (Zhou et al., 2001; Kirpichnikov et al., 2002; Musi et al., 2002; Miller et al., 2013; Madiraju et al., 2014). Metformin is a hydrophilic base that is positively charged at physiologic pH and is not metabolized (Sirtori et al., 1978). After oral application, about 50% of metformin is absorbed in small intestine (Pentikäinen et al., 1979; Tucker et al., 1981). In the blood, metformin does not bind to plasma proteins (Sirtori et al., 1978). The bulk of metformin is eliminated in the kidney by glomerular filtration and by tubular secretion (Pentikäinen et al., 1979; Scheen, 1996; Graham et al., 2011). Genetic variability of pharmacokinetics and pharmacodynamics of metformin has been described (Cook et al., 2007; Graham et al., 2011).
hOCT1–3, hOCTN1, hMATE1, and hMATE2-K that accept metformin as substrate (Table 4) may be involved in absorption, cellular uptake, and excretion of metformin. In the BBM of small intestinal, hOCT1, hOCT3, and hOCTN1 may be engaged in the first step of metformin absorption in parallel with the monamine transporter PMAT (Müller et al., 2005; Zhou et al., 2007; Han et al., 2013; Nakamichi et al., 2013) (Fig. 5). In renal proximal tubules, metformin secretion may be mediated by hOCT2 and hOCT3 in the basolateral membrane, in combination with hMATE1, hMATE2-K, and hOCTN1 in the BBM (Fig. 7). Of note, ultrafiltrated metformin in the tubular lumen may also be reabsorbed. hOCT1, hOCTN1, hMATE1, and hMATE2-K in the BBM, and hOCT2 and hOCT3 in the basolateral membrane may be involved. Metformin uptake into hepatocytes is mediated by hOCT1 and hOCT3 in the sinusoidal membrane, whereas hMATE1 in the biliary membrane may mediate metformin secretion into the bile (Nies et al., 2011b) (Fig. 6). Expression of hOCT1, hOCT3, hOCTN1, and hMATE1 in skeletal muscle and adipose tissue (Table 7) suggests that these transporters are engaged in metformin uptake into skeletal muscle cells and fat cells. The abundant expression of hOCT3 in skeletal muscle and the immunohistochemical localization of hOCT3 to the plasma membrane of the muscle cells suggest a pivotal role of hOCT3 for metformin uptake, enabling the metformin effect on metabolism in muscle (Chen et al., 2010a).
Because several OCTs contribute to the pharmacokinetics and/or pharmacodynamics of metformin and reduced function of individual transporter variants may be compensated for by upregulation of colocated transporters, it is difficult to elucidate the biomedical impact of individual OCTs. Moreover, effects of genetic variants in individual OCTs on pharmacokinetics and/or pharmacodynamics of metformin may only become apparent under specific physiologic or pathophysiological conditions and/or in context of appropriate genetic environments.
Effects of reduced-function variants of hOCT1, hOCT2, hOCT3, hOCTN1, and hMATE1 on pharmacokinetics and pharmacodynamics of metformin and/or on side effects of metformin treatment have been reported. In healthy young individuals, diverging results were obtained after oral metformin application. In one study, the peak blood concentration of metformin was increased in individuals with reduced-function hOCT1 variants, whereas renal metformin clearance was not changed (Shu et al., 2008). In another study, no increase of the peak blood concentration of metformin and no change of renal metformin clearance were observed (Christensen et al., 2015). In a third study, no effect of reduced-function hOCT1 variants on peak blood concentrations of metformin was detected, whereas renal metformin clearance was increased (Tzvetkov et al., 2009). A recent 11C PET study revealed that hepatic uptake of orally applied metformin was decreased in reduced-function hOCT1 variants (Sundelin et al., 2017). In healthy individuals, it was also observed that the effect of metformin to decrease blood glucose during an oral glucose tolerance test (OGTT) was blunted in individuals with reduced-function hOCT1 variants (Shu et al., 2007). In conclusion, in healthy individuals reduced-function alleles of hOCT1 appear to be associated with decreased metformin uptake into the liver, which may change the effect of metformin on the peak blood glucose after oral glucose uptake. Due to effects of reduced-function alleles of hOCT1 on the total metformin distribution volume and on renal metformin reabsorption, the pharmacokinetics of metformin may be affected.
Effects of reduced-function SNVs in hOCTs on metformin-induced reduction of hemoglobin A1c (Hb1Ac) had been observed in some studies with European T2D patients using small sample sizes (Becker et al., 2009a; Christensen et al., 2011) but could not be approved in studies using large European populations (Zhou et al., 2009; Dujic et al., 2017). The studies with small groups of T2D patients revealed partially contradicting results. For example, in one study reduced-function hOCT1 variants did not change the peak metformin concentration after oral metformin application, whereas in another study the trough serum concentration of metformin was decreased (Christensen et al., 2011, 2015).
In addition to data suggesting an impact on hepatic metformin uptake and renal reabsorption, data were obtained that implicate that intestinal metformin absorption is impaired in reduced-function variants of hOCT1. Namely, gastrointestinal side effects that are observed in about 25% of patients treated with metformin were correlated with reduced-function variants of hOCT1 (Tarasova et al., 2012). Gastrointestinal side effects are supposed to be caused by high metformin concentrations in the intestinal lumen that may influence SE secretion and metabolism of glucose and/or incretins, and/or induce bile-salt reabsorption (Wilcock and Bailey, 1994; Bailey et al., 2008; Bouchoucha et al., 2011).
Few clinical studies on the effect of hOCT2 variants on pharmacokinetics or pharmacodynamics of metformin were performed in which effects of the most abundant variant Ala270Ser were investigated, although diverging results concerning the impact of Ala270Ser on hOCT2-mediated metformin uptake have been reported. Thus, using transient overexpression in HEK293 cells, Song et al. (2008a) observed that the Vmax of metformin uptake was decreased by 47%, whereas the apparent Km and the expression level were not altered. Comparing HEK293 cells that had been stably transfected with reference hOCT2 or the Ala270Ser variant, Chen et al. (2009a) observed an increased expression that was associated with a 35% increase of Vmax of metformin uptake, whereas the apparent Km remained unchanged. Studying the effect of the Ala270Ser variant on the pharmacokinetics of orally applied metformin in young healthy volunteers, the peak blood concentration of metformin was increased in Korean and Chinese populations, suggesting a decreased renal metformin secretion (Song et al., 2008a; Wang et al., 2008; Yoon et al., 2013). However, the peak blood concentration was not changed in a mixed population of African and European Americans (Chen et al., 2009a) and in a Caucasian population (Christensen et al., 2013). Consistently, the renal clearance was decreased in the Asian populations (Song et al., 2008a; Wang et al., 2008), only slightly increased in the American populations (Chen et al., 2009a), and not changed in Caucasian populations (Tzvetkov et al., 2009; Christensen et al., 2013). In Caucasians, a SNV in the promoter of hMATE1 (−66T>C) that decreased hMATE1 expression influenced the impact of the Ala270Ser variant in hOCT1 on renal metformin clearance (Christensen et al., 2013). In a study including 7968 European T2D patients, no effect of Ala270Ser on metformin-induced decrease of blood Hb1Ac was observed (Dujic et al., 2017). In summary, the most abundant genetic variant in hOCT2 that probably decreases metformin uptake may influence the pharmacokinetics and pharmacodynamics of metformin, but does not exhibit a relevant effect on glycemic response to metformin in European T2D patients.
In the amino acid sequence of hOCT3, only very rare variants were observed. To date, it has not been investigated whether the two rare hOCT3 variants (Thr400Ile, Ala423Phe) that reduce the Vmax for metformin uptake (Table 8) (Chen et al., 2010a) and the two SNVs in the hOCT3 promoter that increase transcription (Chen et al., 2013; Kwon et al., 2018) have impact on the pharmacokinetics and/or pharmacodynamics of metformin. However, it was observed in healthy individuals that a SNV in the 3′-untranslated region that decreased transcription (rs2076828) was associated with a blunted metformin-mediated downregulation of the increase of blood glucose during the OGTT (Chen et al., 2015).
Although hOCTN1 is located in the BBM of small intestine and renal proximal tubules (Figs. 5 and 7) and transports metformin (Nakamichi et al., 2013), the identified variants of hOCTN1 have not been tested for metformin uptake (Table 8). In a small Korean population, in which the Thr306Leu variant of hOCTN1 is highly abundant, higher blood peak concentrations of metformin were observed after oral metformin application in individuals carrying the Thr306Leu variant compared with individuals without this variant (Yoon et al., 2013). However, in a large population of European T2D patients, no impact on metformin-induced reduction of blood Hb1Ac was correlated with the Thr306Leu variant (Dujic et al., 2017).
In hMATE1, six amino acid variants were identified that lead to reduced metformin transport after expression in cells (Table 8). The highest MAFs of these variants were observed for Leu125Phe in Mexicans (0.05) and for Val338Ile in Africans (0.05). Due to low MAFs, only heterozygous reduced-function alleles have been employed for clinical testing in a preliminary study on Japanese T2D patients (Toyama et al., 2010). In this study, no effect of reduced function alleles on the oral clearance of metformin was observed.
Impact of a highly frequent SNV in the hMATE1 promoter (−66T>C) that decreases expression on metformin pharmacokinetics and pharmacodynamics was tested (Ha Choi et al., 2009; Stocker et al., 2013). In healthy individuals from a mixed Asian, African, and European population, no effect on metformin pharmacokinetics was detected. However, in healthy individuals and T2D patients, a reinforced metformin-mediated reduction of HbA1 in the blood was observed (Stocker et al., 2013). Studying a large population of metformin-treated European T2D patients, no correlation between the −66T>C variant and blood Hb1Ac was detected (Dujic et al., 2017).
A frequent intronic SNV of hMATE1 (rs2289669) with a MAF of 0.43 in Caucasians has been described that increased the therapeutic effect of metformin (Becker et al., 2009b). In aged T2D patients, presence of this SNV was correlated with a reinforced metformin-induced decrease of the Hb1Ac concentration in the blood. This SNV probably decreases the expression of hMATE1 in hepatocytes, resulting in an increase of intracellular metformin. Of note, the effect of SNV rs2289669342 was only observed in individuals carrying alleles with SNV rs622342, which decreases expression of hOCT1 (Becker et al., 2010). Thus, downregulation of hMATE1 in hepatocytes may be only critical for the therapeutic relevant concentration of intracellular metformin if hOCT1-mediated metformin uptake is moderate. At variance, no correlation between the rs2289669 variant and blood Hb1Ac was observed in a large population of metformin-treated European T2D patients (Dujic et al., 2017).
To evaluate the impact of hMATE2-K on the efficacy of metformin treatment, the correlation between alleles with SNV −130G>A in the hMATE2-K promoter that increases hMATE2-K expression and blood Hb1Ac was investigated in T2D patients treated with metformin (Choi et al., 2011). The frequent promoter polymorphism (MAF of 0.26 in a mixed group of African Americans and Caucasians) that increases hMATE2-K expression was correlated with an attenuation of metformin-induced decrease of Hb1Ac. However, this correlation also was not confirmed in an analysis using a large group of European T2D patients (Dujic et al., 2017).
B. Antineoplastic Treatment with Cisplatin
Since approval by the FDA in 1978, cisplatin (cis-diamminedichloroplatinum) is in clinical use for treatment of cancer. Because serious side effects including nephrotoxicity, neurotoxicity, and ototoxicity (Wang and Lippard, 2005; Pabla and Dong, 2008) limit therapy with cisplatin, additional platinum-based cytostatics such as carboplatin, oxaliplatin, picoplatin, and cis-diammine(pyridine) platinum (II) were developed. Carboplatin and oxaliplatin are in clinical use. They show less nephrotoxicity than cisplatin; however, they have different antitumor specificities (Ardizzoni et al., 2007; Schuler et al., 2010; Ho et al., 2016; Liu et al., 2016a). Currently, cisplatin is employed for treatment of bladder cancer, cervical cancer, ovarian cancer, non-small cell lung cancer, malignant mesothelioma, squamous cell carcinoma of head and neck, and cancer of testis (Kelland, 2007; Cutler and Choo, 2011; Ishikawa et al., 2014). After treatment of testicular cancer with cisplatin, 90% to 95% of patients survive (Raghavan, 2003). Cisplatin is predominantly eliminated by excretion in renal proximal tubules. Nephrotoxicity of cisplatin due to cisplatin enrichment in the tubular cells is the main limiter in therapy (dos Santos et al., 2012).
In addition to OCTs, the copper transporter CTR1 (SLC31A1) and the P-ATPases ATP7A and ATP7B accept cisplatin as substrate (Samimi et al., 2004; Larson et al., 2009). Cisplatin is transported by hOCT1, hOCT2, hMATE1, and hMATE2-K, among which hOCT2 is most effective (Table 4) (Ciarimboli et al., 2005b; Yonezawa et al., 2006; Yokoo et al., 2007; Filipski et al., 2008; Sprowl et al., 2013). Whereas the impact of genetic variants in hOCT1, hMATE1, and hMATE2-K on cisplatin treatment has not been explored, it has been investigated whether the Ala270Ser variant in hOCT2 affects clearance and/or nephrotoxicity of cisplatin (Filipski et al., 2008, 2009; Iwata et al., 2012). After expression of the hOCT2 variant Ala270Ser in cells, transport of TEA, MPP, and propranolol was decreased compared with hOCT2 WT type (Table 8). However, a decrease of cisplatin uptake has not been verified. Due to the relatively low allele abundance of the Ala270Ser variant, clinical studies were employed with heterocygote patients. No significant effect of the Ala270Ser variant on total or renal cisplatin clearance was observed (Filipski et al., 2008); however, data were obtained, suggesting that the nephrotoxicity of cisplatin is decreased in patients carrying the Ala270Ser variant. Consistently, different from control patients, no decrease of renal creatinine clearance was observed when patients with the Ala270Ser variant were treated with cisplatin (Filipski et al., 2009; Iwata et al., 2012). The data suggest that hOCT2 is critically involved in cisplatin uptake across the basolateral membrane of renal proximal epithelial cells, although CTR1 is also located in this membrane (Pabla et al., 2009).
C. Treatment of Myeloid Leukemia with Imatinib
The tyrosine kinase inhibitor imatinib is used for the first-line treatment of CML that is due to the abnormal presence of a unique fusion gene, termed BCR-ABL1 (Goldman and Melo, 2003). In about 80% of patients, imatinib induces complete cytogenic remission (O’Brien et al., 2003; Kantarjian et al., 2004). However, primary and secondary resistance attenuates or prevents the therapeutic effect in some of the patients (Marin et al., 2008). In addition to two genetic variants in the kinase domain of BCR-ABL1 preventing imatinib-mediated tyrosine kinase inhibition (Kantarjian et al., 2003), imatinib resistance may result from changed functions of transporters that adjust the imatinib concentration within the myeloma cells. In human acute myeloma cell lines, several transporters are expressed that are supposed to accept imatinib as substrate (Hu et al., 2008; Harrach et al., 2016). Expressing these transporters in oocytes and HEK293 cells, data were obtained that suggest that cellular influx of imatinib is mediated by the human OAT peptides 1A2 and 1B3, by hOCTN1, and by hMATE1, whereas imatinib efflux is mediated by p-glycoprotein ABCB1 and breast cancer resistance protein ABCG2 (Table 4) (Hu et al., 2008; Harrach et al., 2016). Because it was observed that imatinib uptake into lymphoblastoid cells and mononuclear cells of peripheral blood derived from CML patients was reduced by the hOCT1 inhibitors prazosine and amantadine, it was concluded that hOCT1 transports imatinib (Thomas et al., 2004; White et al., 2007). This interpretation is probably false because the employed inhibitors were not specific for hOCT1 (Table 4) and no significant hOCT1-mediated uptake of imatinib was detected when hOCT1 was expressed in oocytes, epithelial and leukemic mammalian cell lines, and/or primary CD34+ cells from CML patients (Hu et al., 2008; Nies et al., 2014; Blanc Mettral et al., 2019). In one divergent study, Harrach et al. (2016) observed 2-fold higher cellular imatinib uptake in a HEK293 cell line, which was stably transfected with hOCT1 than in mock-transfected HEK293 cells. However, they did not control whether the expression of other imatinib transporters was unaffected in this cell line. Various clinical studies revealed that the abundance of hOCT1-mRNA was correlated with the therapeutic effect of imatinib (Crossman et al., 2005; Marin et al., 2010; Nardinelli et al., 2012; Zhong et al., 2012; Gromicho et al., 2013). Nevertheless, because correlations between gene expression of ABCB1, SLC22A1, and/or ABCG2 have been observed (Gromicho et al., 2013), it is possible that the observed changes in hOCT1 mRNA abundance were associated with changed expression of another transporter involved in imatinib uptake or efflux. Because hOCT1 transports endogenous compounds such as choline, thiamine, and histamine (Table 2), which may have an impact on metabolism and/or functional state of the myeloma cells, changes in hOCT1 expression may indirectly influence the therapeutic effect of imatinib.
About 20 clinical studies were perfomed in which the effects of various polymorphisms in hOCT1, including variants Leu160Phe, Met408Val, and Met420del, on clinical outcome after treatment of CML patients with imatinib were investigated. These studies revealed inconsistent, mostly nonreproducible data that do not allow an unambiguous interpretation (Gromicho et al., 2013; Watkins et al., 2015).
D. Analgetic Treatment with Tramadol
The analgetic opoid tramadol has a high passive membrane permeability and is not transported by hOCT1. In the liver, the active metabolite O-desmethyltramadol is formed by the P450 cytochrome CYP2D6 (Paar et al., 1992). The metabolite has a 10-fold lower passive membrane permeability than the parental drug and is transported by hOCT1 (Tzvetkov et al., 2011). After a single oral dose of tramadol, the increase of the plasma concentrations of O-desmethyltramadol was significantly higher in individuals containing one or two inactive hOCT1 alleles (Tzvetkov et al., 2011). In parallel, tramadol-induced miosis, a surrogate marker of the central analgetic tramadol effect, persisted longer in individuals with inactive hOCT1 variants (Tzvetkov et al., 2011). It has been hypothesized that tramadol is absorbed in small intestine via passive diffusion and passively enters the hepatocytes where it is metabolized to O-desmethyltramadol. The bulk of O-desmethyltramadol is supposed to be released into the blood by a nonidentified transporter but partially re-enters the hepatocytes via hOCT1. In hepatocytes, O-desmethyltramadol may also be glucuronidated and excreted into the bile. In brain, hOCT1-mediated transport may be involved in passage of O-desmethyltramadol across the BBB (Fig. 9). The observed increase of O-desmethyltramadol in the blood of individuals with inactive hOCT1 alleles suggests that the reuptake of O-desmethyltramadol into hepatocytes is critical in pharmacokinetics. In another study, it has been demonstrated that, in addition to genetic variants in CYP2D6, which affect the formation of O-desmethyltramadol (Stamer et al., 2003; Pedersen et al., 2006), reduced-function variants of hOCT1 are also clinically relevant (Stamer et al., 2016). Employing patient-controlled application of tramadol after surgery, the consumption of tramadol was measured in patients in relation to CYP2D6 and SLC22A1 genotypes. The tramadol consumption was negatively correlated with metabolic active CYP2D6 alleles, indicating that poor metabolizers required more tramadol. In addition, tramadol consumption was negatively correlated with nonfunctional SLC22A1 alleles, suggesting that blunting of uptake of the active metabolite O-desmethyltramadol into hepatocytes increases the analgetic effect.
E. Pain-Relieving Treatment with Morphine and Antitussive Treatment with Codeine
In response to treatment of pain with morphine, interindividual and ethnic differences have been described (Cepeda et al., 2001; Edwards et al., 2005). These differences have been shown to be partially due to genetic variants in hOCT1 that transports morphine with high affinity and efficacy (Tzvetkov et al., 2013) (Table 4). About 90% of morphine is glucuronidated by uridine 5′-diphosphate glucuronosyltransferase 2B7 (Coffman et al., 1997) and excreted in the liver, whereas about 10% is excreted unchanged in the urine (Osborne et al., 1990; Hasselström and Sawe, 1993). Under clinical conditions, more than 60% of morphine uptake into hepatocytes is supposed to occur via hOCT1 (Tzvetkov et al., 2013). In children treated with morphine for pain relief after tonsillectomy, the abundance of nonfunctional hOCT1 alleles was correlated with low morphine clearance and high abundance of morphine-related adverse effects such as nausea, vomiting, and respiratory depression (Fukuda et al., 2013; Venkatasubramanian et al., 2014; Balyan et al., 2017). The higher abundance of nonfunctional hOCT1 alleles in the Caucasian versus African American population provides an explanation why more adverse effects during morphine treatment were observed in Caucasian versus African American children (Sadhasivam et al., 2012a,b).
The antitussive drug codeine enters hepatocytes by passive diffusion. In the hepatocytes codeine is demethylated to morphine by cytochrome P4502D6 (CYP2D6) (Dayer et al., 1988). Morphine may be glucuronidated in the hepatocytes and excreted with the bile or may leave the hepatocyte by passive diffusion or via a not yet identified transporter across the sinusoidal membrane. Morphine in the blood is distributed throughout the body and may re-enter the hepatocytes via hOCT1 (Tzvetkov et al., 2013). At low morphine plasma concentrations, hOCT1-mediated morphine uptake largely exceeds passive diffusion and is critical for the concentration of morphine in the blood. In individuals containing one or two inactive hOCT1 alleles, the plasma concentration of morphine during treatment with codeine was more than 2-fold than in individuals with two active hOCT1 alleles (Tzvetkov et al., 2013).
F. Treatment of Side Effects of Chemotherapy with Tropisetron
The SE receptor 5-hydroxytryptamine 3 antagonist tropisetron is employed for treatment of nausea and vomiting during chemotherapy of cancer. In the liver, tropisetron is metabolized by CYP2D6, and CYP2D6 polymorphisms have been linked to interindividual variations during antiemetic treatment (Kaiser et al., 2002). Tropisetron is a substrate of hOCT1, and cancer patients receiving chemotherapy in which vomiting was treated with tropisetron showed 3-fold less vomiting events when they contained one or two nonfunctional SLC22A1 alleles compared with patients in which both SLC22A1 alleles were functional (Tzvetkov et al., 2012). Consistently, the higher efficacy of the antiemetic therapy with tropisetron was correlated with higher concentrations of tropisetron in the blood.
G. Treatment of Migraine with Sumatriptan
Like other 5-hydroxy tryptamine 1B/DF receptor agonists, sumatriptan is employed for treatment of migraine. Sumatriptan has a low oral bioavailability due to a limited small intestinal absorption and a distinctive first-pass metabolism involving monoaminooxidase A in liver, intestine, and some other organs (Grimsby et al., 1990; Dixon et al., 1994; Saura et al., 1996). After intravenous application of sumatriptan to healthy individuals with loss of function alleles of hOCT1, a higher blood concentration and reduced apparent distribution volume of the drug were observed compared with individuals with functional hOCT1 alleles (Matthaei et al., 2016). These effects are supposed to be due to a reduced hepatic uptake leading to slowed-down metabolism. The data suggest an increased risk for adverse side effects during treatment with sumatriptan in patients with loss-of-function polymorphisms of hOCT1.
H. Treatment of Asthma with Fenoterol
The β2-adrenergic agonist fenoterol is employed in various countries for treatment of asthma and for tocolysis in obstetrics, although it may cause cardiovascular and metabolic side effects. The side effects are correlated with high blood concentrations of the drug and include hypokalemia, arrhythmia, hypotension, and hyperglycemia, and may be associated with fatal outcome (Spitzer et al., 1992; Bremner et al., 1993). Because more than 99% of fenoterol in the blood is positively charged, transporters are required to allow passage of fenoterol across plasma membranes (Hochhaus and Möllmann, 1992). Fenoterol is metabolized by sulfation and glucuronidation in the liver and mostly eliminated as metabolite (Hochhaus and Möllmann, 1992). Fenoterol is transported by hOCT1 and hOCT3 with apparent Km values of 1.8 and 20 µM, respectively (Tzvetkov et al., 2018). The lower Km value and higher abundance of hOCT1 in the sinusoidal membrane of hepatocytes strongly suggest that fenoterol uptake into hepatocytes is mainly mediated by hOCT1. In accordance with this notion, after intravenous application of fenoterol in healthy individuals containing nonfunctional hOCT1 alleles, higher blood concentrations were observed compared with individuals with two functional hOCT1 alleles (Tzvetkov et al., 2018). In addition, side effects of fenoterol treatment such as higher heart rate, drop in diastolic blood pressure, and increase of blood glucose correlated with the abundance of nonfunctional hOCT1 alleles. The data suggest that patients with nonfunctional hOCT1 variants are a risk group for adverse effects during treatment with fenoterol.
I. Treatment of Malaria with Proguanil
Proguanil is a prodrug that is employed for prophylaxis and treatment of malaria (Wattanagoon et al., 1987). In the blood, more than 99% of proguanil is positively charged. Proguanil is transported into hepatocytes via hOCT1 and to a small extent by hOCT3 (Matthaei et al., 2019). In hepatocytes, the active metabolite cycloguanil is formed by cytochrome P4502C19 (Coller et al., 1997; Hoskins et al., 1998). Cycloguanil attacks pre-erythrocytic malaria parasite forms in the liver and malaria parasites within erythrocytes (Delves et al., 2012). The transporter(s) mediating efflux of positively charged cycloguanil from hepatocytes has (have) not been identified. Cycloguanil–proguanil exchange via hOCT1 may be involved. In healthy individuals treated with proguanil, the concentration of cycloguanil and the cycloguanil/proguanil ratio in the blood was correlated with functionality of hOCT1 alleles, whereas no correlation was observed for the blood concentration of proguanil (Matthaei et al., 2019). These data suggest that the formation of cycloguanil is dependent on hOCT1-mediated influx, that hepatic efflux of cycloguanil may occur by hOCT1-mediated cycloguanil–proguanil antiport, and that polymorphisms in hOCT1 may be one reason for the failure of proguanil treatment in patients (Kaneko et al., 1999).
X. Drug–Drug Interactions of Substrates and Inhibitors at Organic Cation Transporters
A. General Considerations
Clinical tests in healthy and diseased individuals represent the only reliable method to evaluate interaction of drugs that are substrates and/or inhibitors of OCTs in humans. The reasons are that cellular test systems do not represent the complexity of in vivo interactions and that animal models do not mimic human features sufficiently. This includes differences in properties, expression and regulation of OCTs, and transporters from other families that transport organic cations. The interpretation of clinically observed drug–drug interactions requires a detailed pharmacokinetic characterization of the involved drugs, an established understanding of transporter expression and function including disease-related changes, and a well-founded knowledge concerning interactions of the respective drugs with individual transporters. To select drugs for clinical testing of drug–drug interactions, knowledge concerning functions of OCTs in different organs, about transported substrates, and about Km and IC50 values is required.
Reflecting on in vivo drug–drug interactions at the level of OCTs, interaction of drugs at one OCT type in one location, interaction of drugs at one OCT type in different locations, and interaction of drugs at different OCT types operating in concert, must be considered. Although transport of many drugs by hOCTs (Table 4) and inhibition of hOCTs by many drugs have been investigated (Tables 4 and 9), the anticipation of an in vivo interaction of two drugs at one OCT at a specific location remains uncertain, rendering the anticipation of effects of in vivo interactions of drugs with OCTs in different locations highly speculative. One reason is that the IC50 values that have been determined for inhibition of OCTs by drugs only reflect individual experimental conditions. Thus, the IC50 values of OCTs are not only dependent on the structure of the employed substrate but also on the substrate concentration (Gorboulev et al., 2018), and most available IC50 values have not been determined using appropriate drugs at clinically relevant concentrations as substrates. In addition, the IC50 values for OCTs mediating cellular export such as hMATE1, hMATE2-K, and hOCTN1 have been determined by measuring uptake rather than efflux. Another reason for the insecurity of in vivo predictions is that, at variance to drug concentrations in systemic and portal blood, intracellular drug concentrations and drug concentrations in the lumen of renal proximal tubules are not known. Intracellular drugs may induce trans-stimulation if they are well-transported substrates, or trans-inhibition if they are nontransported inhibitors that have entered the cells by an alternative transporter. Ultrafiltrated cationic drugs within the lumen of renal proximal tubules that may have been concentrated during water reabsorption may inhibit transporters in the BBM that mediate cellular efflux of secreted drugs such as hMATE1, hMATE2-K, or hOCTN1. Drugs in the tubular lumen may be reabsorbed and increase the concentration of the respective drug within tubular cells.
Drugs that have been shown to inhibit human organic cation transporters and have not been tested for transport or could not be identified as substrate (only drugs for which an IC50 value <20 µM was determined for at least one OCT are indicated)
Charge of major microspecies at pH 7.4 was calculated with program MarvinSketch of ChemAxon. Abacavir: Minuesa et al., 2009, abemaciclib: Chappell et al., 2019, adapalene: Kido et al., 2011, alfuzosin: Chen et al., 2017a, amitriptyline: Sata et al., 2005; Ahlin et al., 2008; Zolk et al., 2009b; Belzer et al., 2013; Tzvetkov et al., 2013; Jouan et al., 2014; Hacker et al., 2015; Matthaei et al., 2016; Sandoval et al., 2018; Zhu et al., 2018, amadiaquine: van der Velden et al., 2017, D- amphetamine: Amphoux et al., 2006, amsacrine: Ahlin et al., 2008, artemisin: Hubeny et al., 2016, atomoxetine: Sandoval et al., 2018, azidothymidine: Minuesa et al., 2009, beclomethasone: Lips et al., 2005, benzethonium: Kido et al., 2011, benztropine: Sandoval et al., 2018, bithionol: Kido et al., 2011; Wittwer et al., 2013; Chen et al., 2017a, bosutinib: Johnston et al., 2014, bucindolol: Ahlin et al., 2008, 2011, budesonide: Lips et al., 2005, buflomedil: Kido et al., 2011; Hendrickx et al., 2013, buspirone: Wittwer et al., 2013, Sandoval et al., 2018, bisoprolol: Bachmakov et al., 2009, camylofine: Chen et al., 2017a, carbetapentane: Chen et al., 2017a, carvedilol: Bachmakov et al., 2009; Zolk et al., 2009b; Grube et al., 2011; Belzer et al., 2013; Yin et al., 2016; Chen et al., 2017a, clemastine: Ahlin et al., 2008, clomacran: Kido et al., 2011, chlorhexidine: Wittwer et al., 2013, cediranib: Johnston et al., 2014, chlorphenesin: Kido et al., 2011, chlorpromazine: Bednarczyk et al., 2003; Ahlin et al., 2008, 2011; Zolk et al., 2009a; Belzer et al., 2013, citalopram: Ahlin et al., 2008; Koepsell et al., unpublished data, clomipramine: Ahlin et al., 2008; Hendrickx et al., 2013, clonidine: Zhang et al., 1998; Wu et al., 2000; Müller et al., 2005; Suhre et al., 2005; Ahlin et al., 2008; Zolk et al., 2009a; Astorga et al., 2012; Belzer et al., 2013; Hendrickx et al., 2013; Tzvetkov et al., 2013; Chen et al., 2017a, closantel: Chen et al., 2017a, clotrimazole: Chen et al., 2017a, clozapine: Hendrickx et al., 2013; Wang et al., 2019, codeine: Tzvetkov et al., 2013, darunavir: Moss et al., 2015, dasatinib: Minematsu and Giacomini, 2011, des-fluoro(6)-quinolone: Okuda et al., 2006; Imamura et al., 2011; dextromethorphan: Chen et al., 2017a, dichlorophene: Chen et al., 2017a, desipramine: Gorboulev et al., 1997; Zhang et al., 1998; Wu et al., 2000; Ahlin et al., 2008, 2011; Tsuda et al., 2009b; Zolk et al., 2009b; Chen et al., 2017a, desloratadine: Zolk et al., 2009b, dicyclomine: Kido et al., 2011, dipyramidole: Kido et al., 2011, dobutamine: Chen et al., 2017a, dolutegravir: Reese et al., 2013; Lepist et al., 2014, domperidone: Wittwer et al., 2013, donepezil: Martínez-Guerrero et al., 2016; Matthaei et al., 2016, desloratadine: Zolk et al., 2009b, dihydroergotamine: Wittwer et al., 2013, doxazosin: Ahlin et al., 2011, doxepin: Zolk et al., 2009b; Belzer et al., 2013; Hacker et al., 2015; Chen et al., 2017a, eletriptan: Matthaei et al., 2016, epinastine: Wittwer et al., 2013, erlotinib: Minematsu and Giacomini, 2011; Chen et al., 2017a, esmolol: Martínez-Guerrero et al., 2016, ethinylestradiol: Wittwer et al., 2013, ethylacridinium: Belzer et al., 2013, exemestane: Kido et al., 2011, fenfluramine: Zolk et al., 2009a, flecainide: Umehara et al., 2008; Zolk et al., 2009b; Grube et al., 2011; Belzer et al., 2013, flurazepam: Zolk et al., 2009a,b, gabexate: Kido et al., 2011; Wittwer et al., 2013, gefitinib: Galetti et al., 2010; Minematsu and Giacomini, 2011, gentian violet: Kido et al., 2011, granisetron: Wittwer et al., 2013, griseofulvin: Chen et al., 2017a, guanabenz: Kido et al., 2011; Chen et al., 2017a, guanfacine: Astorga et al., 2012, imipramine: Wu et al., 2000; Ahlin et al., 2008; Tsuda et al., 2009b; Zolk et al., 2009b; Kido et al., 2011; Belzer et al., 2013; Hendrickx et al., 2013; Tzvetkov et al., 2013; Sandoval et al., 2018; Zhu et al., 2018, imiquimod: Astorga et al., 2012, indinavir: Zhang et al., 2000; Jung et al., 2008; Wittwer et al., 2013, irinotecan: Tzvetkov et al., 2013; Wittwer et al., 2013; Sandoval et al., 2018; Zhu et al., 2018, jatrorrhizine: Sun et al., 2019, ketoconazole: Ahlin et al., 2011; Astorga et al., 2012; Chen et al., 2017a, ketotifen: Martínez-Guerrero et al., 2016, lansoprazole: Nies et al., 2011a; Hacker et al., 2015, leukomycin: Wittwer et al., 2013, mebeverine: Kido et al., 2011, 3,4-methylenedioxymethamphetamine: Amphoux et al., 2006, mexiletine: Zolk et al., 2009b; Sandoval et al., 2018, mefloquine: Hubeny et al., 2016, midazolam: Zhang et al., 1998, mitoxantrone: Meyer zu Schwabedissen et al., 2010; Wittwer et al., 2013, nelfinavir: Zhang et al., 2000; Jung et al., 2008, nifekalant: Wittwer et al., 2013, nilotinib: Minematsu and Giacomini, 2011, ondansetron: Kido et al., 2011; Tzvetkov et al., 2012, 2013; Wittwer et al., 2013; Lechner et al., 2016; Zhu et al., 2018, oxaliplatin: Yonezawa et al., 2006; Yokoo et al., 2007, 2008; Ahlin et al., 2008, 2011; Jong et al., 2011; Sprowl et al., 2013, olanzapine: Kido et al., 2011, omeprazole: Nies et al., 2011a; Martínez-Guerrero et al., 2016, orphenadrine: Ahlin et al., 2008; Kido et al., 2011, pantoprazole: Nies et al., 2011a; Wittwer et al., 2013; Hacker et al., 2015, phenoxybenzamine: Hayer-Zillgen et al., 2002; Ahlin et al., 2008, phentoloamine: Astorga et al., 2012, phenyltoloxamine: Kido et al., 2011, phenytoin: Hasannejad et al., 2004, prochlorperazine: Ahlin et al., 2008; Hendrickx et al., 2013; Martínez-Guerrero et al., 2016, procyclidine: Kido et al., 2011, proguanil: Astorga et al., 2012; van der Velden et al., 2017, promazine: Ahlin et al., 2008, propafenone: Ahlin et al., 2008, 2011; Zolk et al., 2009b; Grube et al., 2011; Belzer et al., 2013; Hendrickx et al., 2013; Chen et al., 2017a, propantheline bromide: Kido et al., 2011, pyrimethamine: Matsushima et al., 2009; Tsuda et al., 2009b; Astorga et al., 2012; Hubeny et al., 2016; Lechner et al., 2016; Yin et al., 2016; Chen et al., 2017a; van der Velden et al., 2017, quetiapine: Wang et al., 2019, rabeprazole: Kido et al., 2011; Nies et al., 2011a, repaglinide: Ahlin et al., 2008; Bachmakov et al., 2008, rapamycin: Meyer zu Schwabedissen et al., 2010, rimantadine: Wittwer et al., 2013, ritonavir: Zhang et al., 2000; Jung et al., 2008; Meyer zu Schwabedissen et al., 2010; Wittwer et al., 2013; Lepist et al., 2014; Kikuchi et al., 2019, rosiglitazone: Bachmakov et al., 2008, saquinavir: Zhang et al., 2000; Jung et al., 2008, scopolamine: Hendrickx et al., 2013; Chen et al., 2017b, sitagliptin: Hacker et al., 2015, sparteine: Kido et al., 2011, spironolactone: Grube et al., 2006, 2011; Ahlin et al., 2011; Hacker et al., 2015, sulconazole: Kido et al., 2011, sunitinib: Minematsu and Giacomini, 2011; Chen et al., 2017a, tacrine: Kido et al., 2011; Astorga et al., 2012; Chen et al., 2017a; Sandoval et al., 2018; tenatoprazole: Nies et al., 2011a, tenofovir disoproxil: Minuesa et al., 2009; Shen et al., 2017, irtetrachlorosalicylanilide: Kido et al., 2011, tolterodine: Kido et al., 2011, tramadol: Astorga et al., 2012, trimipramine: Ahlin et al., 2008; Hacker et al., 2015, tripilenamine: Sandoval et al., 2018, tubocurarine: Wittwer et al., 2013, valspodar: Lechner et al., 2016, vecuronium: Wittwer et al., 2013, zafirlukast: Wittwer et al., 2013, ziprasidone: Wang et al., 2019, zolpidem: Hacker et al., 2015.
Anticipating potential drug–drug interactions at OCTs, transport inhibition of drugs that are present at concentrations close to their respective Km values and inhibition of drugs with concentrations far below their respective Km values must be distinguished. In the first case, inhibition is mediated by drug interaction at low-affinity sites that are probably directly involved in transport, whereas in the second case allosteric inhibition by interaction of inhibitors with high-affinity cation binding sites may be observed. The clinically approved drug–drug interactions at the level of OCTs reflect interactions at the low-affinity sites.
B. Interactions of Drugs during Treatment of Type 2 Diabetes with Metformin
hOCT1–3, hOCTN1, hMATE1, and hMATE2-K accept metformin as substrate and are supposed to be involved in intestinal metformin absorption, metformin uptake into hepatocytes, muscle cells and fat cells, and/or in renal metformin secretion (Figs. 5–7; Tables 4 and 6). The critical role(s) of hOCT1, hOCT2, hMATE1, and/or hMATE2-K for pharmacokinetics and/or pharmacodynamics of metformin has (have) been supported by clinical studies in healthy individuals and/or T2D patients with reduced-function genetic variants (see Treatment of Type 2 Diabetes with Metformin). In this context, it is not surprising that coadministration of metformin with drugs that are transported by OCTs and/or inhibit OCTs changed the metformin concentration in the blood, renal metformin excretion, and/or the therapeutic effect of metformin on diabetes (Wang et al., 2008; Kusuhara et al., 2011; Cho et al., 2014; Dujic et al., 2015). Thus, coadministration of metformin with citalopram, verapamil, or codeine representing high-affinity inhibitors of individual OCTs (Tables 4 and 9) to T2D patients was correlated with metformin intolerance (Dujic et al., 2015). In case of verapamil, metformin intolerance is supposed to be induced by inhibition of hOCT1-mediated metformin uptake into hepatocytes because coadministration of verapamil with metformin blunted the glucose-lowering effect of metformin without changing either the metformin concentration in the blood or renal metformin clearance (Cho et al., 2014).
Coadministration of cimetidine with metformin decreased renal metformin clearance, suggesting clinically relevant interactions of cimetidine with OCTs in renal proximal tubules that mediate metformin secretion (Somogyi et al., 1987; Wang et al., 2008). Cimetidine has been identified as substrate of hOCT1, hOCT2, hMATE1, and hMATE2-K and as inhibitor of hOCT3, hOCTN1, and hOCTN2 (Table 4). Because no cimetidine effect on renal metformin clearance was observed in patients containing the Ala270Ser polymorphism in hOCT2 that decreases translocation of some substrates (Table 8), it has been suggested that a cimetidine–metformin interaction at hOCT2 may be responsible for the observed cimetidine-induced decrease of metformin clearance (Wang et al., 2008). However, this interpretation may be false because it was observed later on that metformin transport mediated by hMATE1 and hMATE2-K rather than by hOCT2 can be inhibited at clinical relevant cimetidine concentrations in the blood (Tsuda et al., 2009b; Ito et al., 2012b).
A decrease of renal metformin secretion was also observed after coadministration of pyrimethamine, which is used to treat protozoal infections (Kusuhara et al., 2011). In this case, the metformin concentration in the blood was slightly increased. It has been reported that pyrimethamine inhibits transport mediated by hOCT1, hOCT2, hMATE1, and hMATE2-K (Table 9). Because the IC50 values determined for inhibition of hMATE1 or hMATE2-K by pyrimethamine were more than 100-fold lower compared with the IC50 values obtained for inhibition of hOCT2, and the mean blood concentration of unbound pyrimethamine during treatment is more than 10-fold lower than the IC50 value for inhibition of hOCT2, pyrimethamine probably decreases metformin secretion by inhibition of hMATE1 and hMATE2-K similar to cimetidine.
C. Interactions of Drugs during Treatment of Cancer with Cisplatin
The clinical use of cisplatin during treatment of malignancies is limited by nephrotoxicity (dos Santos et al., 2012). It has been shown that cisplatin is transported by hOCT1, hOCT2, hMATE1, and hMATE2-K (Table 4). Because hOCT2 transports cisplatin with high efficacy and patients carrying hOCT2 alleles coding for an amino acid exchange affecting translocation of several cations exhibited a blunted cisplatin-induced nephrotoxicity, hOCT2 is supposed to be critically involved in renal cisplatin secretion (Filipski et al., 2009; Iwata et al., 2012). Hence, coadministration of drugs that inhibit hOCT2-mediated uptake of cisplatin across the basolateral membrane of renal tubular cells represents an attractive strategy to prevent cisplatin-induced nephrotoxicity. However, because hMATE1 and/or hMATE2-K may be critical for cellular efflux of cisplatin across the BBM, drugs inhibiting hOCT2 that also inhibit hMATE1 and/or hMATE2-K may increase the intracellular cisplatin concentration and thereby promote cisplatin-induced nephrotoxicity. In a clinical trial including 18 patients, protective effects of cimetidine and verapamil on nephrotoxicity during cisplatin treatment of cancer patients were observed (Sleijfer et al., 1987). This suggests more effective inhibition of cisplatin transport by hOCT2 versus hMATE1 and hMATE2-K under clinical conditions or a minor role of the MATE transporters for cisplatin efflux. Of note, in vitro measurements revealed that cimetidine inhibits metformin transport by hMATE1 and hMATE2-K with higher affinity compared with hOCT2 (Tsuda et al., 2009b; Ito et al., 2012b). Thus, in vitro determination of IC50 values for inhibition of cisplatin uptake by the three transporters using clinically relevant concentrations is recommended before further clinical evaluation of protective effects of cimetidine, verapamil, or other drugs should be performed.
D. Decrease of Renal Drug Clearance by Cimetidine
Upon coadministration of cimetidine, the renal clearance of various drugs transported by OCTs is decreased in addition to metformin clearance (Ito et al., 2012b). Cimetidine, which is used for treatment of heartburn and stomach ulcers, can be obtained without prescription. Coadministration of cimetidine reduced the renal excretion of the diuretic amiloride (Somogyi et al., 1989), the antibiotic cephalexin (van Crugten et al., 1986), the antiallergic fexofenandine (Yasui-Furukori et al., 2005), the antiarrhythmic procainamide (Somogyi and Heinzow, 1982; Rodvold et al., 1987), the antacid ranitidine (van Crugten et al., 1986), the antiepileptic gabapentin (Urban et al., 2008), and varenicline, which is used to support smoking cessation (Feng et al., 2008). The data suggest that cimetidine inhibits secretion of these drugs in renal proximal tubules by inhibiting hOCT2-mediated uptake across the basolateral membrane or inhibiting efflux across the BBM, which may be mediated by hMATE1, hMATE2-K, hOCTN1, and/or hOCTN2 (Fig. 7). Transport of these drugs by the individual OCTs has not been investigated in sufficient details. The available data indicate that amiloride is transported by hOCT1, hOCT2, and hMATE2-K; cephalexin and fexofenandine are transported by hMATE1; procainamide by hOCT1–3, hMATE1, and hMATE2-K; ranitine and varenicline by hOCT1 and hOCT2; and gabapentin by hOCTN1 (Table 4). To identify the individual OCTs in which the pharmacokinetically relevant interactions with cimetidine occur, the IC50 values for cimetidine inhibition of transport of the individual drugs must be determined and effects of mutations with abolished cimetidine transport in individual OCTs on renal cimetidine evaluated. In any case, the increased blood concentrations of procainamide, gabapentin, and varenicline during coadministration of cimetidine must be considered to minimize side effects such as disturbances of cardiorhythm after treatment with procainamide, ataxia, dizziness, and drowsiness after treatment with gabapentin, and insomnia and nausea after uptake of varenicline.
XI. Diseases That Are Associated with Genetic Variants in Organic Cation Transporters
A. General Considerations
Because OCTs are involved in uptake, excretion, and tissue distribution of endogeneous compounds like neurotransmitters, essential nutrient components such as creatinine and ergothioneine, and toxic compounds like aflatoxin, polymorphisms of OCTs may change physiologic functions and influence emergence of diseases and their course of healing as well as the overcoming of intoxications. Due to overlapping selectivities between OCTs and polyspecific transporters of other families, effects of genetic variants with changed function in individual OCTs are often compensated for. Thus, there is only one example that genetic variants in an individual OCT cause a specific disease, namely primary systemic carnitine deficiency that is caused by defect mutations in hOCTN2 (Longo et al., 2016). More frequently, change of function variants in OCTs has been associated with higher prevalence of diseases, for example polymorphisms in hOCTN1 and hOCTN2 with Crohn’s disease (CD) (Newman et al., 2005a; Palmieri et al., 2006). In such cases, an unequivocal identification of the causal relationships has not been achieved. In addition to effects of function and/or expression on pathogenesis, the expression of OCTs may be changed throughout the course of diseases and may influence the outcome. Examples are a reduced hepatic expression of hOCT1 during cholestasis and carcinoma (Nies et al., 2009; Schaeffeler et al., 2011), an increased expression of hOCT1 in fat tissue of morbid obese individuals (Moreno-Navarrete et al., 2011), and a decreased cardiac expression of hOCTN2 in patients with dilated cardiomyopathy (Grube et al., 2011). Disease-induced changes in expression of OCTs may also impact the pharmacodynamics of drugs if they are transported by the respective transporters.
B. Association of Human Organic Cation Transporter 1 Variants with Blood Lipids, Blood Isobutylcarnitine, and Body Weight
Comprehensive worldwide genome analyses revealed associations of genetic variants of hOCT1 with blood levels of total cholesterol and LDL (Liang et al., 2018). For example, variant Met420del, in which the apparent Km value for thiamine uptake was increased by about 50% and the Vmax value was decreased by 60% (Table 8), was significantly associated with the increase of total cholesterol and LDL in the blood. These associations were also observed for the hOCT1 variants Pro341Leu and Val408Met, which showed decreased expression in some tissues (Innocenti et al., 2011; Battle et al., 2017). Combining reduced-function and protein truncation variants, a strong association of the variants with increased body weight was observed. Because the hOCT1 variants were not linked to other risk loci for high serum lipids or obesity, reduced functions of hOCT1 represent risk factors for metabolic syndromes. SNVs in the hOCT1 gene, which are linked with variants Arg61Cys or Met420del, were shown to be associated with a reduced serum concentration of isobutylcarnitine (Suhre et al., 2011; Kim et al., 2017). Because the hOCT1 variants exhibit decreased cellular efflux of acylcarnitines and hOCT1 is highly expressed in liver, the data suggest that reduced hepatic efflux of acylcarnitines causes decreased blood concentrations of acylcarnitines, which is supposed to influence lipid metabolism.
C. Association of a Single-Nucleotide Variant in SLC22A3 with Distal Colon Cancer
Genome-wide association studies (GWAS) have linked SNVs in hOCT3 to prostate cancer and colorectal cancer (True et al., 2006; Tomlins et al., 2007; Eeles et al., 2008; Cui et al., 2011). In an Asian population, it has been observed that a SNV within intron 5 of SLC22A3 was associated with prevalence of distal colon cancer (Cui et al., 2011). It has been shown that the expression of OCTs is altered in various tumors (Table 7). Expression of OCTs may be changed during malignant transformation. It may influence the course of tumor development because OCT-mediated uptake of endogeneous OCT substrates may influence tumor progression. In addition, changed expression of OCTs in tumors or genetic variants in OCTs may influence treatment with cytostatic drugs, as has been shown for the expression of hOCT2 during treatment of colorectal cancer patients with oxaliplatin (Tatsumi et al., 2013).
D. Potential Association of Single-Nucleotide Variants in SLC22A3 with Coronary Artery Disease and Obsessive-Compulsive Disorder
In a GWAS, the SLC22A3-LPAL2-LPA cluster on chromosome 6q26-q27 was identified as risk locus for coronary artery disease (Trégouët et al., 2009). LPA encodes apolipoprotein, and LPA2 is a pseudogene of apoliporotein 2. LPA has been associated with coronary artery disease (Brazier et al., 1999). Because hOCT3 is highly expressed in heart and an effective transporter of epinephrine, loss-of-function polymorphisms in hOCT3 may increase the extracellular epinephrine concentration in heart, promote vascular constriction, and increase heart rate.
Obsessive-compulsive disorder (OCD) is characterized by recurrent intrusive thoughts that are usually accompanied by distinct behavioral patterns. Potential genetic inheritance of OCD has been established (Pauls et al., 1995). Disturbances of neurotransmitter systems including SE-related systems are involved (Albert et al., 2002). Sequencing the exons and the promoter region of SLC22A3 in 84 Caucasian children and adolescents with OCD, deletion of AG upstream of the start codon (−106/−107) and the Ile370Met exchange was observed in three patients and one patient, respectively, but not detected in 204 healthy individuals (Lazar et al., 2008). Because the AG deletion induced a decrease of promoter activity and the affinity of NE uptake mediated by hOCT3 was decreased in the Ile370Met mutant, it was suggested that reduced-function variants in SLC22A3 may contribute to the pathogenesis of OCD.
E. Association of Single-Nucleotide Variants in SLC22A4 with Rheumatoid Arthritis in Japanese
In a Japanese population, it was observed that a SNV in intron 1 of SCL22A4 that is located within a RUNX1 binding site, as well as a polymorphism in the RUNX1 gene, were associated with rheumatoid arthritis (RA) (Tokuhiro et al., 2003). The effects were independent from each other and were observed in homozygous and heterozygous alleles, respectively. In another study performed in Japan, no correlation between heterozygous carriers of the intronic SNV in SLC22A4 and RA was observed (Kuwahara et al., 2005). RA is characterized by inflammation of joint synovium with invasion of inflammatory cells and destruction of joints involving autoimmune processes (Goldbach-Mansky et al., 2000). Proliferation of inflammatory cells and autoimmune reactions may be influenced by RUNX1 that has been identified as hematopoietic transcription factor and has been shown to alter transcription via interaction with cofactors (Lutterbach and Hiebert, 2000; Helms et al., 2003). Both the SNV in the RUNX1 binding site of SLC222A4 and the polymorphism in RUNX1 probably alter expression of hOCTN1 that is expressed in synovium and leukocytes (Tokuhiro et al., 2003; Kobayashi et al., 2004). The SNV in the RUNX1 binding site observed in Japanese is less frequent in Canadian, Britain, and Spanish people. In these populations, no significant association between this SNV and RA could be established (Barton et al., 2005; Newman et al., 2005b; Martínez et al., 2006b). Also, in Dutch people, no association between the SNV in RUNX1 and RA was detected (Wesoly et al., 2005). The data suggest that the association between the SNV in the intron of SLC222A4 and the SNV in RUNX with RA observed in Japanese is not relevant or very seldom in various other populations and may be dependent on a specific genetic constellation (Lutterbach and Hiebert, 2000).
F. Association of Single-Nucleotide Variants in SLC22A4 with Diabetes Type 1
Type 1 diabetes (T1D) is most frequently caused by an autoimmune dysregulation. Because T1D is associated with a decreased blood concentration of L-carnitine (Winter et al., 1989; Mamoulakis et al., 2004) and L-carnitine increases the sensitivity of cells to insulin (Proulx et al., 1997), an impact of carnitine-transporting OCTs is conceivable. Hence, it was investigated in a Spanish population whether genetic variants in the SLC22A4 and/or SLC22A5 genes are associated with T1D. Four SNVs in SLC22A4 and one SNV in SLC22A5 were analyzed for association with T1D (Santiago et al., 2006). For one variant in SLC22A4, a significant association with TID was observed. In addition, a different haplotype distribution between TID patients and healthy individuals was observed. The data suggest an impact of hOCTN1 on T1D.
G. Genetic Variants in SLC22A5 Cause Primary Systemic Carnitine Deficiency
Loss-of-function mutations in hOCTN2 or SNVs in the promotor region cause the rare, recessively inherited disease SCD (Nezu et al., 1999; Tang et al., 1999; Wang et al., 1999). The incidence of SCD in newborns varies from 1:142,000 in USA to 1:300 in the Faroe Islands in the North Atlantic (Frigeni et al., 2017). Due to an abolished or impaired function of hOCTN2 in renal proximal tubules (Fig. 7), the renal reabsorption of L-carnitine is impaired in SCD. This leads to a decrease of the L-carnitine concentration in the serum and to low intracellular L-carnitine concentrations (Longo, 2016). L-carnitine has important metabolic functions that are particularly relevant during fasting and stress and for organs that rely on fatty acid oxidation such as heart and skeletal muscle. L-carnitine is essential for the transfer of long-chain fatty acids from the cytosol into the mitochondrial matrix, where β-oxidation takes place (Vaz and Wanders, 2002; Longo et al., 2016). L-carnitine is also required for the import of peroxisomal β-oxidation metabolites into mitochondria, allowing their complete oxidation (Vaz and Wanders, 2002). In addition, L-carnitine is a scavenger of reactive oxygen species and reduces the risk of oxidant injury (Ribas et al., 2010). During infancy SCD may cause hypoketotic hypoglycemia; Reye Syndrome, which is characterized by enzephalopathy with hyperammonia; and sudden infant death. Manifestations of SCD in adults include progessive skeletal muscle weakness and cardiomyopathy (Karpati et al., 1975; Stanley et al., 1991). SCD should be diagnosed in newborns by measuring the serum concentration of L-carnitine and L-carnitine uptake into cultivated skin fibroblasts and can be treated by lifelong supplementation with L-carnitine (Karpati et al., 1975; Treem et al., 1988; Lamhonwah et al., 2002; Frigeni et al., 2017).
H. Association of Single-Nucleotide Variants in SLC22A4 and/or SLC22A5 with Inflammatory Bowel Diseases
CD and ulcerative colitis (UC) are inflammatory bowel diseases (IBD) that have similar multifactorial etiologies, including genetic and environmental factors and disturbed interplay between intestinal microflora and T cell responses (Fiocchi, 1998; Elson, 2002). IBD susceptibility loci have been identified on chromosomes 16q, 12q, 6p, 14q, 5q, and 19p (Newman et al., 2005a). One IBD relevant locus (IBD1) is located on chromosome 16 and contains the CARD15 gene (Cuthbert et al., 2002; Lesage et al., 2002; Newman et al., 2004). Another IBD relevant locus (IBD5) was detected on chromosome 5q31 in the cluster coding for SCL22A4 and SLC22A5. It was observed that individuals containing a combined two-allele haplotype in the coding region of hOCTN1 and in the promoter of hOCTN2 called SLC22A-TC showed an increased risk for CD and UC (Rioux et al., 2001; Peltekova et al., 2004; Newman et al., 2005a; Babusukumar et al., 2006; Palmieri et al., 2006; Russell et al., 2006). In hOCTN1, Leu503 was exchanged by phenylalanine, leading to decreased Km and Vmax values of ergothioneine transport, a decreased Km value and an increased Vmax value of L-carnitine transport, and decreased transport of betaine (see Leu503Phe in Table 8), whereas the promoter of hOCTN2 contained a −207G>C exchange that causes decreased transcription (Peltekova et al., 2004). Further investigations indicated that the association between the SLC22A-TC haplotype and CD was not observed in all populations and appears to depend on additional genetic factors (Leung et al., 2006; Martínez et al., 2006a; Silverberg et al., 2007). It has also been reported that the SLC22A-TC haplotype may be associated with UC (Waller et al., 2006) and that the Leu503Phe mutation in hOCTN1 alone can be a risk factor for CD (Silverberg et al., 2007). The Leu503Phe variant is supposed to cause an increased ergothioneine uptake into immune cells at physiologic low ergothioneine concentrations that may promote inflammations (Taubert et al., 2005). In summary, the expression of hOCTN1 in CD+ monocytes/macrophages probably plays a key role in the pathogenesis of CD (Mahida, 2000).
I. Association of Single-Nucleotide Variants in SLC47A1 with Chronic Kidney Disease
Chronic kidney disease (CKD) is a common illness with increasing prevalence that leads to kidney failure and death (Eckardt et al., 2013). The causes of CKD are diverse and multifactorial, including diseases like hypertension and diabetes, side effects of drugs, and genetic factors. CKD is accompanied by a decrease of glomerular filtration rate (GFR), which can be accurately determined measuring excretion of endogenous or exogeneous filtration markers and can be estimated by measuring serum creatinine (Scr) concentrations. Besides GFR, Scr is influenced by metabolic generation of creatinine in skeletal muscle and by renal creatinine secretion. Trying to explore genetic causes for CKD, GWAS were performed in which Scr levels were correlated with 67,093 Caucasian individuals from different populations and with 2230 Icelanders (Köttgen et al., 2010; Sveinbjornsson et al., 2014). In addition to various other genes that were correlated with altered Scr levels, it was observed that polymorphisms in SLC22A2 and SLC47A1 were associated with increased Scr (Köttgen et al., 2010; Sveinbjornsson et al., 2014). Using cystatin C as marker for GFR, a correlation of SLC47A1 with reduced GFP was confirmed at variance to SCL22A2. The data suggest an impact of hMATE1 on CKD and a critical involvement of hOCT2 in renal creatinine secretion.
XII. Insights in Potential Physiologic and Biomedical Functions of Human Organic Cation Transporters from Animal Experiments
A. General Considerations
In vivo studies with rodents in particular, with mice in which individual transporters had been removed genetically [knockout (KO) mice], provided valuable insights in potential physiologic and biomedical functions of OCTs. However, species differences between OCTs of humans and rodents impose severe limitations on the possibility to transfer conclusions obtained from the animal studies to humans. Concerning Km, Vmax, and IC50 values, differences between humans and rodents may be determined using transfected cell lines; however, it is almost impossible to fully resolve the differences in physiologic and biomedical in vivo properties. First, the tissue distributions, expression levels, and/or subcellular locations of OCTs may be different between rodents and humans. Second, the regulation of OCT expression levels and/or functional states of OCTs in response to different physiologic and pathophysiological conditions and different medial treatments may differ. Third, after removal of an individual OCT transporter in mice, transporters with overlapping substrate selectivity may be upregulated or downregulated. Fourth, due to different levels in brain development imposing limitations of behavioral tests performed in rodents, experiments on brain functions in rodents provide very limited information about humans. In contrast, animal experiments are necessary because many functional investigations cannot be performed in humans for ethical reasons, and studies in animals depict directions for clinical investigations.
B. Species Differences of Organic Cation Transporters between Rodents and Humans
For OCT orthologs of rodents and humans, partially different Km, Vmax, and/or IC50 values have been reported. For example, for uptake of ergothioneine by mouse OCTN1 (mOCTN)1, an apparent Km value of 4.7 µM was determined (Kato et al., 2010), whereas apparent Km values of 21 und 85 µM were reported for hOCTN1-mediated ergothioneine uptake (Gründemann et al., 2005; Futatsugi et al., 2016). For L-carnitine uptake by mOCTN2 and hOCTN2, respective apparent Km values of 22 and 3.5–5.0 µM were obtained (Tamai et al., 1998, 2000; Seth et al., 1999; Ohashi et al., 2002). Considering that different Km values for individual OCTs have been reported from different laboratories, the above-mentioned difference between orthologs could be partially due to different experimental conditions (Gorboulev et al., 2018). Employing side-by-side measurements under identical experimental conditions, Tzvetkov and coworkers (M. J. Meyer and M. V. Tzvetkov, unpublished data) determined Km values for uptake of several organic cations by hOCT1, mOCT1, and rOCT1. For several cations, they measured largely divergent apparent Km values between humans and rodents. In some cases, they also obtained smaller but significant differences between mouse and rat. For example, the apparent Km values for trospium transport by mOCT1 and rOCT1 were 9-fold and 4.5-fold lower compared with hOCT1, respectively. For ASP transport by mOCT1 and rOCT1, they obtained 5-fold and 3-fold lower Km than hOCT1, respectively, whereas the Km values for fenoterol transport by mOCT1 and rOCT1 were 2.5-fold and 2.3-fold higher compared with hOCT1.
After expression of rOCT1 and hOCT1 in oocytes, maximal MPP uptake rates of 180 and 3.7 pmol × occyte−1 × hour−1 were obtained, respectively (Zhang et al., 1997; Arndt et al., 2001). For inhibition of mOCT1-mediated MPP uptake by cimetidine, an IC50 value of 0.59 µM was obtained, whereas for inhibition of hOCT1-mediated uptake of different cations IC50 values between 95 and 2830 µM were determined (Zhang et al., 1998; Kakehi et al., 2002; Ciarimboli et al., 2004; Lee et al., 2009). The observation that TBuA is transported by hOCT1, but not by rOCT1 or mOCT1 (Dresser et al., 2000), is an example that the selectivity for transported cations may also be different.
Differences in expression and subcellular location between OCT orthologous may be exemplified as follows. Whereas the mRNA abundance of hOCT1 in human liver was more than 100 times higher compared with hOCT3 (Nies et al., 2009), a similar mRNA abundance of rOCT1 and rOCT3 mRNA was observed in rat liver (Slitt et al., 2002; Choudhuri et al., 2003). In both human and rat liver, OCT1 and OCT3 are located in the sinusoidal membrane of hepatocytes (Meyer-Wentrup et al., 1998; Nies et al., 2009). In human kidney, high expression of hOCT2 and low expression of hOCT1 with 20-fold lower mRNA abundance have been described (Motohashi et al., 2002; Nishimura and Naito, 2005). At variance, in rat kidney a similar, high expression of rOCT1 and rOCT2 has been observed (Slitt et al., 2002; Choudhuri et al., 2003). Of note, in renal proximal tubules, rOCT1, rOCT2, and hOCT2 are located in the basolateral membrane (Karbach et al., 2000; Motohashi et al., 2002, 2013), whereas hOCT1 has been localized to the BBM (Tzvetkov et al., 2009).
Species-dependent gender effects on expression of various OCTs have been described (Yonezawa et al., 2005; Sabolić et al., 2016). For example, in kidneys of male rats or mice, higher expression levels of OCT2 were observed, whereas the expression of hOCT2 in human kidney appeared to be independent of gender.
Differences in mRNA abundance of OCT orthologous between rodents and humans, as exemplified for OCT1 in kidney, implicate differences in tissue-specific transcriptional regulation. Considering species differences between promoter sequences and proteins that are involved in transcription and regulation of OCTs, considerable differences in regulation of expression of OCTs are expected. As presumed, large differences between rodents and humans were observed in short-term post-translational regulations of OCT orthologs (Schlatter, 2016). For example, rOCT-mediated transport of ASP is upregulated by PKA and PKC and downregulated by PKG, whereas hOCT1-mediated ASP transport is downregulated by PKA and not altered by PKC and PKG (Mehrens et al., 2000; Ciarimboli et al., 2004; Schlatter, 2016).
C. Studies in Knockout Mice on the Impact of Organic Cation Transporter 1 and Organic Cation Transporter 3 on Metabolism
Experiments with KO mice provided evidence for important roles of OCT1 and OCT3 in lipid and glucose metabolism, which are probably relevant for humans. The impact of these transporters is supposed to be linked to transport of thiamine by OCT1, and to transport of NE by OCT3 (Table 2).
Removal of OCT1 in mice resulted in decreased concentrations of thiamine and thiamine pyrophosphate in hepatocytes (Liang et al., 2018). The deficiency of thiamine in hepatocytes in OCT1-KO mice was associated with reduced activity of thiamine-dependent enzymes, including pyruvate dehydrogenase. This leads to disturbance of the glucose–fatty acid cycle and is combined with phosphorylation of regulatory proteins, including phosphorylation of AMPK. Thereby, glucose utilization was impaired, whereas fatty acid oxidation and gluconeogenesis were enhanced. These changes resulted in increased hepatic concentrations of glucose and glycogen, and to a decreased hepatic content of triglycerides, explaining the observation of a protective effect of OCT1 removal on diet-induced hepatic steatosis (Chen et al., 2014; Liang et al., 2018). The OCT1-KO mice had a higher body weight with increased fat content and decreased lean mass. In addition, blood concentrations of cholesterol and LDL were increased. Importantly, the metabolic changes induced by OCT1 removal were similar to changes during a thiamine-deficient diet. Although, in mouse liver, OCT3 is expressed to a similar level as OCT1 (Slitt et al., 2002; Choudhuri et al., 2003), OCT3 can apparently not compensate for OCT1 removal in mice. Therefore, and because similar apparent Km values were determined for thiamine uptake by hOCT1 and mOCT1 (Nies et al., 2009; Chen et al., 2014), the data concerning the role of OCT1 in hepatic thiamine uptake in mice are supposed to be relevant for humans. Inhibition of hOCT1-mediated thiamine uptake into hepatocytes by coapplication of drugs inhibiting hOCT1 may influence glucose–lipid metabolism and may exhibit some protection from hepatic steatosis.
Employing mice in which OCT3 was selectively removed in adipose tissue, it was discovered that OCT3 has a pivotal role in cold-induced, NE-mediated regulation of thermogenesis (Song et al., 2019). Mammalians contain white adipose tissue (WAT) that is responsible for triglyceride storage and can release fatty acids (Rosen and Spiegelman, 2014) and brown adipose tissue that is involved in nonshivering thermogenesis (Nedergaard et al., 2001). Brown adipose tissue is rich in mitochondria in which respiratory chain and ATP production are uncoupled. During prolonged cold exposure, WAT is transformed to thermogenetic beige fat tissue (Harms and Seale, 2013). This cold-induced transformation is mediated by NE that binds to the β3-adrenergic receptor and initiates a signal cascade leading to activation of fatty acid release from triglycerides and to transcription of proteins involved in thermogenesis (Peng et al., 2015). OCT3 is highly expressed in the plasma membrane of fat cells in WAT and plays a predominant role in the removal of NE from the intracellular space that terminates NE stimulation of the β3-adrenergic receptor (Ayala-Lopez et al., 2015). After subcutaneous injection of NE to mice, their body temperature was increased. This increase was more pronounced in adipose-specific OCT3-KO mice than in WT mice. After prolonged cold exposure, a more pronounced transformation of WAT to beige adipose tissue was observed in adipose-specific OCT3-KO than in WT mice (Song et al., 2019). This effect was combined with a larger increase of mitochondria abundance, of genes that are involved in biogenesis of mitochondria, and of thermogenetic genes. In addition, a more pronounced increase of glycolytic genes was observed, indicating an impact of OCT3 on glucose metabolism during cold exposure and stress. The data suggest an important role of OCT3 for lipid and glucose metabolism and energy consumption in humans and identify OCT3 as a potential target for treatment of metabolic diseases.
D. Studies in Knockout Mice on the Impact of Organic Cation Transporters on Treatment of Diabetes with Metformin
Studies on pharmacokinetics of orally or intravenously applied metformin in mice in which OCT1, OCT2, OCT1 plus OCT2, OCT3, OCTN1, or MATE1 had been removed provided important insights on the impact of OCTs on small intestinal absorption, hepatic uptake, and renal excretion of metformin. A transmission of the conclusions to humans is limited due to species differences.
Studies with OCT1-KO mice provided evidence that OCT1 is pivotal for uptake of metformin into hepatocytes and that metformin uptake via OCT3 cannot compensate for OCT1 removal (Wang et al., 2002; Shu et al., 2007; Higgins et al., 2012). Following oral and intravenous administration of metformin, 4-fold lower metformin concentrations were observed in the liver of OCT1-KO mice compared with WT mice. In the liver of OCT1-KO mice, phosphorylation of AMPK and acetyl-CoA carboxylase was lower as compared with WT mice, and the decreasing effect of metformin on fasting plasma glucose observed in WT mice kept on a high-fat diet was abolished (Shu et al., 2007). Because in the liver similar antidiabetic metabolic changes were observed after removal of OCT1, in response to thiamine-deficient diet, and after treatment with metformin, it has been proposed that the antidiabetic effect of metformin is partially due to inhibition of OCT1-mediated thiamine uptake into hepatocytes (Chen et al., 2014). Because the increase of metformin in the blood after oral application of metformin was not changed when OCT1 was removed, OCT1 in the BBM of small intestine may not contribute largely to intestinal metformin absorption in mice (Shu et al., 2007).
Tissue distribution and pharmacodynamics of orally applied metformin were also altered when OCT3 was removed (Wang et al., 2002). After intravenous application of metformin, lower metformin accumulation was observed in various organs, including skeletal muscle, heart, liver, and adipose tissue in OCT3-KO as compared with WT mice (Lee et al., 2014a; Chen et al., 2015). Consistently, higher serum metformin concentrations were obtained (Chen et al., 2015). After oral application of metformin, the plasma metformin concentration profiles were similar in OCT1-KO and WT mice (Chen et al., 2015). This may be explained by compensating effects of a decreased small intestinal metformin absorption and a decreased body distribution volume (Chen et al., 2015). Noteworthily, the effect of orally applied metformin to decrease the plasma glucose peak during the OGTT observed in WT mice was blunted in OCT3-KO mice (Chen et al., 2015). The data indicate a pivotal role of OCT3 for metformin uptake into target tissues, such as adipose tissue or skeletal muscle, and suggest involvement of OCT3 in small intestinal absorption.
After oral application of a high dose of metformin, the maximal plasma concentration of metformin was lower in OCTN1-KO mice than in WT mice (Nakamichi et al., 2013). This suggests that mOCTN1 participates in small intestinal absorption of metformin. However, the role of mOCTN1 in pharmacokinetics of metformin is more complex because an opposite effect of mOCTN1 removal on plasma metformin was observed after oral application of a low dose of metformin.
Experiments with MATE1-KO mice showed that secretion of metformin in renal proximal tubules contributes significantly to urinary metformin excretion. They provide evidence that MATE1 is pivotal for metformin transport across the BBM of renal proximal tubules and plays an important role for transport of metformin across the biliary membrane of hepatocytes. After an oral application of metformin, the area below the blood concentration–time curve in MATE1-KO mice was larger than in WT mice, whereas the renal excretion of metformin was decreased (Tsuda et al., 2009a; Toyama et al., 2010). In addition, the concentration of metformin in the liver was markedly higher in the MATE1-KO than in WT mice (Toyama et al., 2012). During treatment with metformin, an impaired renal excretion and increased hepatic concentration of metformin may promote lactic acidosis. After applying metformin for 7 days with the drinking water, the plasma concentration of lactate was higher and the pH in the plasma was lower in MATE1-KO than in WT mice (Toyama et al., 2012).
E. Studies in Knockout Mice on the Impact of Organic Cation Transporters on Nephrotoxicity of Cisplatin, Ethidium, and Paraquat
Nephrotoxicity limits the use of cisplatin in cancer therapy (Pabla and Dong, 2008). Studies with KO mice indicated that mOCT1 and mOCT2 in the basolateral membrane and mMATE1 in the BBM of renal proximal tubules are critically involved in cisplatin secretion and have impact on severity of cisplatin-induced nephrotoxicity. The amount of cisplatin in urine collected during 24 hours after intraperitoneal injection of cisplatin was 50% lower in OCT1/OCT2 double-KO mice than in WT mice (Filipski et al., 2009). Renal dysfunction, as indicated by increased blood urea nitrogen and increased urine glucose that was observed in WT mice, did not occur in the OCT1/OCT2-KO mice (Filipski et al., 2009; Ciarimboli et al., 2010). In MATE1-KO mice, cisplatin induced a more severe renal failure combined with a shortened time of animal survival than in WT mice (Nakamura et al., 2010b). One hour after intraperitoneal injection of cisplatin, higher cisplatin concentrations were measured in blood and kidney and more pronounced increases of blood urea nitrogen and Scr were observed 3 days after cisplatin administration (Nakamura et al., 2010b).
OCT1/OCT2-KO mice were also used to evaluate the impact of OCT1 and/or OCT2 on the nephrotoxicity of ethidium. After arterial infusion with ethidium bromide, in cortical renal tubules of WT mice, distinctly higher concentrations of ethidium were observed than in OCT1/OCT2-KO mice (Lee et al., 2009). The data suggest that mOCT1 and/or mOCT2 are critically involved in uptake of ethidium into renal proximal tubules and modulate nephrotoxicity of ethidium.
Paraquat-induced nephrotoxicity in WT and MATE1-KO mice was compared (Li et al., 2011). After intravenous injection of paraquat, a 57% higher maximal plasma concentration of paraquat was observed in MATE1-KO mice than in WT mice. Ninety minutes after paraquat application, a 2-fold higher paraquat concentration was measured in kidneys of MATE-KO than in WT mice. Three days after the application of paraquat, in MATE1-KO mice a higher degree of nephrotoxicity was diagnosed, as evaluated by histology and expression of indicator proteins for acute renal injury. The data indicate that MATE1 is involved in renal paraquat excretion and that decreased expression, dysfunction, or inhibition of MATE1 may exacerbate paraquat-induced nephrotoxicity.
F. Cerebral Functions of Organic Cation Transporter 2 and Organic Cation Transporter 3 in Rodents
Our knowledge concerning functions of OCT2 and OCT3 in brain is almost entirely based on studies with rodents. To date, detailed information about cerebral distributions of OCT2 and OCT3 is only available for rodents. The impact of removal of OCT2 and OCT3 on behavioral and psychologic traits has been investigated in rats and mice. DA, SE, NE, epinephrine, and histidine are transported by rOCT2 and hOCT2; however, different Km values have been reported for SE and epinephrine (Amphoux et al., 2006). NE, epinephrine, and histamine are transported by hOCT3 and rOCT3. In this case, different apparent Km values were determined for epinephrine and histamine. Of note, DA and SE are transported by rOCT3, but not by hOCT3. Immunostaining and in situ hybridization in mice and/or rats indicated overlapping, but partially different cerebral distributions of OCT2 and OCT3. Whereas OCT2 seems to be exclusively expressed in neurons (Bacq et al., 2012; Couroussé et al., 2015), OCT3 is expressed in neurons, glial cells, and ependymal cells (Wu et al., 1998a; Haag et al., 2004; Gasser et al., 2006, 2017; Nakayama et al., 2007; Vialou et al., 2008; Cui et al., 2009; Mayer et al., 2018). Different from sodium-dependent, high-affinity monoamine reuptake transporters that are enriched in nerve terminals, OCT2 and OCT3 are mainly located in neuronal cell membranes and dendrites, indicating an extrasynaptic location (Bacq et al., 2012; Gasser et al., 2017). Both OCT2 and OCT3 are expressed in cerebral cortex, cerebellum, hippocampus, thalamus, hypothalamus, amygdala, and hindbrain (Vialou et al., 2004, 2008; Bacq et al., 2012; Couroussé et al., 2015). However, different from OCT2, OCT3 is also expressed in circumventricular organs, in the substantia nigra, and in the choroid plexus (Haag et al., 2004; Vialou et al., 2004; Nakayama et al., 2007; Gasser et al., 2009). Detection of amine-neurotransmitter transport by OCT2 and OCT3 and cerebral expression suggested modulatory roles during aminergic neurotransmission (Busch et al., 1998; Schmitt et al., 2003). This idea was supported by measurements in which effects of OCT inhibitors on cerebral clearance of SE or histamine were investigated (Daws et al., 2005; Gasser et al., 2006; Baganz et al., 2008). For example, it was observed that decynium22 decelerated the clearance of SE in the hippocampus of mice in which the sodium-dependent SERT had been removed (Baganz et al., 2008). Integrated behaviors and personality traits, including motor activity, mood, motivation, anxiety, depression, and aggression, are modulated by aminergic neurotransmitters and can be influenced by inhibitors of high-affinity reuptake systems (Charney, 1998; Torres et al., 2003). For these reasons, effects of OCT2 or OCT3 removal on anxiety-related behavior, behavior-despair paradigms of depression-like behavior patterns, and stress response were investigated. Because OCT3 is expressed in the area postrema (AP) and the subfornical organ (SFO) that are involved in the control of osmotic homeostasis, the effect of OCT3 removal on intake of salt and water also was tested.
After removal of OCT2 in mice, sodium-independent, decynium22-blockable uptake of NE and SE into suspended brain cells was decreased (Bacq et al., 2012). Accordingly, the in vivo clearance of iontophoretically applied NE or SE measured in presence of venlafaxine, a selective blocker of NET and SET, was slowed down (David et al., 2003; Bacq et al., 2012). Several behavioral, mood-related tests were performed trying to evaluate the impact of OCT2 on anxiety and depression. After removal of OCT2, several indicators for anxiety were decreased. For example, in the open-field test, OCT2-KO mice remained for longer time periods in the center of the open field and showed more rearing activity than WT mice. Similarly, in the elevated O-maze test, OCT2-KO mice spent longer time periods in the elevated open parts of the experimental device (Bacq et al., 2012). Evaluating more complex behavioral traits related to depression in humans, removal of OCT2 revealed different effects than antidepressive inhibitors of SERT and NET. For evaluation of depressive-like behavior, a tail-suspension test and a forced-swim test (FST) were applied. In both tests, time periods of immobility after exposition of the animals to water (exposure to inescapable stress) that are supposed to correlate with depression-like behavior (Porsolt et al., 2001) were measured. Whereas the times of immobility were decreased by the SERT-inhibitor venlaflexin, indicating a diminished level of resignation, they were increased after removal of OCT2 (Bacq et al., 2012). Applying a chronic corticosterone-induced depression model in WT and OCT2-KO mice, long-term treatment with venlaflexin decreased the corticosterone-induced depressive-like traits evaluated in various tests in WT mice, but not in the OCT2-KO mice (Bacq et al., 2012). The data indicate that OCT2 modulates short-term and long-term effects of antidepressant inhibitors of amine neurotransmitter uptake by SERT.
Detailed immunohistochemical investigations revealed that OCT2 is expressed in nuclei of stess-related neuronal circuits that trigger the activation of the hypothalamic-pituitary-adrenocortical axis, culminating in corticosterone secretion (Herman et al., 2003; Kvetnansky et al., 2009). In OCT2-KO mice, basal corticosterone secretion and enhanced corticosteone secretion in response to acute stress during FST were more distinctly increased than in WT mice (Couroussé et al., 2015). Upon exposure to unpredictable chronic mild stress, OCT2-KO mice showed an increased vulnerability to changes that reflect depression-related symptoms such as dimished self-grooming and accelerated development of special memory deficits. Because removal of OCT2 did not change the affinity of adrenocorticotrophic hormone for stimulation of adrenal corticosterone secretion, the observed OCT2-related effects are supposed to be due to effects on central neuronal circuits. In hippocampus, Ser9 phosphorylation of glycogen synthase kinase-3β under basal conditions and after acute stress was different between OCT2-KO versus WT mice (Couroussé et al., 2015). Ser9 phosphorylation of glycogen synthase kinase-3β has been shown to be involved in mood disorders (Beaulieu et al., 2008) and to be decreased by SE-dependent activation (Li et al., 2004). Hence, the data suggest that OCT2 influences SE concentrations within stress-related neuronal circuits, leading to an increased vulnerability during chronic stress.
The effects of OCT3 removal on brain depression-related functions were investigated by two groups employing different lines of OCT3-KO mice (Vialou et al., 2008; Wultsch et al., 2009). Vialou et al. (2008) used a mutant mouse line that has been functionally characterized (Zwart et al., 2001b). After intravenous injection of MPP, largely decreased MPP concentrations were measured in heart and salivary glands, that is, in tissues with high expression of OCT3 (Zwart et al., 2001b; Lee et al., 2014a). Vialou et al. (2008) observed that the DA concentration in several brain regions, for example, in the substantia nigra and the tegmental area, was decreased upon OCT3 removal (Vialou et al., 2008). Performing behavioral tests, they observed similar basal locomotor activity in the OCT3-KO and WT mice. In OCT3-KO mice they observed higher paradigms for anxiety in the open-field and Y-maze tests than in WT mice. After application of relatively low doses of D-amphetamine or cocaine, the locomotor activity was increased about 3-fold in both WT and OCT3-KO mice. However, high doses of both stimulants increased locomotor activity in OCT3-KO mice, but not in WT mice. Using a homemade, sparsely characterized OCT3-KO mouse line, Wultsch et al. (2009) evaluated the effects of OCT3 removal on locomotor activity, spatial orientation, and anxiety. They detected no effects on locomotor activity and spatial orientation similar to Vialou et al. (2008) but observed increased paradigms for anxiety in the open-field and elevated plus-maze test. Taken together the data suggest that OCT3 has an impact on depression-related behavior in mice and on addiction to amphetamine that may be influenced by additional genetic factors.
Decreasing the cerebral expression of OCT3 in mice by infusion of antisense oligonucleotide into the third brain ventricle, the time of immobility in the FST that represents a paradigm for depression-related behavior was largely decreased (Kitaichi et al., 2005). This suggests an antidepressive effect of OCT3 removal. An impact of OCT3 on the stimulatory effect of methamphetamine (METH) was indicated by the observation that the stimulation of locomotor activity by METH was considerably higher when the expression of OCT3 was reduced (Kitaichi et al., 2005). This effect of ventricle-injected OCT3-antisense oligonucleotides on METH-stimulated locomotor activity was confirmed in rats (Nakayama et al., 2007). In rats, the authors additionally determined the effect of s.c. injected METH on extracellular cerebral DA concentrations. After METH application, extracelluar DA in the prefrontal cortex and the nucleus accumbens was increased. This increase was significantly enhanced when the expression of OCT3 was decreased by intraventricular injection of antisense oligonucleotides. Because mOCT3 does not transport amphetamine like hOCT3 (Wagner et al., 2017, 2018), the increased cerebral concentration of METH in OCT3-KO mice is probably due to an effect of OCT3 removal on function or expression of an unknown transporter that accepts METH as substrate.
Recently, data have been reported that suggest that OCT3 may be involved in cellular DA release from stimulated dopaminergic neurons (Mayer et al., 2018). Comparing effects of amphetamine on neuronal activity in WT and OCT3-KO mice, the authors observed that amphetamine-induced hyperactivity was dependent on the presence of OCT3. They showed that in WT mice the extracellular DA concentration close to dopaminergic neurons increased after stimulation with amphetamine. In WT mice the amphetamine-induced increase of DA was partially blocked by inhibitors of DAT and by the OCT-inhibitor decynium22; however, the decynium22-induced inhibition was absent in OCT3-KO mice. Trying to test the hypothesis that OCT3 mediates DA release from amphetamine-stimulated neurons, they performed efflux studies with MPP in rat superior cervical ganglion cells that express OCT3, but neither OCT1 nor OCT2 (Kristufek et al., 2002; Mayer et al., 2018). Amphetamine-stimulated MPP efflux from MPP-preloaded superior cervical ganglion cells was completely blocked by decynium22. The authors raised the hypothesis that amphetamine enters dopaminergic neurons via a nonidentified transporter or by passive diffusion and mediates the release of DA from intracellular vesicles by disrupting the vesicular monoamine transporter 2 (Sulzer et al., 2005), and that the increased intracellular DA concentration provides the driving force for OCT3-mediated DA efflux. An alternative explanation for the impact of OCT3 on amphetamine-stimulated DA-mediated neurotransmission is that OCT3 is critically involved in reuptake of extracellular DA into neurons and/or glia cells.
Because it was observed that OCT3 is expressed in neurons of the SFO and the AP that are involved in sensing of osmolarity changes and regulation of salt and water intake, the effect of OCT3 removal on salt intake was investigated (Vialou et al., 2004). After dehydration that was induced by withdrawal of water and injection of the sodium-wasting diuretic furosemide, the spontaneous ingestion of hypertonic saline was 40% higher in OCT3-KO mice than in WT mice. To elucidate the impact of OCT3 removal on neuronal activity, the effect on salt and water deprivation on the expression of c-Fos was investigated. Neuronal expression of c-Fos has been shown to indicate central responses to excitatory stimuli, including hyperosmolarity and hypovolemia (Lane et al., 1997; Thunhorst et al., 1998). Under basal conditions, a similar expression of OCT3 was observed in SFO neurons of WT and OCT3-KO mice. Of note, after dehydration, the neuronal cFos expression in the SFO was inceased more than 10-fold in WT mice and less than 5-fold in OCT3-KO mice (Vialou et al., 2004). The data suggest that OCT3-mediated neurotransmitter transport influences the regulation of salt intake. The impact of OCT3 on salt intake regulation is probably not exclusively due to effects on neuronal activity in the SFO and PA because OCT3 is also expressed in additional structures such as hypothalamic paraventricular nuclei, supraoptical nuclei, and the solitary tract nucleus, which are supposed to be involved in sensing of blood osmolarity changes and in regulation of salt intake (Ferguson and Bains, 1996; Bourque and Oliet, 1997).
XIII. In Vitro Drug Testing
Preclinical testing of new molecular entities (NMEs) for interaction with hOCTs is required to anticipate potential adverse drug effects (ADEs) in patients and to design suitable clinical studies. Adverse effects of drugs interacting with hOCTs may be caused by toxicity in cells or organs in which drugs are enriched in response to OCT-mediated cellular uptake or to inhibition of OCT-mediated cellular export. OCT-related ADEs may also be caused by drug interaction with pivotal endogeneous functions of OCTs, such as hOCT1-mediated thiamine uptake into hepatocytes or fat cells, cellular uptake and/or efflux of neurotransmitters by hOCT2 and hOCT3, and OCTN2-mediated cellular uptake of carnitine. In addition, NMEs interacting with OCTs may alter the pharmacokinetics of coapplied drugs and change their pharmacodynamics and/or toxicity.
The following procedures are suggested as paradigmatic examples for identification of NMEs that interact with any hOCT under biomedically and/or physiologically relevant conditions. These suggestions are based on current knowledge on transporters and do not consider compromises due to commercial needs and/or political framework. Test conditions for interaction of NMEs with all hOCTs, hMATE1 and hMATE-2K, rather than exclusively with hOCT1 and hOCT2 as recommended by the FDA and EMA, are described in this work. In silico prediction for interaction of NMEs with hOCT1, hOCT2, and hMATE1 by pharmacophore modeling (Ahlin et al., 2008; Wittwer et al., 2013; Xu et al., 2013; Chen et al., 2017a; Sandoval et al., 2018) cannot be used to exclude NMEs from in vitro testing because interaction with OCTs was predicted for less than 85% of the drugs that were identified by in vitro assays (Koepsell, 2019). In vitro testing is recommended for all positively charged and uncharged NMEs regardless of their molecular weight.
It is recommended to employ inhibition assays using very low substrate concentrations for the identification of NMEs that interact with OCTs because this allows detection of inhibitory interactions at high- and low-affinity binding sites (see In-Depth Functional Characterization of Organic Cation Transporter 1 and Organic Cation Transporter 2, last paragraph). Allosteric, high-affinity inhibition of transport can only be observed at low substrate concentrations when only one low-affinity binding site is involved in translocation (see Fig. 4B). The inhibition assays should be performed at nanomolar test substrate concentrations. This allows the unequivocal detection of transporter-mediated uptake even in the presence of high passive membrane permeation. Hence, the uptake measurements should be performed with radioactively labeled substrates. Because the apparent Km values determined for MPP uptake by hOCT1, hOCT2, hOCT3, hMATE1, and hMATE-K2 are relatively low (between 3 and 111 µM; see Table 1), it is recommended to use radioactively labeled MPP at two concentrations (1 and 10 nM) for initial screening of hOCT1–3, hMATE1, and hMATE-K2. To elucidate whether NMEs can cause high-affinity inhibition by interaction with allosteric binding sites, it is proposed to start with NME concentrations of 1 pM, 1 µM, and 5 mM. Initial screening of NMEs for interaction with hOCTN1 and hOCTN2 should be performed with radioactively labeled ergothioneine and L-carnitine, respectively, using concentrations of 1 and 10 nM, and NME concentrations of 1 pM, 1 µM, and 5 mM. Because IC50 values of OCTs are dependent on the molecular structure of the test substrate (Belzer et al., 2013; Thévenod et al., 2013; Yin et al., 2016), it is recommended to repeat in vitro inhibition testing for NMEs, which do not show up as inhibitors in the primary assay. To evaluate the interaction of NMEs with hOCT1–3, hMATE1, and hMATE2-K in the follow-up assay, it is proposed to use radioactively labeled trospium as test substrate (apparent Km values between 4.4 and 106 µM; see Table 4) (Bexten et al., 2015). Like with MPP, trospium concentrations of 1 and 10 nM and NME concentrations of 1 pM, 1 µM, and 5 mM should be used. In a follow-up assay, the interaction of NMEs with hOCTN1 and hOCTN2 may be evaluated by measuring the inhibition of uptake of 1 and 10 nM radioactively labeled sulpiride (apparent Km values of 235 and 250 µM; Table 4) (dos Santos Pereira et al., 2014).
It is recommended to test those NMEs that inhibit OCTs also for transport because OCT-mediated transport may impact pharmacokinetics, pharmacodynamics, and/or toxicity of the NMEs. Designing transport measurements, it must be considered that the ratio between transporter-mediated uptake and passive membrane permeation generally decreases with increasing drug concentrations. Hence, transport may be overlooked if too high concentrations of NMEs are used. Because it is difficult to anticipate the concentration of the respective NME in different body compartments, transport should be tested with NME concentrations in the submicromolar range. If transported NMEs will be pursued for drug development, the apparent Km value(s) for the involved OCT(s) must be determinend. It is also recommended to characterize the effects of frequent polymorphisms in the involved OCTs if they have been shown to exhibit substrate-specific effects on transport (Table 8). For example, effects of mutations Ser14Phe, Arg61Cys, Gly401Ser, and Met420del in hOCT1 and of mutation Ala270Ser in hOCT2 on Km and Vmax values should be determined.
During the first phase of clinical studies of novel drugs interacting with OCTs, in vitro testing is recommended to anticipate potential effects on endogenous functions of the involved OCTs and effects on pharmacokinetics and/or toxicity of coadministered drugs. For in vitro testing at this stage of drug development, unbound blood concentrations of the novel drugs need to be determined in clinical studies so that expected minimal, average, and peak free plasma drug concentrations can be estimated. Using these drug concentrations, the effects of novel drugs on transport of physiologic important endogeneous substrates by the respective OCTs should be tested. Effects on estimated minimal, average, and maximal blood and/or tissue concentrations of the endogenous substrates should be analyzed. For example, if a novel drug interacts with hOCT1, it should also be tested to determine whether it inhibits hOCT1-mediated uptake of thiamine or, if a novel drug interacts with hOCT3, it is recommended to determine the drug effect on hOCT3-mediated uptake of DA, SE, epinepherine, NE, and histamine. In vitro tests are also important to anticipate potential effects of novel drugs on pharmacokinetics, pharmacodynamics, and/or toxicity on coadministered drugs. Hence, novel drugs interacting with OCTs should be tested for inhibition with coadministered drugs that are transported by the respective OCTs. Testing for interactions with uptake of metformin and cisplatin should be obligatory. If a novel drug interacts with hOCT1, hOCT2, hOCT3, MATE1, and/or MATE2-K, it is recommended to test whether it inhibits uptake of 1, 5, and 15 µM metformin. The metformin concentrations represent the trough plasma membrane concentration, the intermediate concentration, and maximal plasma metformin concentration, repectively (Shu et al., 2008; Tzvetkov et al., 2009; Christensen et al., 2011). If a novel drug interacts with hOCT2, hMATE1, and/or MATE-K2, inhibition of cisplatin transport mediated by the respective OCT(s) at clinically relevant concentrations should be tested. Ínhibition of hOCT2-mediated cisplatin uptake suggests retarded renal cisplatin excretion associated with reduced nephrotoxicity, whereas inhibition of cisplatin uptake by MATE1 and/or MATE2-K indicates a risk for aggravation of cisplatin-induced nephrotoxicity. The information obtained from in vitro testing concerning the inhibitory potential of novel drugs on OCT-mediated uptake of endogenous substrates and coadministered drugs provides a basis to decide which additional clinical studies are required to exclude ADEs related to drug interactions at organic cation transporters.
XIV. Concluding Remarks
Twenty-five years of intensive investigation on OCTs after cloning of the first member of the SLC22 family have established multiple pivotal roles of OCTs in physiology and pharmacology. The large variety of functions of OCTs is due to their capability for polyspecific recognition and translocation of cationic and/or zwitterionic substrates. The elucidation of functional traits after overexpression, purification, and reconstitution of OCTs as well as the development of experimentally based hypotheses on the molecular basics for substrate recognition and translocation provided a rough idea about the complexity of ligand interactions at OCTs. Realizing the broad impact of OCTs on pharmacokinetics, pharmacodynamics, and toxicity of drugs, the interaction of many drugs with individual OCTs has been investigated, and in vitro testing of NMEs for interaction with OCTs has become standard during drug development. Unfortunately, the routinely employed procedures, including those that have been proposed by the International Transporter Consortium, FDA, and EMA, only provide an incomplete picture because they do not detect any possible interactions of drugs with OCTs. Extension and refinement of in vitro testing procedures as proposed in this review can avoid the shortcomings. The single-nucleotide variations in hOCTs have been identified, and their frequencies in various ethnic groups were determined. In addition, effects of mutations on transport of some endogenous substrates and some drugs and effects on treatments with a few drugs have been investigated. The current knowledge of the impact of mutations on drug treatment and on physiologic functions is very fragmentary. Studies that were performed in KO mice revealed important hints on endogeneous physiologic functions of OCTs in humans such as on the impact of OCT2 and OCT3 for behavioral traits. To enlighten the endogeneous physiologic functions of OCTs in humans, intensive future investigations are required in which, for example, physiologic effects of loss-of-function mutants on distributions and metabolic effects of endogeneous substrates are investigated or the distribution of 11C- or 18F-labeled drugs is determined by PET. In summary, previous research indicates the enormous potential of OCT-related pharmacological characterizations to improve drug treatments of patients, including the development of personalized therapies. Intensive future research in the field is required to use this high potential for improvement of medical treatments.
Authorship Contributions
Participated in research design: Koepsell.
Conducted experiments: Koepsell.
Contributed new reagents or analytic tools: Koepsell.
Performed data analysis: Koepsell.
Wrote or contributed to the writing of the manuscript: Koepsell.
Footnotes
Abbreviations
- 3D
- three-dimensional
- ADE
- adverse drug effect
- AMPK
- AMP-stimulated protein kinase
- AP
- area postrema
- AP-1
- activating protein-1
- Ap2-rep
- activating protein-2 repressor
- ASP
- 4-(4-(dimethylamino)styryl)-N-methylpyridinium
- BBB
- blood brain barrier
- BBM
- brush–border membrane
- CaM
- calmodulin
- CD
- Crohn’s disease
- CGI
- CpG islands
- CHT
- choline transporter
- CKD
- chronic kidney disease
- CML
- chronic myeloic leukemia
- CNT
- concentrative nucleoside transporter
- CTL
- choline-like transporter
- DA
- dopamine
- DAT
- DA transporter
- EMA
- European Medicines Agency
- FDA
- Food and Drug Administration
- FST
- forced-swim test
- GFP
- green fluorescent protein
- GFR
- glomerular filtration rate
- GWAS
- genome-wide association studies
- Hb1Ac
- hemoglobin A1c
- HEK
- human embryonic kidney
- hMATE
- human MATE
- hMATE-K
- human MATE-K
- hMDR1
- human multidrug resistance protein 1
- HNF
- hepatic nuclear factor
- hOCT
- human OCT
- hTHTR
- human THTR
- IBD
- inflammatory bowel disease
- IRIP
- ischemia/reperfusion-inducible protein
- KD
- dissociation constant
- Km
- Michaelis Menten constant
- KO
- knockout
- LAPTM4A
- lysosmal-associated protein 4α
- LDL
- low-density lipoprotein
- maleimide-PEO2-biotin
- (+)-biotinyl-3-maleimidopropionamidyl-3,6-dioxaoctanediamine
- MAF
- major allele frequency
- MATE
- multidrug and toxin exclusion
- MATE-K
- MATE kidney-specific
- METH
- methamphetamine
- MFS
- major facilitator superfamily
- MLL1
- mixed-lineage-leucemia 1
- mOCT
- mouse OCT
- mOCTN
- mouse OCTN
- MPP
- 1-methyl-4-phenylpyridinium
- MTSET
- 2-(trimethylammonium)ethyl methanethiosulfonate
- MZ1
- myeloid zinc finger 1
- NE
- norepinephrine
- NET
- NE transporter
- NME
- new molecular entity
- OAT
- organic anion transporter
- OCD
- obsessive-compulsive disorder
- OCT
- organic cation transporter
- OCTN
- novel OCT
- OGTT
- oral glucose tolerance test
- PET
- positron emission tomography
- PfMATE
- MATE from Pyrococcus furiosus
- PI3K
- phosphatidylinositol-3-kinase
- PKA
- protein kinase A
- PKC
- protein kinase C
- PKG
- protein kinase G
- PMAT
- monoamine transporter
- PPAR
- peroxisome proliferator-activated receptor
- RA
- rheumatoid arthritis
- rOCT
- rat OCT
- RUNX1
- runt-related transcription factor 1
- SCD
- primary systemic carnitine deficiency
- Scr
- serum creatinine
- SE
- serotonin
- SERT
- SE transporter
- SFO
- subfornical organ
- SGLT
- sodium-D-glucose cotransporter
- SNV
- single-nucleotide variant
- Sp1
- specifity protein 1
- T1D
- type 1 diabetes
- T2D
- type 2 diabetes
- TBuA
- tetrabutylammonium
- TEA
- tetraethylammonium
- THTR
- thiamine transporter
- TMAO
- trimethylamine N-oxide
- TMH
- transmembrane helix
- TMRM
- tetramethylrhodamine-6-maleimide
- TPeA
- tetrapentylammonium
- UC
- ulcerative colitis
- USF
- upstream binding stimulating factor
- WAT
- white adipose tissue
- WT
- wild-type
- Copyright © 2019 by The American Society for Pharmacology and Experimental Therapeutics
References
- ↵
- ↵
- ↵
- ↵
- ↵
- ↵
- ↵
- ↵
- ↵
- ↵
- ↵
- ↵
- ↵
- ↵
- ↵
- ↵
- ↵
- ↵
- ↵
- ↵
- ↵
- ↵
- ↵
- ↵
- ↵
- ↵
- ↵
- ↵
- ↵
- ↵
- ↵
- ↵
- ↵
- ↵
- ↵
- ↵
- ↵
- ↵
- ↵
- ↵
- ↵
- ↵
- ↵
- ↵
- ↵
- ↵
- ↵
- ↵
- ↵
- ↵
- ↵
- ↵
- ↵
- ↵
- ↵
- ↵
- ↵
- ↵
- ↵
- ↵
- ↵
- ↵
- ↵
- ↵
- ↵
- ↵
- ↵
- ↵
- ↵
- ↵
- ↵
- ↵
- ↵
- ↵
- ↵
- ↵
- ↵
- ↵
- ↵
- ↵
- ↵
- ↵
- ↵
- ↵
- ↵
- ↵
- ↵
- ↵
- ↵
- ↵
- ↵
- ↵
- ↵
- ↵
- ↵
- ↵
- ↵
- ↵
- ↵
- ↵
- ↵
- ↵
- ↵
- ↵
- ↵
- ↵
- ↵
- ↵
- ↵
- ↵
- ↵
- ↵
- ↵
- ↵
- ↵
- ↵
- ↵
- ↵
- ↵
- ↵
- ↵
- ↵
- ↵
- ↵
- ↵
- ↵
- ↵
- ↵
- ↵
- ↵
- ↵
- ↵
- ↵
- ↵
- ↵
- ↵
- ↵
- ↵
- ↵
- ↵
- ↵
- ↵
- ↵
- ↵
- ↵
- ↵
- ↵
- ↵
- ↵
- ↵
- ↵
- ↵
- ↵
- ↵
- ↵
- ↵
- ↵
- ↵
- ↵
- ↵
- ↵
- ↵
- ↵
- ↵
- ↵
- ↵
- ↵
- ↵
- ↵
- ↵
- ↵
- ↵
- ↵
- ↵
- ↵
- ↵
- ↵
- ↵
- ↵
- ↵
- ↵
- ↵
- ↵
- ↵
- ↵
- ↵
- ↵
- ↵
- ↵
- ↵
- ↵
- ↵
- ↵
- ↵
- ↵
- ↵
- ↵
- ↵
- ↵
- ↵
- ↵
- ↵
- ↵
- ↵
- ↵
- ↵
- ↵
- ↵
- ↵
- ↵
- ↵
- ↵
- ↵
- ↵
- ↵
- ↵
- ↵
- ↵
- ↵
- ↵
- ↵
- ↵
- ↵
- ↵
- ↵
- ↵
- ↵
- ↵
- ↵
- ↵
- ↵
- ↵
- ↵
- ↵
- ↵
- ↵
- ↵
- ↵
- ↵
- ↵
- ↵
- ↵
- ↵
- ↵
- ↵
- ↵
- ↵
- ↵
- ↵
- ↵
- ↵
- ↵
- ↵
- ↵
- ↵
- ↵
- ↵
- ↵
- ↵
- ↵
- ↵
- ↵
- ↵
- ↵
- ↵
- ↵
- ↵
- ↵
- ↵
- ↵
- ↵
- ↵
- ↵
- ↵
- ↵
- ↵
- ↵
- ↵
- ↵
- ↵
- ↵
- ↵
- ↵
- ↵
- ↵
- ↵
- ↵
- ↵
- ↵
- ↵
- ↵
- ↵
- ↵
- ↵
- ↵
- ↵
- ↵
- ↵
- ↵
- ↵
- ↵
- ↵
- ↵
- ↵
- ↵
- ↵
- ↵
- ↵
- ↵
- ↵
- ↵
- ↵
- ↵
- ↵
- ↵
- ↵
- ↵
- ↵
- ↵
- ↵
- ↵
- ↵
- ↵
- ↵
- ↵
- ↵
- ↵
- ↵
- ↵
- ↵
- ↵
- ↵
- ↵
- ↵
- ↵
- ↵
- ↵
- ↵
- ↵
- ↵
- ↵
- ↵
- ↵
- ↵
- ↵
- ↵
- ↵
- ↵
- ↵
- ↵
- ↵
- ↵
- ↵
- ↵
- ↵
- ↵
- ↵
- ↵
- ↵
- ↵
- ↵
- ↵
- ↵
- ↵
- ↵
- ↵
- ↵
- ↵
- ↵
- ↵
- ↵
- ↵
- ↵
- ↵
- ↵
- ↵
- ↵
- ↵
- ↵
- ↵
- ↵
- ↵
- ↵
- ↵
- ↵
- ↵
- ↵
- ↵
- ↵
- ↵
- ↵
- ↵
- ↵
- ↵
- ↵
- ↵
- ↵
- ↵
- ↵
- ↵
- ↵
- ↵
- ↵
- ↵
- ↵
- ↵
- ↵
- ↵
- ↵
- ↵
- ↵
- ↵
- ↵
- ↵
- ↵
- ↵
- ↵
- ↵
- ↵
- ↵
- ↵
- ↵
- ↵
- ↵
- ↵
- ↵
- ↵
- ↵
- ↵
- ↵
- ↵
- ↵
- ↵
- ↵
- ↵
- ↵
- ↵
- ↵
- ↵
- ↵
- ↵
- ↵
- ↵
- ↵
- ↵
- ↵
- ↵
- ↵
- ↵
- ↵
- ↵
- ↵
- ↵
- ↵
- ↵
- ↵
- ↵
- ↵
- ↵
- ↵
- ↵
- ↵
- ↵
- ↵
- ↵
- ↵
- ↵
- ↵
- ↵
- ↵
- ↵
- ↵
- ↵
- ↵
- ↵
- ↵
- ↵
- ↵
- ↵
- ↵
- ↵
- ↵
- ↵
- ↵
- ↵
- ↵
- ↵
- ↵
- ↵
- ↵
- ↵
- ↵
- ↵
- ↵
- ↵
- ↵
- ↵
- ↵
- ↵
- ↵
- ↵
- ↵
- ↵
- ↵
- ↵
- ↵
- ↵
- ↵
- ↵
- ↵
- ↵
- ↵
- ↵
- ↵
- ↵
- ↵
- ↵
- ↵
- ↵
- ↵
- ↵
- ↵
- ↵
- ↵
- ↵
- ↵
- ↵
- ↵
- ↵
- ↵
- ↵
- ↵
- ↵
- ↵
- ↵
- ↵
- ↵
- ↵
- ↵
- ↵
- ↵
- ↵
- ↵
- ↵
- ↵
- ↵
- ↵
- ↵
- ↵
- ↵
- ↵
- ↵
- ↵
- ↵
- ↵
- ↵
- ↵
- ↵
- ↵
- ↵
- ↵
- ↵
- ↵
- ↵
- ↵
- ↵
- ↵
- ↵
- ↵
- ↵
- ↵
- ↵
- ↵
- ↵
- ↵
- ↵
- ↵
- ↵
- ↵
- ↵
- ↵
- ↵
- ↵
- ↵
- ↵
- ↵
- ↵
- ↵
- ↵
- ↵
- ↵
- ↵
- ↵
- ↵
- ↵
- ↵
- ↵
- ↵
- ↵
- ↵
- ↵
- ↵
- ↵
- ↵
- ↵
- ↵
- ↵
- ↵
- ↵
- ↵
- ↵
- ↵
- ↵
- ↵
- ↵
- ↵
- ↵
- ↵
- ↵
- ↵
- ↵
- ↵
- ↵
- ↵
- ↵
- ↵
- ↵
- ↵
- ↵
- ↵
- ↵
- ↵
- ↵
- ↵
- ↵
- ↵
- ↵
- ↵
- ↵
- ↵
- ↵
- ↵
- ↵
- ↵
- ↵
- ↵
- ↵
- ↵
- ↵
- ↵
In this issue


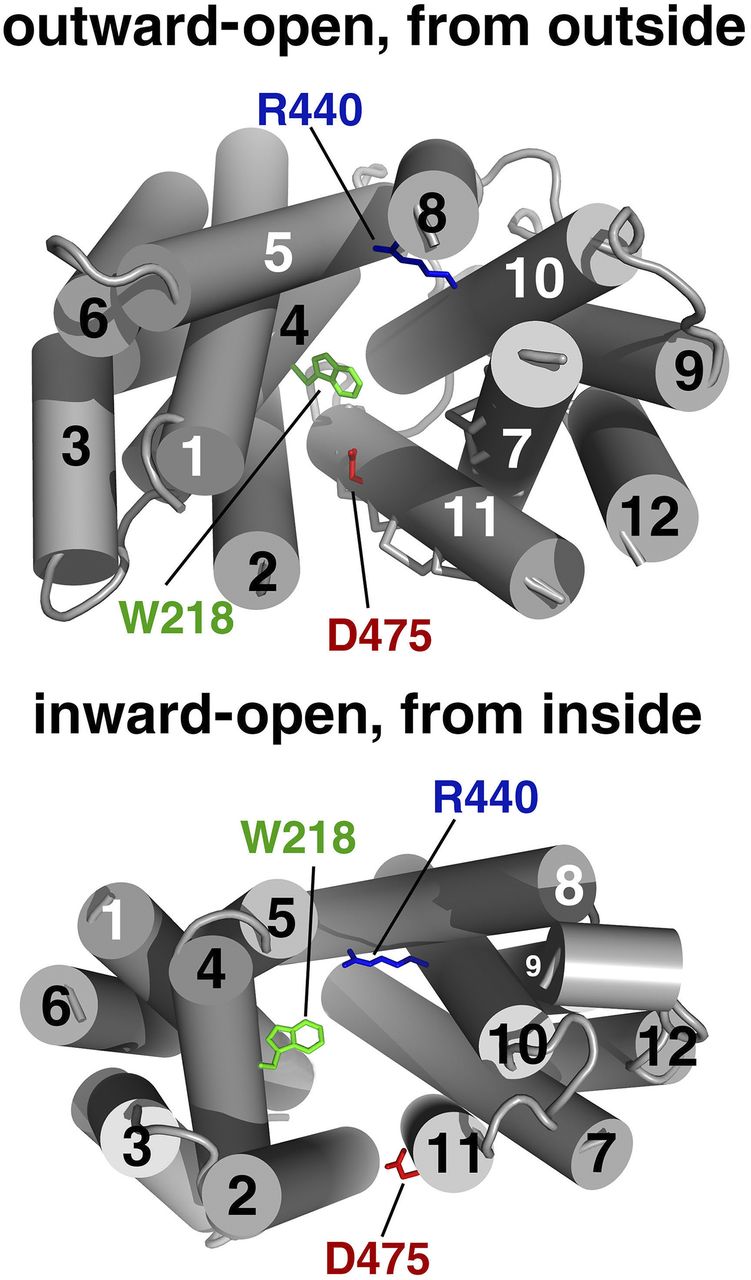
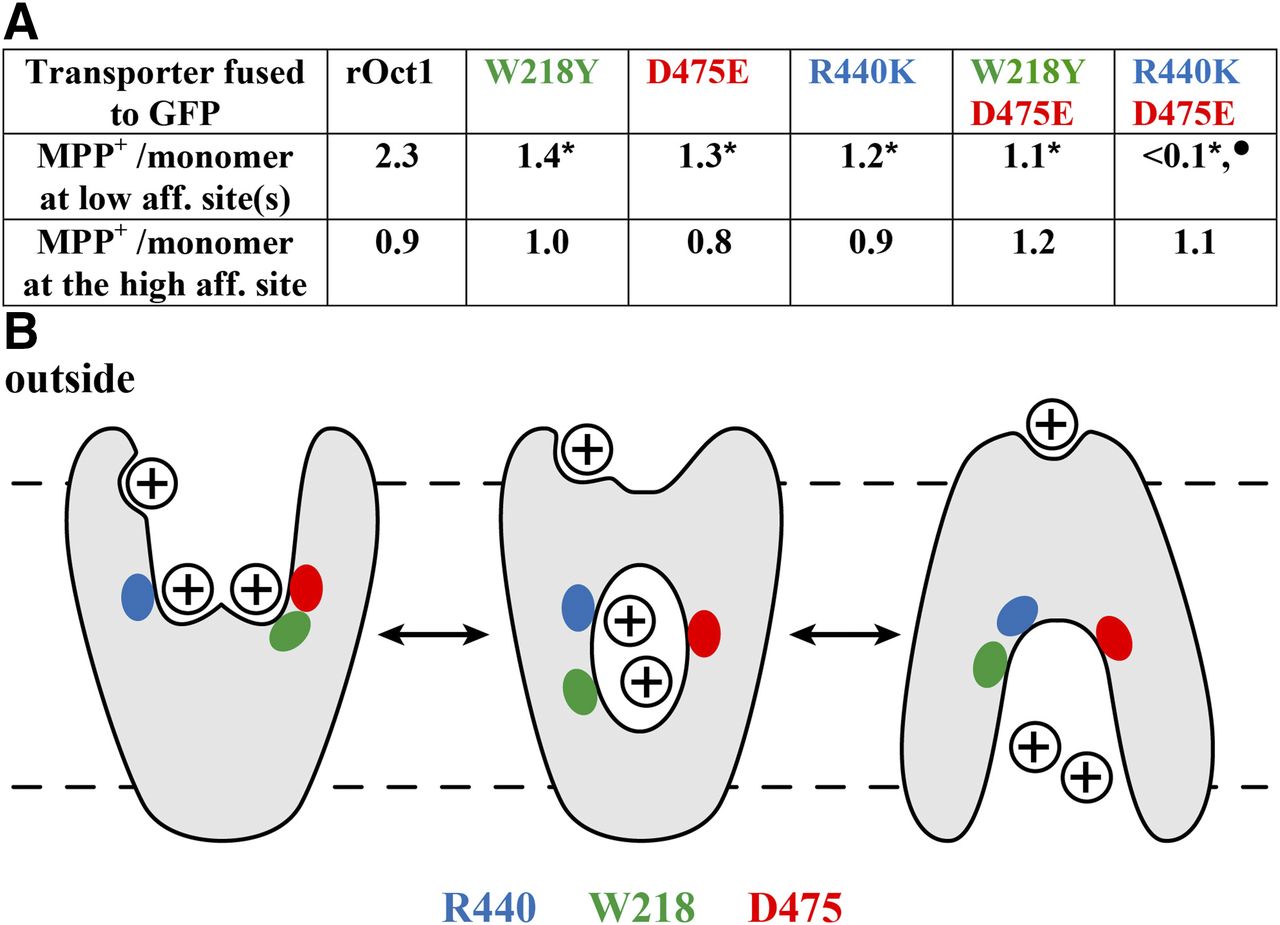
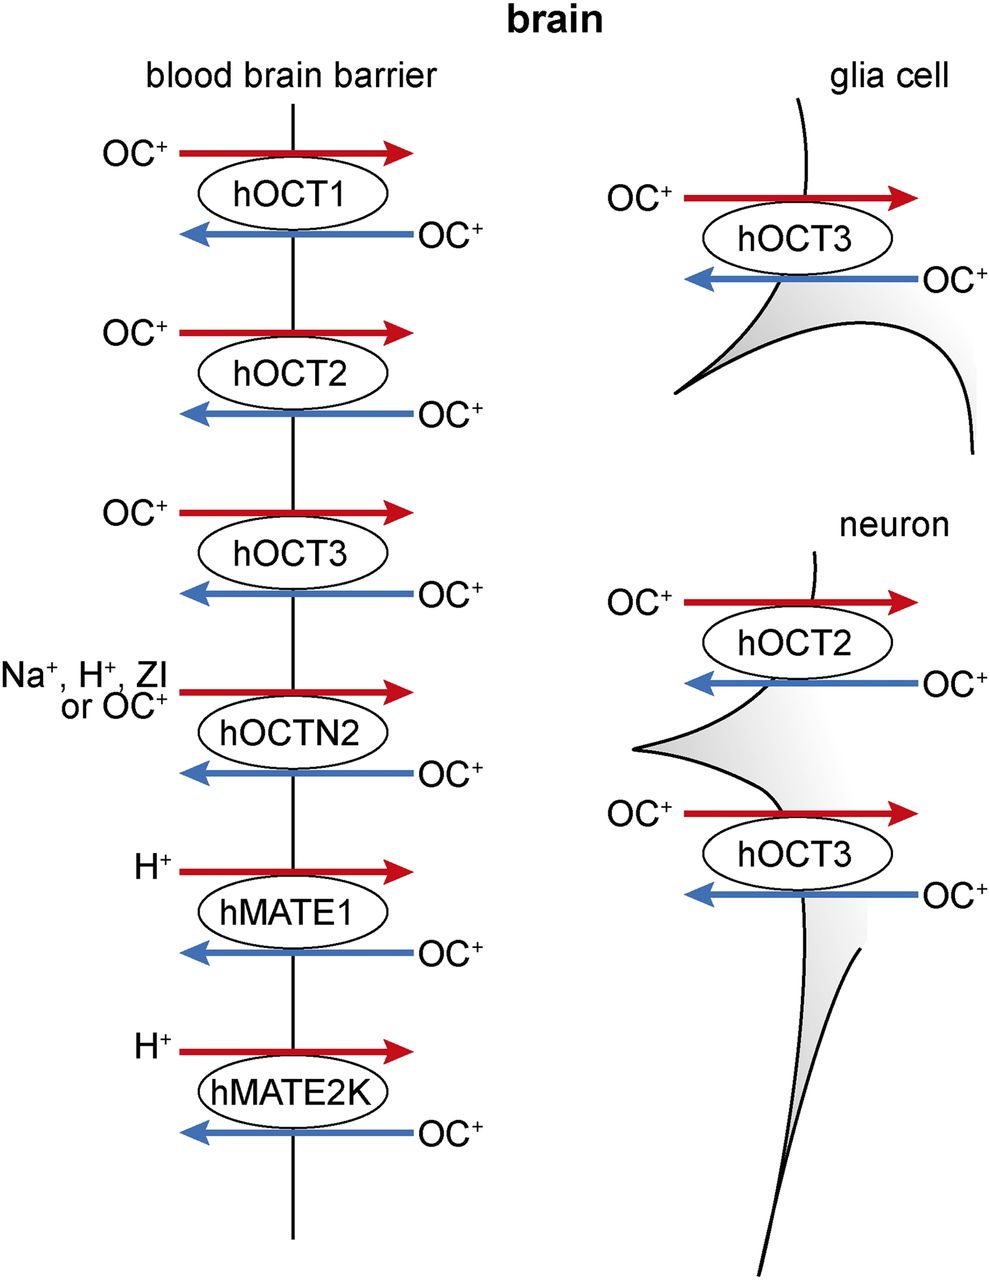
Jump to section
- Article
- Abstract
- I. Introduction
- II. Cloning, Chromosomal Location, Functional Properties, and Regulation of Human Organic Cation Transporters
- III. Structure–Function Relationships in Organic Cation Transporters
- IV. Expression and Locations of Human Organic Cation Transporters in Cells, Tissues, Organs, and Tumors
- V. Model Substrates and Endogenous Compounds That Are Transported by Human Organic Cation Transporters
- VI. Toxins That Are Transported by Human Organic Cation Transporters
- VII. Drugs That Are Substrates and/or Inhibitors of Human Organic Cation Transporters
- VIII. Genetic Variants in Human Organic Cation Transporters
- IX. Effects of Genetic Variants in Organic Cation Transporters on Drug Treatment
- X. Drug–Drug Interactions of Substrates and Inhibitors at Organic Cation Transporters
- XI. Diseases That Are Associated with Genetic Variants in Organic Cation Transporters
- XII. Insights in Potential Physiologic and Biomedical Functions of Human Organic Cation Transporters from Animal Experiments
- XIII. In Vitro Drug Testing
- XIV. Concluding Remarks
- Authorship Contributions
- Footnotes
- Abbreviations
- References
- Figures & Data
- Info & Metrics
- eLetters