


Abstract
Our previous report showed that L754.394 and valspodar (PSC833) are potent inhibitors of midazolam hydroxylation in human jejunum microsomes and vectorial transport of vinblastine in Caco-2 cells, respectively. In the present study, to directly examine the interactions of these compounds as well as other substrates with CYP3A4 and P-glycoprotein (P-gp), we performed in vitro inhibition studies using recombinant CYP3A4-expressed microsomes and an MDR1-transfected cell line, LLC-MDR1, respectively. In CYP3A4-expressed microsomes, both L754.394 and ketoconazole, at a concentration less than 0.5 μM, are the most potent inhibitors of the formation of 1′-hydroxymidazolam, a major metabolite of midazolam formed by CYP3A4. The greatest inhibitory effect on the transcellular transport of digoxin in LLC-MDR1 cells was observed in the presence of valspodar (<0.1 μM), followed by verapamil. From a comparison of the IC50 values, it was shown that L754.394 and valspodar exhibited the highest selectivity for CYP3A4 and P-gp, respectively. To demonstrate such specificity, both midazolam hydroxylation and digoxin transport were observed in CYP3A4 transfected Caco-2 cells, which coexpress both P-gp and CYP3A4, in the presence or absence of L754.394 (0.5 μM) and valspodar (1.0 μM). L754.394 almost completely inhibited midazolam hydroxylation, but not digoxin transport, whereas almost complete inhibition of digoxin transport was observed in the presence of valspodar, but inhibition of the hydroxylation was minimal. Thus, the present study has demonstrated that L754.394 has a specific inhibitory effect on CYP3A4, whereas valspodar is specific for P-gp.
Intestinal first-pass metabolism catalyzed by CYP3A4 has been recognized to be clinically important for several drugs, such as cyclosporin A, tacrolimus, and midazolam (Kolars et al., 1991; Thummel et al., 1996; Floren et al., 1997). CYP3A4 is the most abundant cytochrome P450 (CYP)1 isoform in the liver and small intestinal epithelial cells (Watkins et al., 1987;de Waziers et al., 1990; Paine et al., 1997). It accounts for about 30 and 70% of the total CYP in the liver and small intestine, respectively (Watkins et al., 1987). More than half of all drugs administered to humans are metabolized by CYP3A4 (Li et al., 1995), leading us to believe that, depending on their physicochemical properties, certain types of these drugs may undergo metabolism in the small intestine during gastrointestinal absorption. On the other hand, P-glycoprotein (P-gp) is located at the brush border membranes of the small intestine and acts as an efflux transporter for amphipathic compounds (Hunter et al., 1993; Saitoh and Aungst, 1995; Terao et al., 1996). It is currently believed that intestinal P-gp affects the absorption of drugs after oral administration (Sparreboom et al., 1997b). Wacher et al. (1995) reported that the substrate specificity for CYP3A4 overlaps that for P-gp, such that many substrates of CYP3A4 are also substrates or inhibitors of P-gp. Lown et al. (1997b) and Zhang et al. (1998) have proposed that these proteins act synergistically in the small intestine as an absorption barrier, and this may result in a significant first-pass effect on drugs in the small intestine following their oral administration. Ito et al. (1999) have developed a pharmacokinetic model for drug absorption, including metabolism by CYP3A4 inside the epithelial cells, P-gp-mediated efflux into the lumen, intracellular diffusion from the luminal to the basal side, and subsequent permeation through the basal membrane. This mathematical analysis can simulate the synergistic increase in drug absorption by simultaneously inhibiting both CYP3A4 and P-gp (Ito et al., 1999). However, there is no evidence yet on the contribution of CYP3A4 and P-gp to the intestinal first-pass removal of poorly absorbed drugs. To answer this question, we need to investigate specific inhibitors that can recognize these proteins separately. For such a purpose, in the present study, different inhibition studies of CYP3A4-mediated metabolism (midazolam hydroxylation) and P-gp-mediated vectorial transport (transcellular transport of digoxin) were performed in the presence of substrates and/or modulators of these proteins. In addition, to demonstrate the possible application of these inhibitors in gastrointestinal absorption studies, we examined their specific inhibition in CYP3A4-transfected Caco-2 (CYP3A4-Caco-2) cells, which simultaneously express both CYP3A4 and P-gp.
Experimental Procedures
Materials.
[3H]Digoxin and [14C]mannitol were purchased from Amersham International (Buckinghamshire, UK). L754.394 was kindly supplied by Merck Research Laboratories (West Point, PA). Valspodar (PSC833) and cyclosporin A were kindly donated by Novartis Pharma AG (Basel, Switzerland). Midazolam and 1′-hydroxymidazolam were supplied by Nippon Roche (Tokyo, Japan). Verapamil was obtained from Wako Pure Chemicals (Osaka, Japan). Ketoconazole was purchased from Funakoshi (Tokyo, Japan). All other chemicals were of reagent grade and were obtained commercially.
Metabolism Study in the Recombinant CYP3A4-Expression System.
Microsomes from B lymphoblastoid cells expressing recombinant human CYP3A4 were used. Midazolam (2 μM) was incubated with a reaction mixture consisting of 0.2 mg/ml microsomal protein and an NADPH-generating system (0.33 mM NADP, 8 mM glucose 6-phosphate, 0.1 U/ml glucose-6-phosphate dehydrogenase, 6 mM MgCl2) in 100 mM potassium phosphate buffer (pH 7.4). After a 5-min preincubation, with or without different concentrations of inhibitors (except for L754.394, which was preincubated for 20 min) at 37°C in a shaking water bath, the enzyme reaction was initiated by addition of midazolam, followed by incubation for 20 min. The reaction was terminated by adding 4 volumes of methanol/acetonitrile (1:1), and then the reaction mixture was centrifuged at 10,000g for 5 min. An aliquot of supernatant was evaporated to dryness. The residues were reconstituted in mobile phase for analysis by HPLC.
Cell Culture.
All cultures were maintained in a humidified 37°C incubator in 5% CO2 in air. An MDR1-transfected cell line (LLC-MDR1 cells) was originally developed and kindly donated by Dr. P. Borst in the Netherlands Cancer Institute, Amsterdam (Smith et al., 1998). LLC-MDR1 cells were maintained in M199 medium supplemented with 10% fetal bovine serum, 50 U/ml penicillin, and 50 μg/ml streptomycin, as described by Schinkel et al. (1995). Caco-2 cells were grown in Dulbecco's modified Eagles medium containing 10% fetal bovine serum, 2 mM l-glutamine, 1% nonessential amino acids, 100 U/ml penicillin, 100 μg/ml streptomycin, and amphotericin B. CYP3A4-Caco-2 cells, which were originally developed byCrespi et al. (1996), were maintained under almost identical conditions to the Caco-2 cells except that 15% fetal bovine serum was added to the medium, and vector-bearing cells were selected by resistance to 100 μg/ml hygromycin B. For transport experiments, LLC-MDR1 cells were grown on a polyethylene terephthalate (PET) insert (3.0-μm pore size, 6.4-mm diameter, Falcon, Franklin Lakes, NJ) at a density of 1.5 × 10⁵ cells/well. The cells were cultured for 4 days with one medium replacement. Caco-2 cells were grown on a PET insert (1.0-μm pore size, 10.5-mm diameter, Falcon) at about 1.0 × 10⁵ cells/well and cultured for 3 weeks. CYP3A4-Caco-2 cells were grown on a PET insert (1.0-μm pore size, Falcon) at about 1.2 × 10⁵cells/cm2 and cultured for 14 days. Twenty-four hours before the start of the experiment, cells were pretreated with medium containing 100 nM phorbol 12-myristate 13-acetate to increase CYP3A4 expression.
Transport Study in Cell Monolayers.
The confluent cells were washed with Hanks' balanced salt solutions (HBSS), followed by the addition of HBSS, with or without an appropriate concentration of inhibitors, to both the apical (AP) and basal (BL) sides of the cell monolayer. After preincubation for 20 min, the experiment was started by replacing the HBSS at either the AP or BL side of the cell monolayer with HBSS containing 100 nM [3H]digoxin (at 0.25 μCi/ml), [14C]mannitol (at 0.04 μCi/ml), and the corresponding inhibitor. The cells were incubated at 37°C, and an aliquot of medium was withdrawn from each compartment at specified times. The appearance of radioactivity in the acceptor compartment was monitored. In addition, paracellular flux was monitored as the appearance of [14C]mannitol in the acceptor compartment. For the determination of the cellular protein, the monolayer cells were first solubilized with 1 M of NaOH at 37°C for 2 h, followed by neutralization with 1 M HCl. The protein concentration in the solubilized cells was determined by the method ofLowry et al. (1951) with bovine serum albumin as a standard.
Metabolism Study in CYP3A4-Transfected Caco-2 Monolayers.
After midazolam (1 μM) was added to the AP side, experiments proceeded for 4 h at 37°C. An aliquot of medium was withdrawn from both the AP and BL sides at 4 h. For the analysis of 1′-hydroxymidazolam, 1 ml of 50 mM NaCO3 (pH 12.5) containing 25 ng of etizolam as an internal standard was added to the samples (0.5–1.5 ml), followed by extraction with 7 ml of ethyl acetate. The organic phase was evaporated to dryness under nitrogen, and the residue was reconstituted in mobile phase for analysis by HPLC.
Analytical Methods.
To determine the radiolabeled compounds ([3H]digoxin and [14C]mannitol), samples were transferred to counting vials, mixed with scintillation cocktail (Clearsol I; Nacalai Tesque, Tokyo, Japan), and placed in a liquid scintillation counter (LS 6000SE; Beckman Instruments, Fullerton, CA). Midazolam and 1′-hydroxymidazolam were measured using an HPLC system (Hitachi L-6300 pump, Hitachi AS-4000 autosampler, and Hitachi L-4250 UV spectrophotometric detector) equipped with a reverse-phase column (Tosoh TSK Gel ODS-80Ts, 250- × 4.5-mm inner diameter, with a TSK guard column). The mobile phase consisted of methanol/acetonotrile/10 mM phosphate buffer (pH 7.4) (5:7:10, v/v/v). The flow rate was 1 ml/min, and elution from the column was monitored at 220 nm.
Data Analysis.
The permeability of [3H]digoxin (cleared volume, μl/mg of protein) was calculated by dividing the amount transported by the initial concentration of [3H]digoxin in the donor compartment. The permeation clearance (μl/min/mg of protein) was obtained by linear regression analysis of the slope of the permeation profile against time. For the determination of the IC50 for midazolam hydroxylation, the ratio (R) of the appearance of the metabolite in the presence of inhibitor to that in its absence was fitted to the following equation:
Results
Effects of Different Inhibitors on Midazolam Hydroxylation Activity in the CYP3A4-Expression System.
The metabolic study of midazolam was performed in CYP3A4-recombinant microsomes to identify the most potent inhibitor of CYP3A4 among the four study compounds (ketoconazole, L754.394, verapamil, and valspodar) examined. Figure 1 shows the inhibition profile for CYP3A4-mediated metabolism. L754.394 and ketoconazole reduced the formation of 1′-hydroxymidazolam, the main metabolite of midazolam, at relatively low concentrations, whereas the effect of verapamil and valspodar was minimal (Fig. 1). The IC50values of L754.394 and ketoconazole were <0.05 μM, whereas those of verapamil and valspodar were >7 μM (Table1). In this experiment, microsomes were preincubated in the presence of NADPH for 20 min for L754.394 and 5 min for the other three compounds. When the microsomes were preincubated with each of the compounds for 20 min in the presence of NADPH and the reaction was initiated by the addition of midazolam, the obtained IC50 for ketoconazole and verapamil was 0.0628 and 7.55 μM, respectively, whereas the metabolic activity in the presence of 10 μM valspodar was 85.6% of control. On the other hand, when the microsomes were preincubated for 20 min with midazolam, but without NADPH, and the reaction was initiated by the addition of NADPH, the obtained IC50 for ketoconazole and verapamil was 0.0346 and 3.91 μM, respectively, whereas minimal inhibition by L754.394 was observed. The metabolic activity in such case was reduced to 71.8% of control in the presence of 10 μM valspodar. Thus, it should be noted that the inhibition by L754.394 is preincubation time-dependent, although this is not the case for the other compounds.

Effects of various inhibitors on midazolam hydroxylation activity in the CYP3A4-expression system.
Microsomes were preincubated with inhibitors for 5 min (except for L754.394, which was preincubated for 20 min) at 37°C in the presence of an NADPH-generating system, followed by determination of the hydroxylation activity of midazolam (2 μM). Each point represents the mean ± S.E. of at least three experiments. ●, ketoconazole; ▪, L754.394; ▴, verapamil; ▾, valspodar.
IC50 values for the effect of various inhibitors on the BL to AP transport of digoxin across Caco-2 and LLC-MDR1 cell monolayers and for midazolam hydroxylation activity in CYP3A4-expression system1-a
Transepithelial Transport of Digoxin in Caco-2 and LLC-MDR1 Cells.
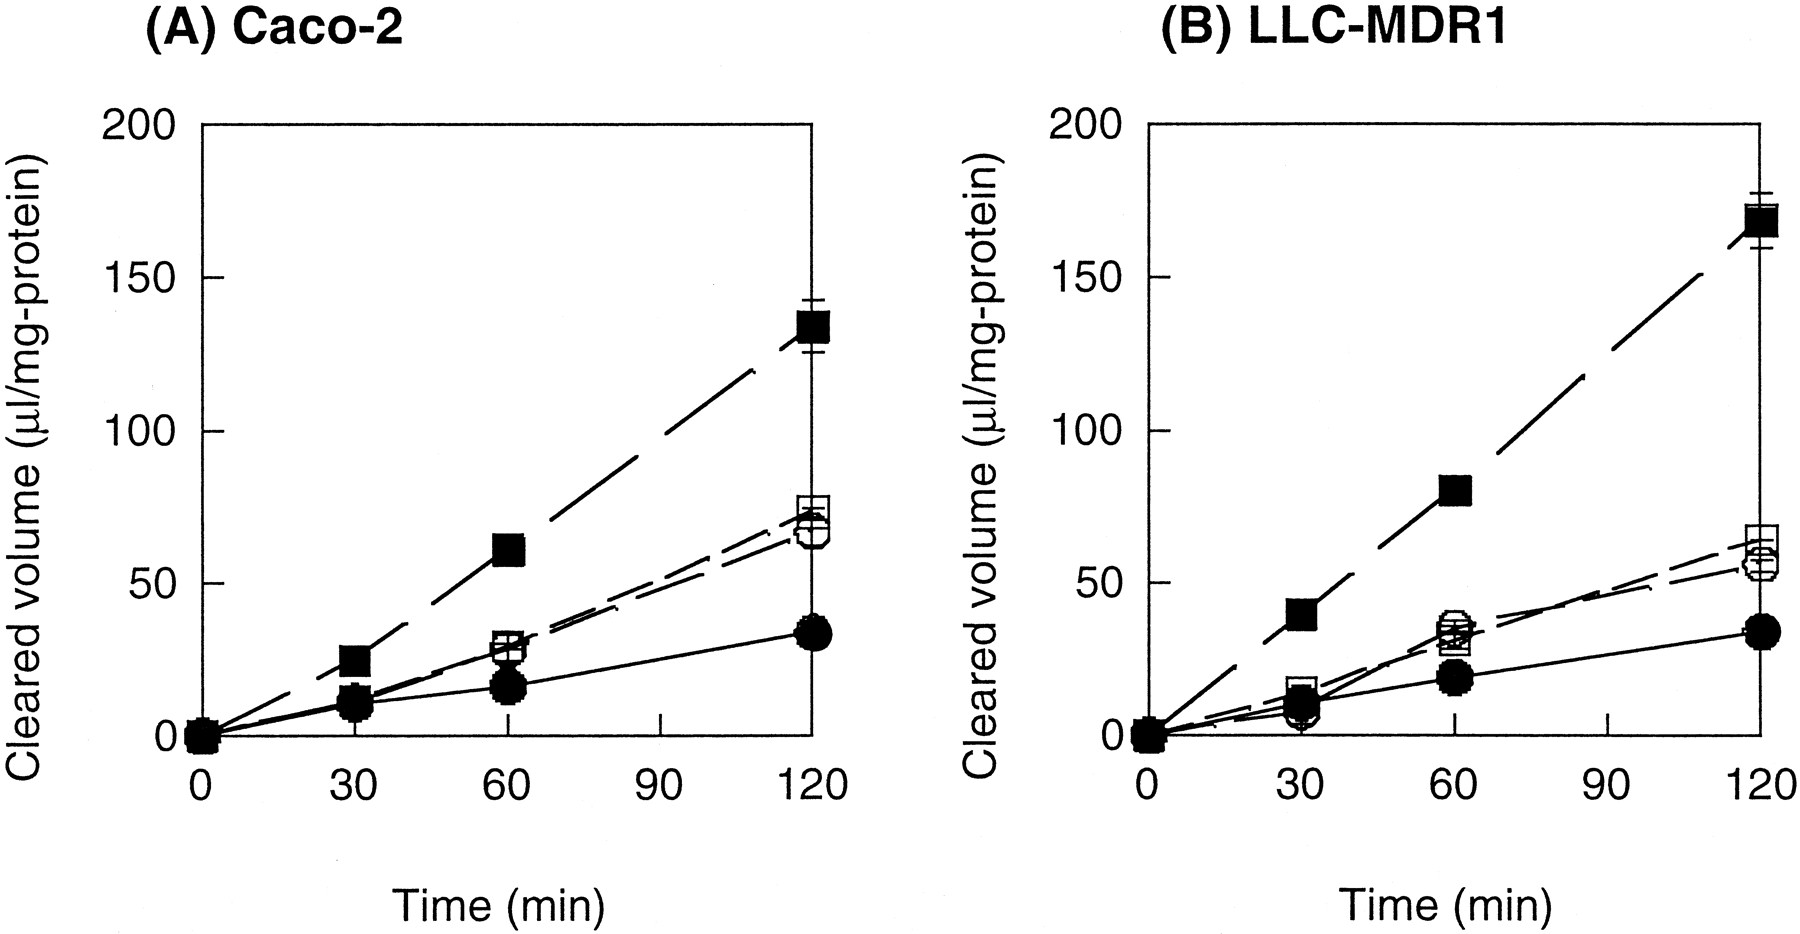
Figure 2 shows the directionality of the transepithelial transport of digoxin in Caco-2 and LLC-MDR1 cells. The BL to AP transport was found to be greater than the AP to BL transport in both cells (Fig. 2). In the presence of valspodar (3 μM), the BL to AP transport was inhibited in these cells, whereas the AP to BL transport was increased (Fig. 2). This vectorial transport property is the direct consequence of P-gp expression on the AP domain. No vectorial transport of digoxin was found in the parent LLC-PK1 cells.

Bidirectional transport of [3H]digoxin across Caco-2 (A) and LLC-MDR1 (B) cell monolayers.
Cumulative amount of digoxin transported either from the AP to BL side (●) or from the BL to AP side (▪) was determined in the presence (open symbols) or absence (closed symbols) of valspodar (3 μM). Data were normalized with respect to the applied digoxin concentration (0.1 μM). All values were normalized with respect to both cellular protein content and the initially applied concentration. Each point represents the mean ± S.E. of at least three experiments.
Effects of Different Inhibitors on the BL to AP Permeation Clearance of Digoxin.
Figure 3 shows the inhibition profiles for the BL to AP transport of digoxin in Caco-2 and LLC-MDR1 cells. In both cells, the transport of digoxin was inhibited by valspodar and verapamil in a dose-dependent manner (Fig. 3). In particular, valspodar was a potent inhibitor of the BL to AP flux of digoxin across both cells (Fig. 3). Verapamil also inhibited the digoxin flux above 10 μM (Fig. 3). The IC50 of verapamil and ketoconazole for digoxin transport differed between Caco-2 and LLC-MDR1 cells. Further studies should be performed to identify the reason for this. The permeation clearance of [14C]mannitol in the absence of each inhibitor was 0.175 ± 0.008 and 0.342 ± 0.060 μl/min/mg of protein in the Caco-2 and LLC-MDR1 cells, respectively. The permeation clearance of [14C]mannitol in the presence of each inhibitor was 50 to 150% of that in their absence in Caco-2 and LLC-MDR1 cells, except that such value was approximately 190% of control in the presence of 300 μM verapamil in LLC-MDR1 cells. These data suggest that the nonspecific effect on the passive permeability will not greatly affect the IC50 values. In the present study, only the BL to AP transport of digoxin was examined to determine the IC50 values. Therefore, the obtained IC50values may still be the apparent ones if there is still an effect on factors other than transport, such as the intracellular digoxin binding. The ratio of the IC50 for CYP3A4 and P-gp (i.e., IC50 for CYP3A4/IC50 for P-gp) indicated that L754.394 and valspodar exhibit a 100-fold higher selectivity for CYP3A4 and P-gp inhibition, respectively (Table 1).
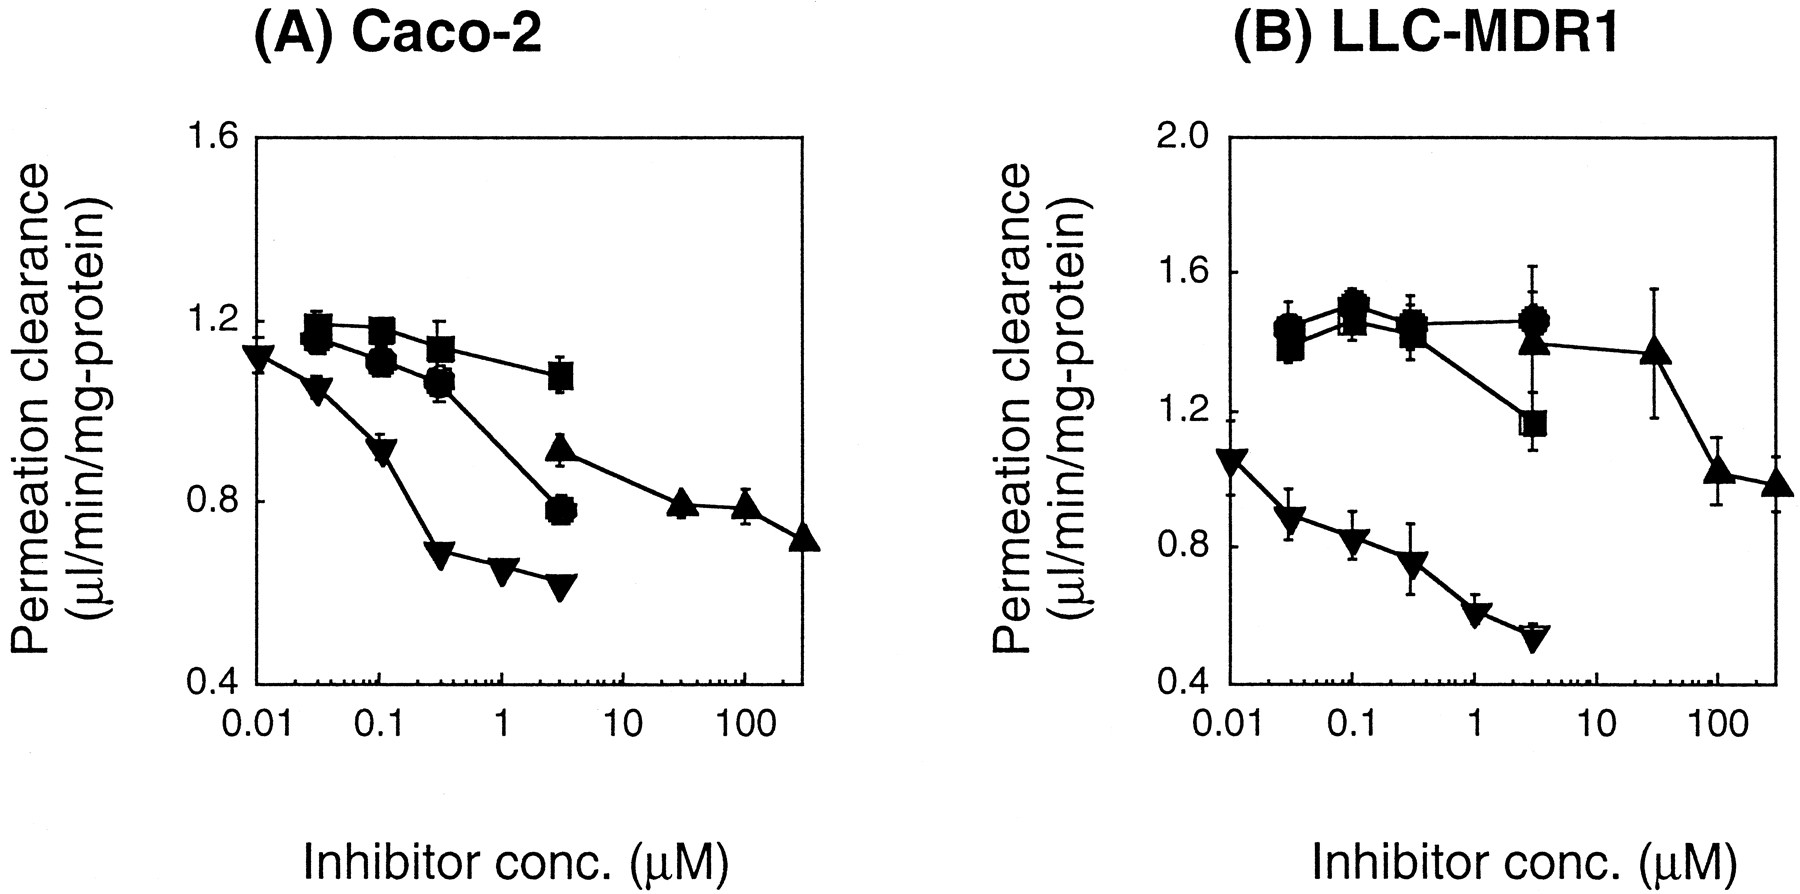
Effects of various inhibitors on the BL to AP permeation clearance of [3H]digoxin across Caco-2 (A) and LLC-MDR1 (B) cell monolayers.
Cell monolayers were preincubated with inhibitors for 20 min, and the BL to AP transport of digoxin was measured. All values were normalized with respect to both cellular protein content and the initially applied concentration. The permeation clearance in the absence of inhibitor was 1.13 ± 0.10 and 1.41 ± 0.07 μl/min/mg of protein in the Caco-2 and LLC-MDR1 cells, respectively. Each point represents the mean ± S.E. of at least three experiments. ●, ketoconazole; ▪, L754.394; ▴, verapamil; ▾, valspodar.
Effects of L754.394 and Valspodar on Digoxin Transport and Midazolam Hydroxylation in CYP3A4-Transfected Caco-2 Cells.
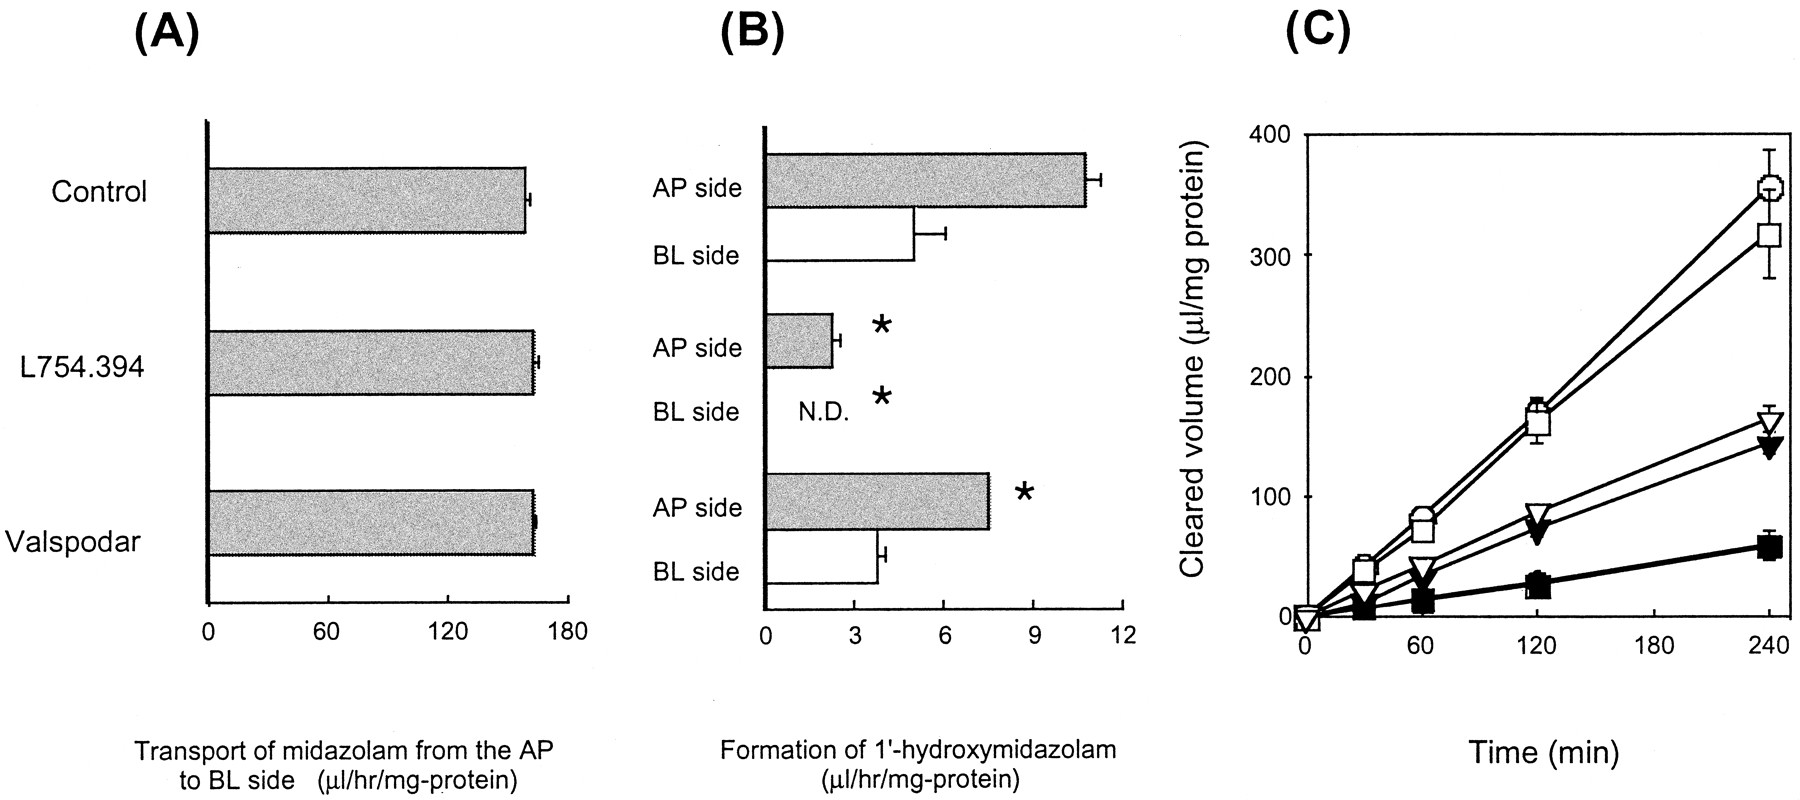
Because Caco-2 cells have minimal CYP3A4 activity, CYP3A4-Caco-2 cells that express both CYP3A4 and P-gp were used to simultaneously evaluate the specific effect of the inhibitors (Fig.4). In the presence of L754.394 (0.5 μM), formation of 1′-hydroxymidazolam was almost completely inhibited (Fig. 4B), whereas the transport of the parent compound from the AP to BL side was only minimally affected (Fig. 4A). The BL to AP transport of digoxin in the presence of L754.394 (0.5 μM) was the same as in the control experiment (Fig. 4C), whereas valspodar (1 μM) inhibited the transport of digoxin, the AP to BL transport being almost comparable with the BL to AP transport in its presence (Fig. 4C). Approximately 29 and 23% inhibition of the formation of 1′- hydroxymidazolam on the AP and BL side, respectively, was observed in the presence of valspodar (Fig. 4B). Thus, L754.394 and valspodar are able to selectively inhibit midazolam metabolism and digoxin transport, respectively. The permeation clearance of [14C]mannitol in the absence of each inhibitor was 0.696 ± 0.048 μl/min/mg of protein in the CYP3A4-transfected Caco-2 cells and 98 to 120% of control in the presence of 1.0 μM valspodar or 0.5 μM L754.394.

Effects of L754.394 and valspodar on the transcellular transport of midazolam (A), midazolam hydroxylation (B), and transcellular transport of digoxin (C) in CYP3A4-transfected Caco-2 cell monolayers.
CYP3A4-Caco-2 cells were preincubated in the presence of L754.394 (0.5 μM), valspodar (1.0 μM), or without either for 20 min. Midazolam (1 μM) was then added to the AP side. The transport of midazolam to the BL side was measured up to 4 h and shown in panel A. The appearance of 1′-hydroxy-midazolam either on the AP or BL side was also determined and shown in panel B. Considering the detection limit, the appearance on the BL side in the presence of L754.394 was less than 1 μl/h/mg of protein. ∗, statistically different from the control values (P < .05). In panel C, after a similar preincubation, digoxin (0.1 μM) was applied either to the AP (●, ▪, ▾) or BL (○, ■, ▿) side, and its transport in the presence of L754.394 (▪, ■), valspodar (▾, ▿) or without either (●, ○) was investigated. All values were normalized with respect to both cellular protein content and the initially applied concentration. Each point represents the mean ± S.E. of at least three experiments.
Discussion
It is generally accepted that metabolism by CYP3A4 and efflux by P-gp in gut epithelial cells limit the oral bioavailability of several drugs (Wu et al., 1995; Saitoh and Aungst, 1995). To evaluate their role in intestinal absorption, it is necessary to identify specific inhibitors for each protein. We previously reported that L754.394 and valspodar are potent inhibitors of midazolam hydroxylation in human jejunum and liver microsomes, and vectorial transport of vinblastine in Caco-2 cells, respectively (Achira et al., 1999). Although there are abundant quantities of CYP3A4 in human liver and small intestine and P-gp is constitutively expressed in Caco-2 cells, caution should be exercised in demonstrating their direct inhibitory action on CYP3A4 and P-gp. In the present study, to directly demonstrate their inhibitory effect on human CYP3A4 and P-gp, we carried out in vitro inhibition studies of midazolam hydroxylation and vectorial transport of digoxin in recombinant CYP3A4-expressed microsomes and LLC-MDR1 cells, respectively.
The Ki of L754.394 and ketoconazole for midazolam hydroxylation was lower than that of valspodar and verapamil in recombinant CYP3A4-microsomes (Fig. 1). L754.394 is reported to be a potent inactivator of CYP3A4 (Chiba et al., 1995). In a similarly designed experiment, von Moltke et al. (1996) determined theKi values (0.0037 μM) of ketoconazole for the formation of 1′-hydroxymidazolam in human liver microsomes, and this was consistent with the present result (Table 1). The IC50 values of the four compounds obtained in the present study using recombinant CYP3A4-microsomes (Table 1) were also comparable with the IC50 values using human jejunum microsomes (0.0076, 0.03, 4.03, and 29.9 μM for L754.394, ketoconazole, valspodar, and verapamil, respectively, Achira et al., 1999). Based on these results, it can be concluded that L754.394 and ketoconazole are more potent inhibitors of CYP3A4, compared with the other two compounds.
The inhibition profile of each compound toward vectorial digoxin transport showed a similar tendency in both Caco-2 and LLC-MDR1 cell monolayers (Fig. 3), the IC50 value of valspodar being the lowest (Table 1). Valspodar is a nonimmunosuppressive cyclosporin A derivative and is now under clinical investigation as a modulator of multidrug resistance because it is a potent inhibitor of P-gp function (Keller et al., 1992; Watanabe et al., 1995). TheKi values of valspodar for the transport of daunorubicin mediated by P-gp into rat canalicular membrane vesicles was estimated to be 0.3 μM (Böhme et al., 1993), which is consistent with our results. Thus, of the four compounds examined, valspodar is the most potent inhibitor of P-gp. By comparing the IC50 ratios between CYP3A4 and P-gp (Table. 1), L754.394 and valspodar proved to be 100 times more selective toward CYP3A4 and P-gp, respectively.
Crespi et al. (1996) reported that CYP3A4-transfected Caco-2 cells showed a 100-fold increase in testosterone 6β-hydroxylation activity, compared with the parental cell lines. Therefore, it is possible to simultaneously evaluate the specific inhibition by L754.394 and valspodar. L754.394 and valspodar specifically inhibited midazolam hydroxylation and digoxin transport, respectively (Fig. 4), indicating that these compounds are also specific inhibitors of CYP3A4 and P-gp, respectively, in an intact cell monolayer. However, we should also note the weak effect of L754.394 on the transport of midazolam (Fig. 4A). This can be explained if we consider that the metabolism in CYP3A4 transfected Caco-2 monolayers is still low and not enough to affect the net transport of parent compound. Actually, hydroxylation of midazolam accounted for, at most, 10% of its transport in the control (Fig. 4, A and B). Thummel et al. (1996) reported that the small intestine is a major site for the presystemic CYP3A-mediated metabolism of midazolam after oral administration. The inhibition of CYP3A-mediated metabolism both in the small intestine and the liver has been suggested to contribute to the pharmacokinetic interaction between midazolam and clarithromycin (Gorski et al., 1998). Therefore, our present findings suggest that the metabolism taking place in the CYP3A4-transfected Caco-2 monolayers is still not extensive compared with that in vivo. Thus, a more cautious interpretation is required when the transcellular transport in this cell line is compared with in vivo gastrointestinal absorption. To monitor the oral absorption of new drugs during the initial stages of their development, we should establish optimum conditions to observe the higher CYP3A4-mediated metabolism, which will have a potential effect on the transcellular transport of the parent compound.
Controversial results have been obtained regarding the cooperative activity of CYP3A4 and P-gp as a barrier to gastrointestinal drug absorption. Lown et al. (1997b) reported that the Cmax and oral clearance of cyclosporin A appeared to correlate with both the liver CYP3A4 activity, as measured by the erythromycin breath test, and the intestinal P-gp concentration, but did not correlate with the intestinal CYP3A4 levels. Gomez et al. (1995) found that ketoconazole increased the gastrointestinal absorption of cyclosporin A , although ketoconazole had no effect on its systemic clearance. Assuming that ketoconazole does not influence the hepatic blood flow rate or the fraction of dose absorbed, this result may be accounted for by inhibition of intestinal CYP3A4. In contrast, as discussed above, the inhibition of P-gp by ketoconazole may also be possible. Lown et al. (1997a) found that the area under the curve of felodipine after giving it orally with grapefruit juice were 370% of the control. The intestinal CYP3A4 content after administration of grapefruit juice was reduced to 38% of the control, although the liver CYP3A4 activity and the intestinal P-gp content were unaffected, leading us to believe that the increase in the oral area under the curve of felodipine may be due to the inhibition of intestinal CYP3A4. However, other constituents of grapefruit juice may also inhibit the function of P-gp. To determine the role of CYP3A4 and P-gp as a barrier to absorption, it is important to administer a specific inhibitor that can selectively recognize each protein.
In the present study, the inhibitors were added to both the AP and BL side of the monolayer cells. If the specific inhibitors identified in the present study are orally administered in vivo, such inhibitors will be exposed first from the apical side (gut lumen). Therefore, it would still be possible, in in vivo studies, to observe reduced (or increased) selectivity between valspodar and L754.394 and a difference in the relative potency of the series of inhibitors studied. Further studies are needed to fully characterize the selectivity of these compounds found in vivo.
Acknowledgments
We thank Merck Research Laboratories, Nippon Roche, and Novartis Pharma AG for kindly supplying L754.394, valspodar, and midazolam, respectively.
Footnotes
-
Send reprint requests to: Yuichi Sugiyama, Ph.D., Graduate School of Pharmaceutical Sciences, University of Tokyo, 7-3-1, Hongo, Bunkyo-ku, Tokyo 113-0033, Japan. E-mail:sugiyama{at}seizai.f.u-tokyo.ac.jp
-
This study was supported in part by a Grant-in-Aid for Scientific Research provided by the Ministry of Education, Science and Culture of Japan.
- Abbreviations used are::
- CYP
- cytochrome P450
- P-gp
- P-glycoprotein
- IC50
- 50% inhibitory concentration
- HBSS
- Hanks' balanced salt solution
- PET
- polyethylene terephtalate
- valspodar or PSC833
- (3′-oxo-4-butenyl-4-methyl-threoninel)-(Val2)-cyclosporin
- L754.394
- N-[2(R)-hydroxy-1(S)-indanyl]-5-[2(S)-(1,1-dimethylethylaminocarbonyl)-4-[(furo[2,3-b]pyridin-5-yl)methyl]piperazin-1-yl]-4(S)-hydroxy-2(R)-phenylmethylpentanamide
- AP
- apical
- BL
- basal
- Received December 31, 1999.
- Accepted July 14, 2000.
- The American Society for Pharmacology and Experimental Therapeutics


