


Abstract
Gemfibrozil 1-O-β-glucuronide is a mechanism-based inhibitor of cytochrome P450 2C8. We studied the recovery of CYP2C8 activity after discontinuation of gemfibrozil treatment using repaglinide as a probe drug, to estimate the in vivo turnover half-life of CYP2C8. In a randomized five-phase crossover study, nine healthy volunteers ingested 0.25 mg of repaglinide alone or after different time intervals after a 3-day treatment with 600 mg of gemfibrozil twice daily. The area under the plasma concentration-time curve (AUC) from time 0 to infinity of repaglinide was 7.6-, 2.9-, 1.4- and 1.0-fold compared with the control phase when it was administered 1, 24, 48, or 96 h after the last gemfibrozil dose, respectively (P < 0.001 versus control for 1, 24, and 48 h after gemfibrozil). Thus, a strong CYP2C8 inhibitory effect persisted even after gemfibrozil and gemfibrozil 1-O-β-glucuronide concentrations had decreased to less than 1% of their maximum (24-h dosing interval). In addition, the metabolite to repaglinide AUC ratios indicated that significant (P < 0.05) inhibition of repaglinide metabolism continued up to 48 h after gemfibrozil administration. Based on the recovery of repaglinide oral clearance, the in vivo turnover half-life of CYP2C8 was estimated to average 22 ± 6 h (mean ± S.D.). In summary, CYP2C8 activity is recovered gradually during days 1 to 4 after gemfibrozil discontinuation, which should be considered when CYP2C8 substrate dosing is planned. The estimated CYP2C8 half-life will be useful for in vitro-in vivo extrapolations of drug-drug interactions involving induction or mechanism-based inhibition of CYP2C8.
Cytochrome P450 (P450) 2C8 accounts for approximately 6% of the total hepatic P450 content. It plays an important role in the metabolism of endogenous substances, e.g., arachidonic acid (Rifkind et al., 1995; Ohyama et al., 2000), as well as many drugs, including repaglinide (Bidstrup et al., 2003; Kajosaari et al., 2005a), pioglitazone (Jaakkola et al., 2006), rosiglitazone (Baldwin et al., 1999), loperamide (Kim et al., 2004), amiodarone (Ohyama et al., 2000), cerivastatin (Wang et al., 2002), and paclitaxel (Rahman et al., 1994). Thus, factors affecting CYP2C8 activity may have potentially important effects on drug efficacy and patient safety.
The lipid-lowering agent gemfibrozil is the strongest known inhibitor of CYP2C8 at clinically relevant doses in vivo (Backman et al., 2002; Niemi et al., 2003). Its inhibitory effect is based mainly on its metabolite, gemfibrozil 1-O-β-glucuronide, which is a selective mechanism-based inhibitor of CYP2C8 (Shitara et al., 2004; Ogilvie et al., 2006; Baer et al., 2009). In a previous study, the strong inhibitory effect of gemfibrozil on repaglinide metabolism persisted over the whole time window studied, up to 12 h after the last dose of gemfibrozil, although the plasma concentrations of gemfibrozil and gemfibrozil 1-O-β-glucuronide had already decreased to less than 5 to 10% of their peak, consistent with the irreversible mechanism-based nature of the inhibitory effect (Tornio et al., 2008). In addition to inhibiting CYP2C8, gemfibrozil and/or its glucuronide can competitively inhibit some other P450 enzymes and organic anion-transporting polypeptide (OATP) 1B1 in vitro (Wen et al., 2001; Shitara et al., 2004). However, in vivo these effects are short-lived because of the short half-life of gemfibrozil and much weaker than those on CYP2C8. For example, the CYP2C9-inhibitory effect of gemfibrozil in vitro does not translate into any significant effect on the elimination of S-warfarin in humans (Lilja et al., 2005).
The recovery of enzyme activity after mechanism-based inhibition can occur only after de novo synthesis of the enzyme (Ghanbari et al., 2006). Because enzyme synthesis generally occurs at a constant rate and enzyme degradation can be described as a first-order process (Yang et al., 2008), the time required for complete recovery after the inhibitor has been eliminated is determined by the enzyme's degradation (turnover) half-life. It has previously been estimated that the CYP2C8 turnover half-life is approximately 8 to 41 h in vitro (Renwick et al., 2000), but up to now no in vivo data have been published (Yang et al., 2008; Grimm et al., 2009).
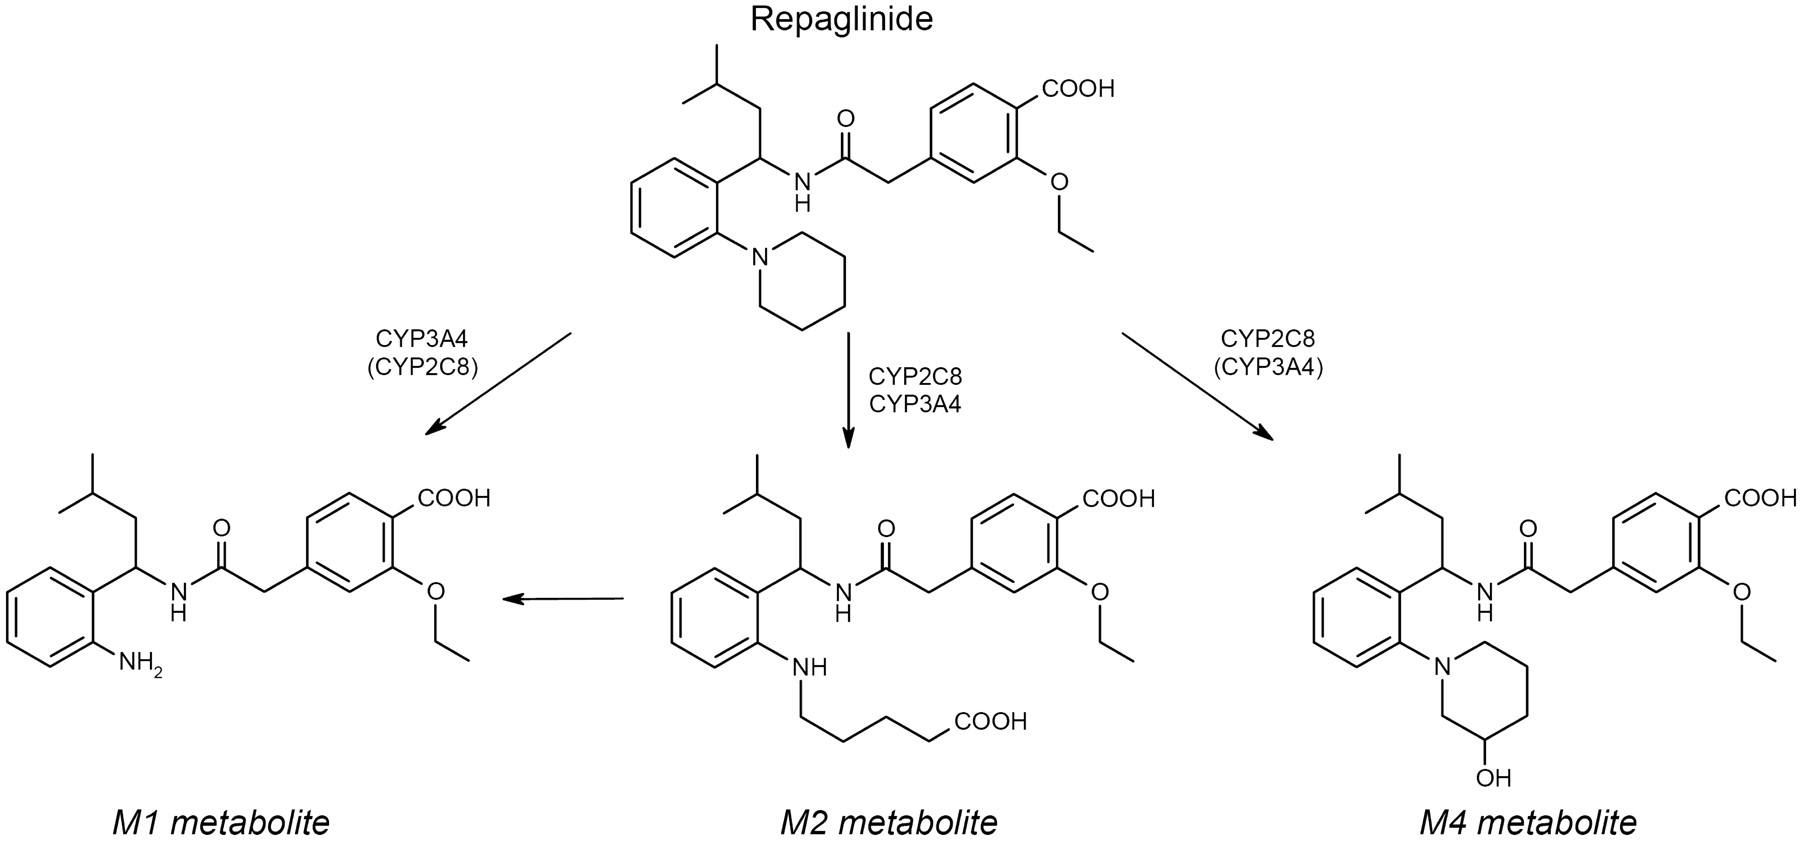
Repaglinide, a short-acting meglitinide analog antidiabetic drug, is eliminated by metabolism to several metabolites (Fig. 1) (Bidstrup et al., 2003; Kajosaari et al., 2005a,b). The formation of the main metabolite M2 and especially that of M4 is largely dependent on CYP2C8, whereas the less important M1 is mainly formed by CYP3A4 (Bidstrup et al., 2003; Kajosaari et al., 2005a,b). The plasma concentrations of repaglinide are considerably raised by inhibitors of CYP2C8 (Niemi et al., 2003; Kajosaari et al., 2005a; Bidstrup et al., 2006). Because of its sensitivity to CYP2C8 inhibition and its short half-life, repaglinide has been recommended as a probe drug for studying CYP2C8 activity (Huang et al., 2007). However, it should be recognized that repaglinide is also a substrate for OATP1B1, and polymorphisms in the SLCO1B1 gene affect its pharmacokinetics (Niemi et al., 2005; Kalliokoski et al., 2008a,b,c).

Chemical structures of repaglinide and its M1, M2, and M4 metabolites, as well as the enzymes catalyzing their formation. [The figure has been drawn on the basis of the findings in Bidstrup et al. (2003) and Kajosaari et al. (2005a,b)].
The aim of the present study was to investigate the recovery of CYP2C8 activity after gemfibrozil treatment using repaglinide as a probe drug to estimate the turnover half-life of CYP2C8. To achieve this, 10 healthy volunteers were given a single dose of repaglinide alone and after a 600-mg gemfibrozil twice daily pretreatment, with a varying time interval, up to 96 h, between the last dose of gemfibrozil and the administration of repaglinide.
Materials and Methods
Subjects.
Ten healthy volunteers participated in the study after giving written informed consent (Table 1). The volunteers were ascertained to be healthy by medical history, physical examination, and routine laboratory tests before entering the study. None of the volunteers used continuous medication, e.g., oral contraceptives, or were smokers. The number of subjects was estimated to be sufficient to detect a 30% change in the area under the plasma concentration-time curve from time 0 to infinity (AUC0–∞) of repaglinide with a power of 80% (α level 5%).
Characteristics of subjects and individual estimates of their CYP2C8 turnover half-lives and FDCL24 values
Subject 5 was excluded from all pharmacokinetic analyses, because of failure to comply with the gemfibrozil dosing schedule in the 48-h interval study phase.
Study Design.
The study protocol was approved by the Coordinating Ethics Committee of the Helsinki and Uusimaa Hospital District and by the National Agency for Medicines. A randomized crossover study with five phases and washout periods of 3 weeks was performed. During each phase, the volunteers received orally five single doses of 600 mg of gemfibrozil (one Lopid 600-mg tablet; Gödecke, Freiburg, Germany) according to twice-daily dosing at 8:00 AM and 8:00 PM (1-h interval phase) or at 9:00 AM and 9:00 PM or no pretreatment. On the study day, a single oral dose of 0.25 mg of repaglinide (half of a 0.5-mg tablet of NovoNorm; Novo Nordisk, Bagsværd, Denmark) was administered with 150 ml of water at 9:00 AM after an overnight fast either without pretreatment or 1, 24, 48, or 96 h after the last gemfibrozil dose. The subjects remained seated for 3 h after taking repaglinide and were under direct medical supervision for 9 h. Food intake was identical in all phases. The volunteers received a standardized light breakfast 15 min after repaglinide administration (eaten over a duration of 10 min), snacks after 1 and 2 h (eaten over a duration of 5 min), a warm meal after 3 h, and snacks after 7 and 9 h. Additional carbohydrates, glucose solution for intravenous use, and glucagon for intramuscular use were available but were not needed.
Sampling.
A blood sample was taken at 8 AM on the day before repaglinide administration during the 48-h interval study phase and on the 3 days before repaglinide administration during the 96-h interval phase. On the days of repaglinide administration, timed blood samples were drawn from a cannulated forearm vein before and at 20, 40, 60, 80, and 100 min and 2, 2.5, 3, 4, 5, 7, and 9 h after the administration of repaglinide. Blood samples (5 or 10 ml each) were taken into EDTA-containing tubes. On the study day, blood glucose concentrations were measured immediately after each blood sampling by the glucose oxidase method (Precision G Blood Glucose Testing System; MediSense, Bedford, MA). The between-day coefficient of variation (CV) of the method was 5.6% at 2.6 mM and 3.2% at 18.2 mM (n = 13). Plasma was separated within 30 min and stored at −70°C until analysis.
Determination of Drug Concentrations.
Concentrations of repaglinide and its metabolites M1, M2, and M4 were measured in plasma samples by use of an API 3000 liquid chromatography-tandem mass spectrometry system (Sciex Division of MDS, Toronto, ON, Canada) (Tornio et al., 2008). Reverse-phase chromatographic separation was achieved on a Symmetry C8 column (150 × 2.1 mm; Waters, Milford, MA) by use of a mobile phase consisting of 10 mM ammonium formate (pH 3.5, adjusted with 99% formic acid) and acetonitrile. A 15-μl aliquot was injected, and the mobile phase flow rate was 180 μl/min. The mobile phase gradient comprised 3 min at 40% acetonitrile, 3 min to 65% acetonitrile, 2 min at 65% acetonitrile, 4 min to 100% acetonitrile, 4 min at 100% acetonitrile, and 8 min at 40% acetonitrile, yielding a total chromatographic run time of 24 min. Repaglinide-d5 served as the internal standard. The mass spectrometer was operated in positive electrospray mode, and the samples were analyzed via multireaction monitoring by use of the transition of the [M + H]+ precursor ion to product ion for each analyte and internal standard. The multireaction monitoring ion transitions were as follows: m/z 453 to m/z 230 for repaglinide, m/z 385 to m/z 162 for M1, m/z 485 to m/z 230 for M2, m/z 469 to m/z 246 for M4, and m/z 458 to m/z 230 for repaglinide-d5. The limit of quantification for repaglinide was 0.01 ng/ml and interday CVs were 3.1% at 0.1 ng/ml, 1.7% at 2.0 ng/ml, and 1.4% at 20 ng/ml (n = 10). Because authentic metabolite standards were not available, metabolites were identified by their ion transitions, retention times, and formation by recombinant CYP2C8 and CYP3A4 (data not shown), comparable to those reported in previous literature (Bidstrup et al., 2003), and their concentrations are given in arbitrary units (units per milliliter) relative to the ratio of the peak area of each metabolite to that of the internal standard in the chromatogram. The limit of quantification for all metabolites was based on a signal/noise ratio of more than 10:1. Gemfibrozil did not interfere with the assay.
The plasma concentrations of gemfibrozil and gemfibrozil 1-O-β-glucuronide were determined by the use of an Applied Biosystems API 2000 Q Trap liquid chromatography-tandem mass spectrometry system (Sciex Division of MDS) using a modification of a previous method (Roadcap et al., 2003). Gemfibrozil-d6 and gemfibrozil 1-O-β-glucuronide-d6 served as internal standards. The selected reaction monitoring ion transitions were m/z 249 to m/z 121 for gemfibrozil, m/z 425 to m/z 121 for gemfibrozil 1-O-β-glucuronide, m/z 255 to m/z 121 for gemfibrozil-d6, and m/z 431 to m/z 121 for gemfibrozil 1-O-β-glucuronide-d6. The limits of quantification for gemfibrozil and gemfibrozil 1-O-β-glucuronide were 0.0025 ng/ml, and interday CVs were 1 to 4% and 3 to 8% at relevant plasma concentrations, respectively.
Pharmacokinetics.
The pharmacokinetics of repaglinide and its metabolites M1, M2, and M4 were characterized by the peak concentration (Cmax), AUC0–9 h, and AUC0–∞ (AUC0–3 h for M4) and elimination half-life (t1/2), calculated by noncompartmental analysis using WinNonlin (version 5.2; Pharsight, Mountain View, CA). The terminal log-linear part of each concentration-time curve was identified visually. The elimination rate constant (ke) was determined by linear regression analysis of the log-linear part of the plasma concentration-time curve. The t1/2 was calculated by the equation t1/2 = ln2/ke. The AUC values were calculated by use of the linear trapezoidal rule for the rising phase of the plasma repaglinide concentration-time curve and the log-linear trapezoidal rule for the descending phase, with extrapolation to infinity, when appropriate, by dividing the last measured concentration by ke. In addition, the oral clearance (CL/F) of repaglinide was calculated by dividing its dose (0.25 mg) with its AUC0–∞. The pharmacokinetics of gemfibrozil and gemfibrozil 1-O-β-glucuronide were characterized by concentration at time 0 (C0), Cmax, time to Cmax (tmax), t1/2, and AUC0–9 h. In addition, their average concentrations (Cavg 0–9 h) were calculated by dividing the AUC0–9 h by 9 h.
Pharmacodynamics.
The pharmacodynamics of repaglinide were characterized by baseline (i.e., before administration of repaglinide), minimum, and mean blood glucose concentrations (from 0 to 3 and 9 h). The mean concentrations were calculated by dividing the area under the blood glucose concentration-time curve by the corresponding time interval.
Genotyping.
For genotyping, a 20-ml EDTA blood sample was drawn from each subject and stored at −20°C before genomic DNA extraction with standard methods (QIAamp DNA Blood Mini Kit; QIAGEN, Hilden, Germany). The subjects were genotyped for the CYP2C8*3 (c.416G>A and c.1196A>G) and CYP2C8*4 (c.792C>G) alleles using Custom TaqMan SNP Genotyping Assays and for the SLCO1B1 c.521T>C SNP with a validated TaqMan genotyping assay on an Applied Biosystems 7300 real-time polymerase chain reaction system (Pasanen et al., 2006).
Statistical Analysis.
The results are expressed as mean values ± S.D. in the text, tables, and figures, unless otherwise indicated. The pharmacokinetic and pharmacodynamic variables between the study phases were compared by the paired t test. To avoid false-negative conclusions and because the direction of the interaction has been documented previously, no Bonferroni correction for multiple comparisons was applied, and differences were considered statistically significant at P < 0.05. With Bonferroni correction, the threshold for significance would be P < 0.005. All the data were analyzed with SPSS for Windows (version 16.0.1; SPSS Inc., Chicago, IL).
Estimation of the CYP2C8 Half-Life and Evaluation of a Competitive Inhibition Model.
Using the recovery of CL/F of repaglinide after gemfibrozil administration, the turnover half-life of the hepatic CYP2C8 enzyme was estimated with the following assumptions. 1) When repaglinide was given 24 h after the last gemfibrozil dose or later, the decrement in its CL/F was due to irreversible mechanism-based inactivation of the hepatic CYP2C8 enzyme only; i.e., no competitive inhibition of CYP2C8 or any kind of changes in the expression or activity of other enzymes or transporters was involved and no inhibition of CYP2C8 in the intestinal wall was involved. 2) The CYP2C8 inactivating process had terminated before the 24-h time point. 3) CYP2C8 enzyme production occurs at a constant rate in hepatocytes. 4) The degradation of CYP2C8 follows a first-order process. With these assumptions, the CL/F after the 24-h interval time point can be expressed using the equation, CL/F(t) = CL/Frecovered − (FDCL24 · e−k(t−24 h)) · CL/Frecovered, where CL/Frecovered is the CL/F of repaglinide when CYP2C8 activity is fully recovered, FDCL24 is the fractional decrement in the CL/F of repaglinide when repaglinide is administered at 24 h after the last dose of gemfibrozil, k is the first-order degradation rate constant of CYP2C8, and t is the time after the last dose of gemfibrozil. This equation was fitted to the CL/F data obtained during the 24-, 48-, and 96-h interval phases and the control phase for pooled data and for each individual subject separately using nonlinear regression analysis. For this analysis, t was set at 10,000 h, approximating infinity, for the control phase data (representing fully recovered basal CYP2C8 activity). In addition, to evaluate whether the present findings can be explained by competitive inhibition of the metabolism of repaglinide, the relationships between the extent of interaction (repaglinide AUCinhibited/AUCcontrol) and the average concentrations (Cavg 0–9 h) of gemfibrozil and gemfibrozil 1-O-β-glucuronide in all subjects were modeled using nonlinear regression analysis with the equation, AUCinhibited/AUCcontrol = 1/[(fmCYP/(1 + I/Ki))+(1 − fmCYP)], where fmCYP is the fraction of repaglinide dose metabolized by the P450 inhibited, I is the observed plasma concentration of the inhibitor (gemfibrozil or gemfibrozil 1-O-β-glucuronide), and Ki is the “in vivo” competitive inhibition constant of the inhibitor.
Results
Gemfibrozil significantly increased the plasma concentrations of repaglinide and its M1 metabolite and decreased the metabolite (in particular M4)/repaglinide AUC ratios, when repaglinide was taken 1, 24, or 48 h after the last dose of the gemfibrozil treatment (Figs. 2 and 3; Table 2). Only 9 of the 10 subjects were included in the statistical analysis of the data, because subject 5 was excluded from all statistical analyses based on noncompliance in the 48-h interval phase, as determined by the gemfibrozil concentration assay.

Mean ± S.D. plasma repaglinide and blood glucose concentrations in nine healthy volunteers after a single oral dose of 0.25 mg of repaglinide after pretreatment with 600 mg of gemfibrozil twice daily, with varying dose intervals between last gemfibrozil dose and repaglinide. ○, control phase (no pretreatment); ●, repaglinide 1 h after gemfibrozil; ■, repaglinide 24 h after gemfibrozil; ▴, repaglinide 48 h after gemfibrozil; ★, repaglinide 96 h after gemfibrozil. Inset depicts the same data on a semilogarithmic scale. For clarity, some error bars have been omitted.
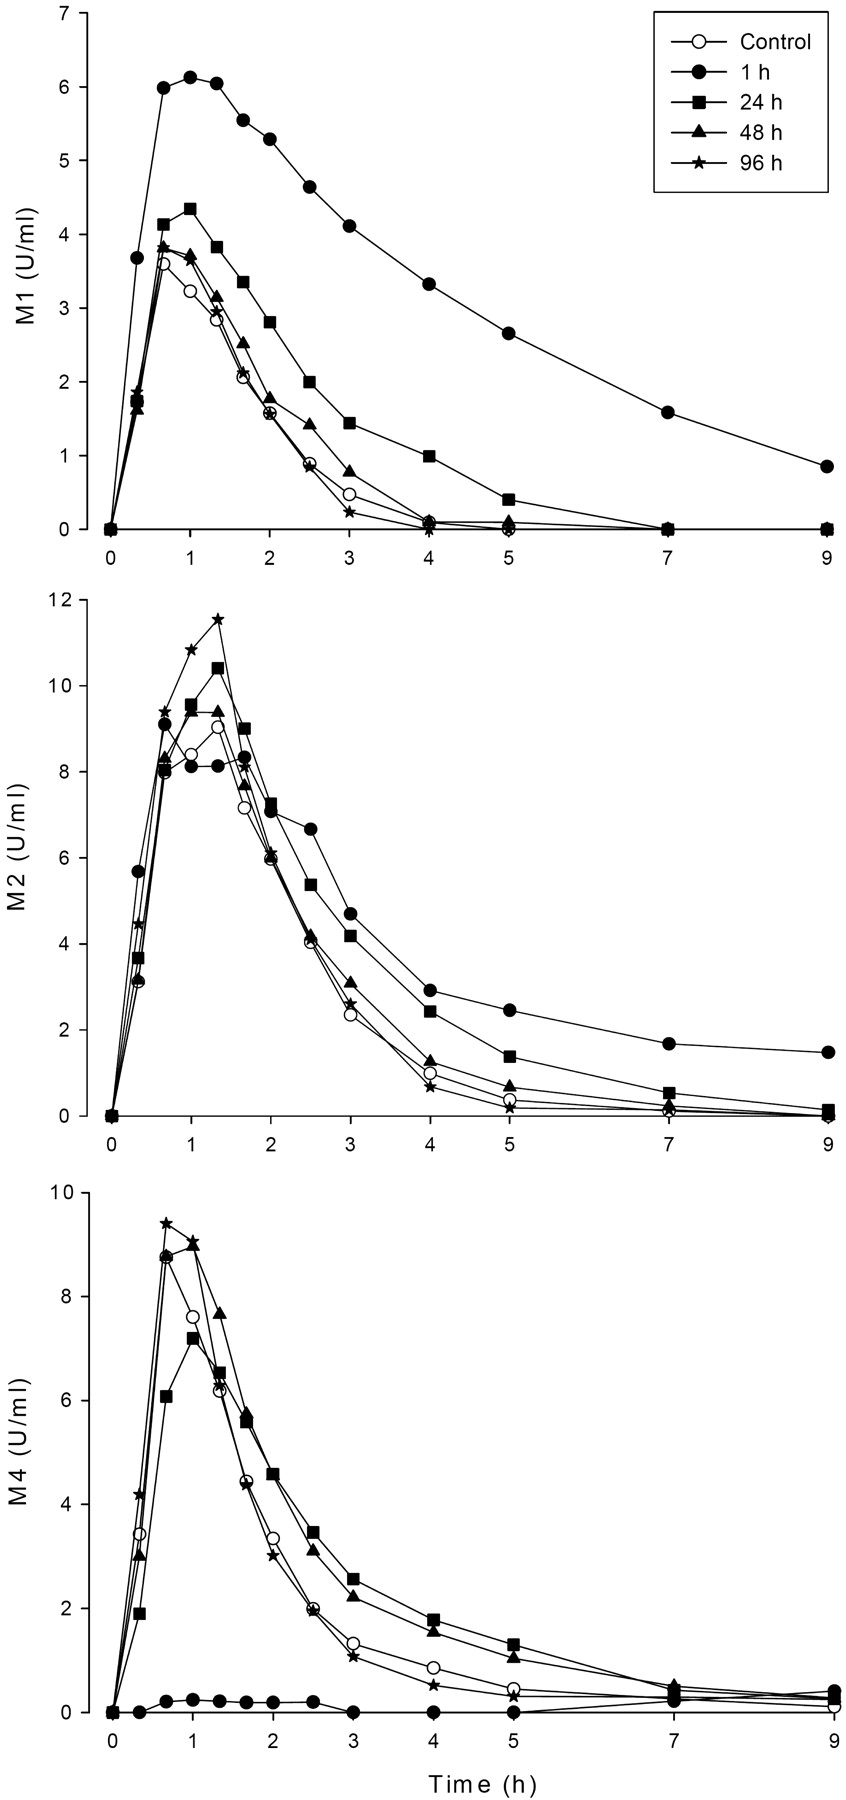
Mean plasma concentrations of repaglinide metabolites M1, M2, and M4 in 9 healthy volunteers after a single oral dose of 0.25 mg of repaglinide after pretreatment with 600 mg of gemfibrozil twice daily, with varying dose intervals between last gemfibrozil dose and repaglinide. ○, control phase (no pretreatment); ●, repaglinide 1 h after gemfibrozil; ■, repaglinide 24 h after gemfibrozil; ▴, repaglinide 48 h after gemfibrozil; ★, repaglinide 96 h after gemfibrozil.
Pharmacokinetic variables of repaglinide after a single oral dose of 0.25 mg of repaglinide in nine healthy volunteers, after pretreatment with 600 mg of gemfibrozil twice daily, when repaglinide was administered 1, 24, 48, or 96 h after the last gemfibrozil dose
Values are mean ± S.D.
Pharmacokinetic Variables of Parent Repaglinide.
Gemfibrozil increased the AUC0–∞ of repaglinide 7.6-fold [95% confidence interval (95% CI) 6.6- to 8.6-fold], 2.9-fold (95% CI 2.4- to 3.3-fold), and 1.4-fold (95% CI 1.3- to 1.6-fold) compared with the control phase (i.e., repaglinide without gemfibrozil) for the 1-, 24- and 48-h dosing intervals, respectively (P < 0.001) (Fig. 2; Table 2). When repaglinide was given 1 or 24 h after the last gemfibrozil dose, the Cmax of repaglinide was increased approximately 2.7-fold (95% CI 2.2- to 3.1-fold) and 1.9-fold (95% CI 1.6- to 2.2-fold), respectively (P < 0.001), and the t1/2 of repaglinide was prolonged from 1.6 to 3.2 h (95% CI 1.8- to 2.3-fold) and 1.8 h (95% CI 1.04- to 1.2-fold), respectively (P < 0.05) (Fig. 2; Table 2). However, there was no increase in the AUC0–∞ (95% CI 0.8- to 1.1-fold), Cmax (95% CI 0.9- to 1.3-fold), or t1/2 (95% CI 0.9- to 1.2-fold) of repaglinide when repaglinide was administered 96 h after the last gemfibrozil dose.
Pharmacokinetic Variables of Repaglinide Metabolites.
The Cmax and AUC0–3 h of M4 were decreased by approximately 90%, when repaglinide was taken 1 h after gemfibrozil administration (P < 0.001), but when the time interval was 24 h, only a 20 to 30% decrement in the Cmax of M4 was observed (P < 0.05) (Fig. 3; Table 2). In contrast, the AUC0-∞ of M1 was increased 4.9-, 1.8- and 1.3-fold (P < 0.05) for intervals between gemfibrozil and repaglinide administration of 1, 24, and 48 h. For M2, modest (<2-fold) increases in the AUC0–∞ values were observed in the 1- and 24-h interval phases. When repaglinide was administered 96 h after the last gemfibrozil dose, mainly nonsignificant changes in the pharmacokinetic variables of the metabolites were observed.
The metabolite/repaglinide AUC ratios of all metabolites were decreased for intervals between gemfibrozil and repaglinide administration of 1 or 24 h (P < 0.05) (Table 2). The decreases in the M1 to repaglinide and M2 to repaglinide AUC ratios were significant (P < 0.05) still when repaglinide was taken 48 h after gemfibrozil.
Pharmacodynamics.
The mean blood glucose concentrations after repaglinide administration were 0.4 to 0.5 mM lower when repaglinide was administered 1 h after gemfibrozil than when repaglinide was administered alone (P < 0.05) (Fig. 2; Table 3). In addition, the minimum blood glucose concentration was significantly decreased with the 1-h time interval compared with the control phase (P < 0.05), but with longer time intervals these changes were not significant.
Blood glucose levels after a single oral dose of 0.25 mg repaglinide in nine healthy volunteers after pretreatment with 600 mg of gemfibrozil twice daily, when repaglinide was administered 1, 24, 48, or 96 h after the last gemfibrozil dose
Values are mean ± S.D.
Gemfibrozil and Gemfibrozil 1-O-β-Glucuronide Pharmacokinetic Variables.
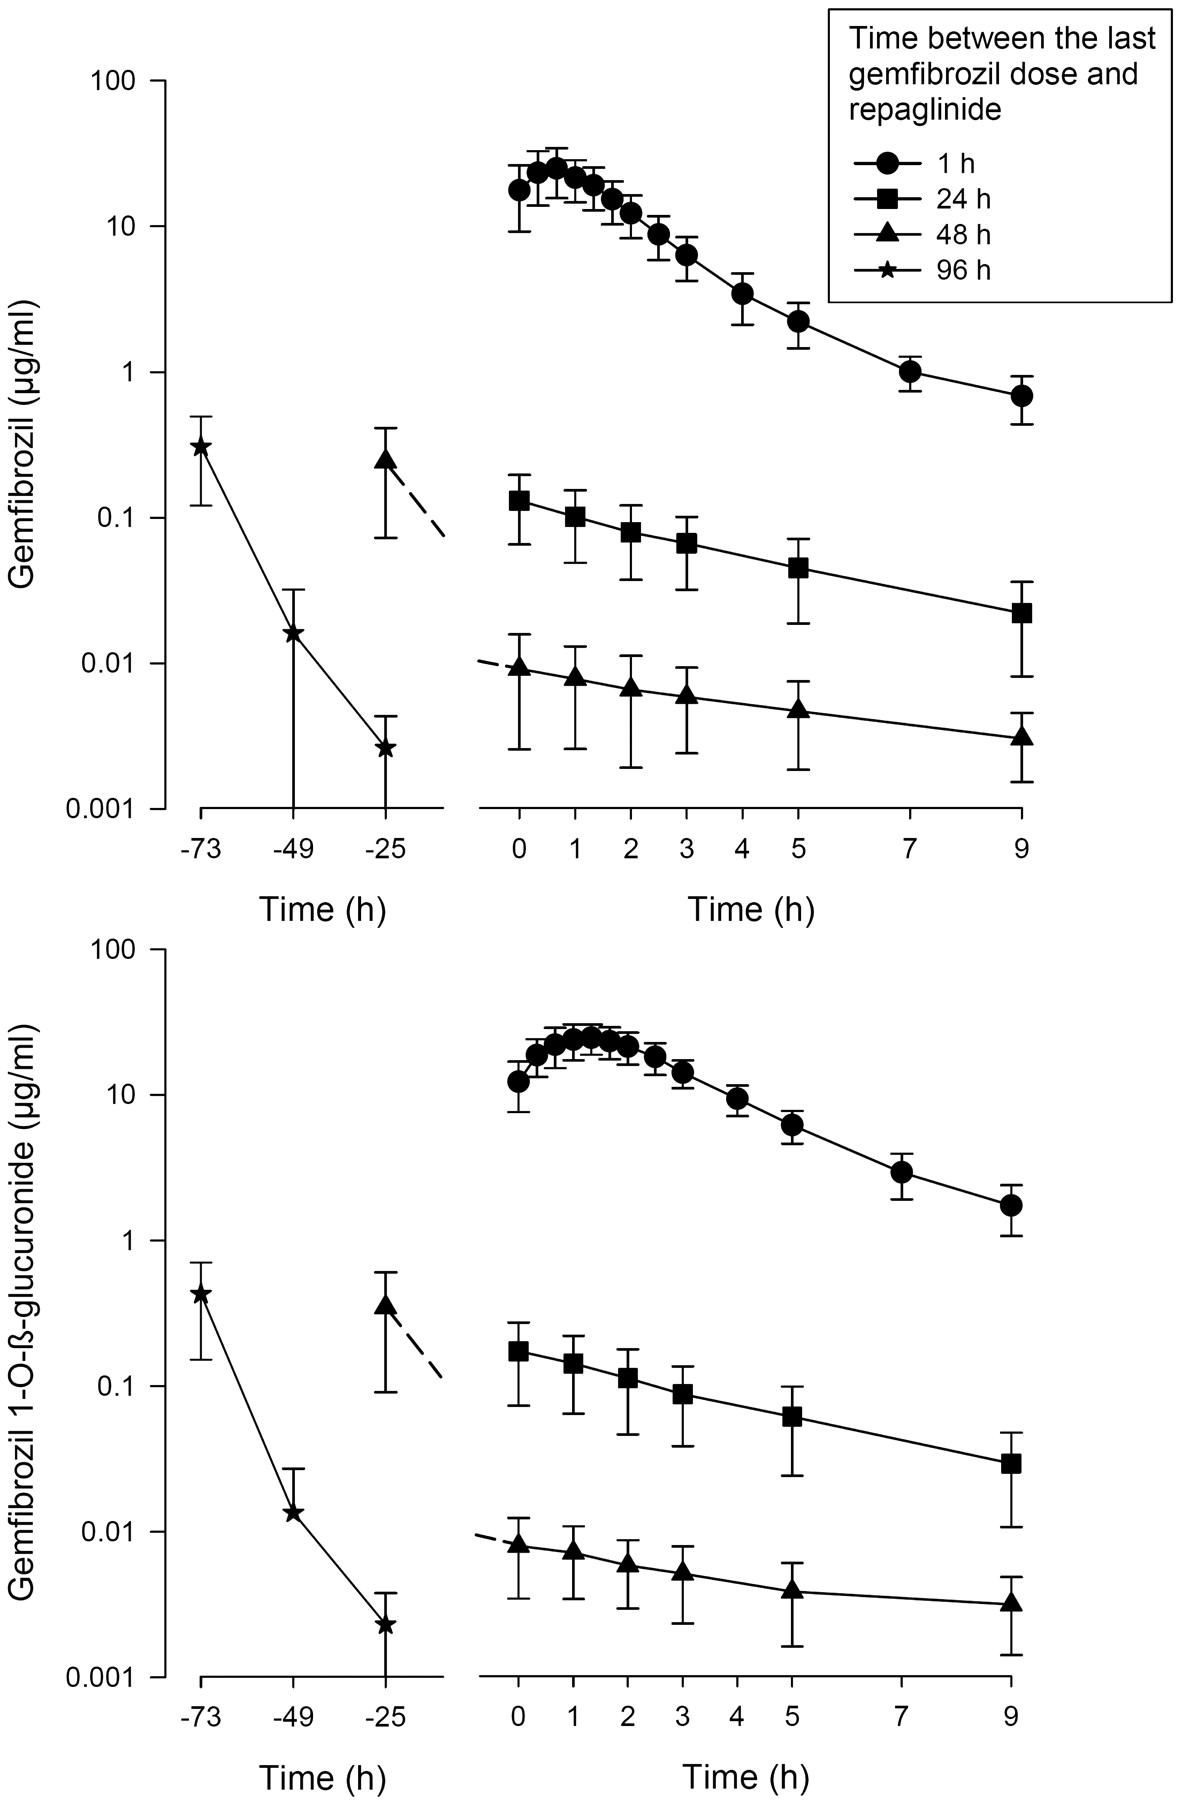
The AUC0–9 h (AUC during the 9-h period after repaglinide administration) values of gemfibrozil and gemfibrozil 1-O-β-glucuronide declined along with an increasing time from the last gemfibrozil dose (Fig. 4; Table 4). During the 24-, 48-, and 96-h interval phases, the C0 values (the concentration at the time of administration of repaglinide) of gemfibrozil and gemfibrozil 1-O-β-glucuronide were less than 1, 0.1, and 0.02% (below the lower limit of quantification) of the respective actual Cmax values during the 1-h interval phase. The calculated half-lives of gemfibrozil and gemfibrozil 1-O-β-glucuronide increased with an increasing time from gemfibrozil administration, consistent with multicompartmental pharmacokinetics.

Mean ± S.D. plasma concentrations of gemfibrozil and gemfibrozil 1-O-β-glucuronide in 9 healthy volunteers after the last dose of gemfibrozil, which was taken 1, 24, 48, or 96 h before time 0. Time 0 refers to the administration of repaglinide. ○, control phase (no pretreatment); ●, repaglinide 1 h after gemfibrozil; ■, repaglinide 24 h after gemfibrozil; ▴, repaglinide 48 h after gemfibrozil; ★, repaglinide 96 h after gemfibrozil.
Pharmacokinetic variables of gemfibrozil and gemfibrozil 1-O-β-glucuronide in nine healthy volunteers after the last dose of 600 mg of gemfibrozil, which was taken 1, 24, 48, or 96 h before time zero (i.e., administration of repaglinide)
Values are mean ± S.D., with the exception of tmax data, which are given as median and range.
Estimation of CYP2C8 Half-Life.
Based on comparison of our present and previous (Tornio et al., 2008) results (Fig. 5), the recovery of the oral clearance (CL/F) of repaglinide was slower during the first 12 h after the last gemfibrozil dose than after the first 12 h. Accordingly, the recovery of the CL/F of repaglinide could be described by a model assuming termination of the CYP2C8 inactivating process by 24 h after the last gemfibrozil dose, a constant rate of CYP2C8 enzyme production and a first-order process of enzyme degradation (Fig. 5). With use of this model, the half-life of CYP2C8 was estimated to average 21 h (Fig. 5) when all the data were pooled and 22 h (Table 1) when each subject was analyzed separately. In contrast, the relationships between the extent of interaction (repaglinide AUCinhibited/AUCcontrol) and the average concentrations (Cavg 0–9 h) of gemfibrozil and gemfibrozil 1-O-β-glucuronide could not be accurately described by a model assuming competitive inhibition of the metabolism of repaglinide by these compounds (data not shown). The model-based in vivo competitive inhibition constants were 0.020 μg/ml (0.080 μM) and 0.030 μg/ml (0.070 μM) for total plasma gemfibrozil and gemfibrozil 1-O-β-glucuronide, respectively.

Estimation of the t1/2 of CYP2C8 using the recovery of the CL/F of repaglinide in nine healthy subjects when repaglinide was administered 1, 24, 48, or 96 h after the last dose of gemfibrozil. The estimation was performed by nonlinear regression analysis (bold line) of the CL/F of repaglinide of all subjects from the 24-h interval time point onwards using the equation, CL/F(t) = CL/Frecovered − (FDCL24 · e−k(t−24 h)) · CL/Frecovered, where CL/Frecovered is the CL/F of repaglinide when CYP2C8 activity is fully recovered, FDCL24 is the fractional decrement in the CL/F when repaglinide is administered 24 h after the last dose of gemfibrozil, k is the first-order degradation rate constant of CYP2C8, and t is the time of repaglinide administration after the last dose of gemfibrozil. For control phase data (representing fully recovered basal CYP2C8 activity), t was set at 10,000 h, approximating infinity. Subjects homozygous for the SLCO1B1 c.521T>C polymorphism are indicated by dotted lines, heterozygotes by dashed lines and noncarriers by solid lines. For comparison, repaglinide CL/F data from our previous study (Tornio et al., 2008) are also included (small white diamonds).
Genotypes.
The CL/F values of repaglinide were lowest in the three subjects homozygous for the SLCO1B1 c.521T>C polymorphism (*5 and *15 haplotypes) and highest in three of the noncarriers of this polymorphism (Fig. 5). The recovery of CYP2C8 tended to be fastest in carriers of the SLCO1B1 c.521T>C and CYP2C8*3 polymorphisms (Table 1), but no statistical comparisons were performed because of the small sample size for genotype comparisons.
Discussion
The increases in the plasma concentrations and pharmacodynamic effects of repaglinide were greatest when repaglinide was administered 1 h after the last 600-mg dose of gemfibrozil. When repaglinide was taken 24 h after the last gemfibrozil dose, the total AUC of repaglinide was still increased approximately 3-fold compared with the control value, equivalent to an almost 70% decrement in oral clearance. Thus, a strong CYP2C8 inhibitory effect persisted even after gemfibrozil and gemfibrozil 1-O-β-glucuronide concentrations had decreased to less than 1% of their maximum. When repaglinide was taken 48 h after the last gemfibrozil dose, plasma gemfibrozil and its glucuronide concentrations were less than 0.1% of their Cmax, and the total AUC of repaglinide was increased by almost 40%. However, no inhibitory effect of gemfibrozil on repaglinide metabolism could be seen when the time interval was 96 h, i.e., the interval was sufficient to reach a time point when CYP2C8 inactivation had been abolished. This gave us a possibility to calculate, for the first time, the in vivo turnover half-life of CYP2C8, yielding an average estimate of approximately 22 h.
Reliable information concerning in vivo turnover half-lives of P450 enzymes is a prerequisite for accurate prediction of the extent and time course of drug interactions based on mechanism-based inhibition and induction (Mayhew et al., 2000; Obach et al., 2007; Venkatakrishnan and Obach, 2007; Venkatakrishnan et al., 2007; Yang et al., 2008; Grimm et al., 2009). Because the exact time course of P450 enzyme degradation in vivo in humans cannot be measured directly for ethical reasons, it is necessary to use indirect methods. Indirect methods are based either on characterization of the recovery of in vivo enzyme activity after enzyme induction or mechanism-based inactivation or on pharmacokinetic modeling of autoinduction (Yang et al., 2008). For CYP2C8, methods based on enzyme induction are not feasible, because known inducers of CYP2C8 such as rifampin (Niemi et al., 2004a) are nonselective, and most CYP2C8 substrates are partially metabolized by other enzymes, such as the highly inducible CYP3A4 (Backman et al., 1998). Therefore, we selected an approach based on recovery after mechanism-based inhibition of CYP2C8.
Repaglinide was selected as the probe substrate because of its sensitivity to CYP2C8 inhibition (Niemi et al., 2003, 2004b) and its short half-life, allowing for measurement of enzyme activity within a time frame sufficiently small to represent a single time point. Gemfibrozil was considered to be a suitable inhibitor, because clinically used gemfibrozil doses lead to strong, long-lasting mechanism-based inhibition of CYP2C8 (Backman et al., 2002; Niemi et al., 2003, 2004a, 2006; Shitara et al., 2004; Jaakkola et al., 2005; Ogilvie et al., 2006; Tornio et al., 2008; Baer et al., 2009), it has no clinically relevant inhibitory effect on CYP3A4, and it has a much shorter half-life than the expected CYP2C8 half-life.
A potential problem in our approach was that some degree of competitive OATP1B1 inhibition can occur after gemfibrozil intake (Shitara et al., 2004), as repaglinide is a substrate for this transporter (Niemi et al., 2005; Kalliokoski et al., 2008b). It is likely that the almost 8-fold increase in repaglinide AUC during the 1-h interval phase was partially due to competitive inhibition of OATP1B1 and CYP2C8. However, because of the short half-life of gemfibrozil and its glucuronide, their competitive inhibitory effects are short-lived. Accordingly, the CYP2C8 turnover half-life was estimated from the 24-h time point onward only, as the concentrations of both gemfibrozil and its glucuronide had already declined to less than 1% of their Cmax, making persistence of the CYP2C8 inactivation process and competitive inhibition of any enzymes and transporters highly unlikely after this time point. In fact, a simple single-enzyme/transporter competitive inhibition model fitted poorly with the present data and yielded in vivo competitive inhibition constants for the total plasma concentrations of gemfibrozil and its glucuronide that were at least 2 orders of magnitude lower than those documented for unbound gemfibrozil and its glucuronide against any enzyme or transporter in vitro (Wen et al., 2001; Shitara et al., 2004).
The estimation of CYP2C8 half-life could have been improved by adding a 72-h interval study phase. However, because there was only an approximately 30% decrement in repaglinide clearance in the 48-h interval phase, the improvement in the estimate would have been small. Accordingly, given the above considerations, the obtained mean (±S.D.) in vivo CYP2C8 turnover half-life of 22 ± 6 h is likely to represent an uncontaminated and relatively accurate estimate of the average value in a healthy population. Unlike with certain other P450 enzymes (Yang et al., 2008) our in vivo estimate is also in good agreement with the in vitro value estimated using liver slices, 23 h (range 8–41 h) (Renwick et al., 2000). Moreover, it seems that the in vivo half-life of CYP2C8 is shorter than that of other P450 enzymes. For CYP1A2, CYP2D6, CYP2E1, and CYP3A4, the other P450s with in vivo data, the in vivo half-life estimates have generally ranged from approximately 40 to 100 h (Yang et al., 2008; Grimm et al., 2009). Thus, our data imply that the activity of CYP2C8 can recover more rapidly after mechanism-based inhibition and induction than do the activities of other P450s.
In our study, the range of individual turnover half-lives was narrow, from 16 to 31 h, suggesting that the rate of CYP2C8 degradation is relatively constant across individuals. However, it should be noted that the interindividual variability of this parameter may be greater in patient populations, because the degradation of P450 enzymes is mediated by lysosomal and proteasomal systems that can be altered by disease states and other clinical factors (Lecker et al., 2006; Yang et al., 2008). Nevertheless, because the CYP2C8 turnover half-life is much longer than that of gemfibrozil or its glucuronide, it is evident that the individual turnover half-life mainly determines the rate of enzyme recovery after gemfibrozil discontinuation. This is also likely to apply to recovery after discontinuation of CYP2C8 inducers with a short half-life, such as rifampin (Niemi et al., 2004a).
Our results provide clinically significant information for cases in which drugs metabolized by CYP2C8 need to be started after discontinuation of treatment with gemfibrozil. A safe margin for avoiding interaction with this kind of drugs would be 3 to 4 days after the last gemfibrozil dose. On the other hand, if a CYP2C8 substrate drug has been used concomitantly with gemfibrozil, with an appropriate dose adjustment, a gradual dose increment of the substrate drug may be necessary during days 1 to 4 after gemfibrozil discontinuation. Considering both our present and previous (Tornio et al., 2008) results (Fig. 5), little CYP2C8 recovery occurs during the first 12 h after the last gemfibrozil dose, but within the next 12 h, the recovery becomes more rapid. Thus, for example, if the repaglinide dose has been adjusted to a sufficiently low level during gemfibrozil treatment, no dose adjustments are needed during the first day after gemfibrozil discontinuation, but it may be necessary to double or triple the repaglinide dose during the 2nd day and further increase the repaglinide dose during the 3rd and 4th days. It is reasonable to assume that similar dose changes may be required also for some other narrow therapeutic index CYP2C8 substrates, such as paclitaxel.
To conclude, gemfibrozil increased the AUC of repaglinide 3-fold even when repaglinide was taken 24 h after the last gemfibrozil dose, and the interaction persisted at least up to 48 h after gemfibrozil, whereas no inhibitory effect on repaglinide metabolism could be seen 96 h after gemfibrozil. Based on these data, the in vivo turnover half-life of CYP2C8 was estimated to average 22 h, i.e., less than that of most other P450 enzymes. This parameter estimate will be useful for in vitro-in vivo extrapolations of drug-drug interactions involving induction or mechanism-based inhibition of CYP2C8. The gradual CYP2C8 recovery to basal levels during the first 1 to 4 days after gemfibrozil discontinuation should be considered when one is planning CYP2C8-substrate dosing.
Acknowledgments.
We thank Eija Mäkinen-Pulli, Lisbet Partanen, Kerttu Mårtensson, and Jouko Laitila for skillful technical assistance.
Footnotes
This study was supported by the Helsinki University Central Hospital Research Fund; and the Sigrid Jusélius Foundation, Finland.
Article, publication date, and citation information can be found at http://dmd.aspetjournals.org.
doi:10.1124/dmd.109.029728
-
- P450
- cytochrome P450
- OATP
- organic anion transporting polypeptide
- AUC
- area under the concentration-time curve
- CV
- coefficient of variation
- Cmax
- peak concentration
- t1/2
- (elimination) half-life
- ke
- elimination rate constant
- CL/F
- oral clearance
- C0
- concentration at time 0
- tmax
- time to peak concentration
- FDCL
- fractional decrement in the oral clearance.
- Received July 30, 2009.
- Accepted September 21, 2009.
- Copyright © 2009 by The American Society for Pharmacology and Experimental Therapeutics


