


Abstract
The pharmacokinetics and metabolism of linagliptin (BI1356, 8-(3R-amino-piperidin-1-yl)-7-but-2-ynyl-3-methyl-1-(4-methyl-quinazolin-2-ylmethyl)-3,7-dihydro-purine-2,6-dione) were investigated in healthy volunteers. The 10- and 5-mg 14C-labeled drug was administered orally or intravenously, respectively. Fecal excretion was the dominant excretion pathway with 84.7% (p.o.) and 58.2% (i.v.) of the dose. Renal excretion accounted for 5.4% (p.o.) and 30.8% (i.v.) of the dose. Unchanged linagliptin was the most abundant radioactive species in all matrices investigated. The exposure (area under the curve 0–24 h) to the parent compound in plasma accounted for 191 nM · h (p.o.) and 356 nM · h (i.v.), respectively. The main metabolite 7-but-2-ynyl-8-(3S-hydroxy-piperidin-1-yl)-3-methyl-1-(4-methyl-quinazolin-2-ylmethyl)-3,7-dihydro-purine-2,6-dione (CD1790) was observed with >10% of parent compound systemic exposure after oral administration. The metabolite was identified as S-3-hydroxypiperidinly derivative of linagliptin. Experiments that included stable-labeled isotope techniques indicated that CD1790 was formed by a two-step mechanism via the ketone 7-but-2-yn-1-yl-3-methyl-1-[(4-methylquinazolin-2-yl)methyl]-8-(3-oxopiperidin-1-yl)-3,7-dihydro-1H-purine-2,6-dione (CD10604). The initial ketone formation was CYP3A4-dependent and rate-limiting for the overall reaction to CD1790. Aldo-keto reductases with minor contribution of carbonyl reductases were involved in the subsequent stereoselective reduction of CD10604 to CD1790. The antipodes of linagliptin and CD1790 were not observed with adequate enantioselective liquid chromatography-tandem mass spectrometry methods. Other minor metabolites were identified by mass spectrometry and NMR investigations. However, it was concluded that the metabolites of linagliptin only play a minor role in the overall disposition and elimination of linagliptin.
Type 2 diabetes mellitus (T2DM) accounts for 90 to 95% of all diabetes cases and its incidence is increasing (Wild et al., 2004). The high frequency of complications associated with the disease leads to a significant reduction in life expectancy. One relatively new therapeutic option is the inhibition of the enzyme dipeptidyl peptidase-4 (DPP-4), which is responsible for the rapid degradation of the incretin hormones glucagon-like peptide-1 (GLP-1) and glucose-dependent insulinotropic polypeptide. After food intake, both hormones augment the action of insulin (Holst and Gromada, 2004; Mari et al., 2005; Drucker and Nauck, 2006; Drucker, 2007). The plasma half-life of GLP-1 is limited to a few minutes because of its rapid proteolytic degradation by DPP-4 (Graefe-Mody et al., 2009). Inhibitors of DPP-4 prolong the half-life of GLP-1 and glucose-dependent insulinotropic polypeptide, which leads to increases in glucose-dependent insulin secretion, inhibition of endogenous glucose production, decreased blood glucose, and the induction of feelings of satiety (Drucker, 2002; Nauck et al., 2003; Holst and Gromada, 2004).
Linagliptin is a novel, orally active, highly specific, and potent inhibitor of DPP-4 that is currently in clinical development for the treatment of T2DM (Eckhardt et al., 2007; Fuchs et al., 2009b). Early clinical studies with linagliptin suggested a reduction in the glycated hemoglobin levels in patients with T2DM while maintaining a placebo-like safety and tolerability profile (Heise et al., 2009; Retlich et al., 2009). The pharmacokinetics of linagliptin were previously shown to be nonlinear due to target-mediated, concentration-dependent changes in binding to DPP-4 (Hüttner et al., 2008; Thomas et al., 2008a, b; Fuchs et al., 2009a; Heise et al., 2009).
We report here a series of in vivo and in vitro studies performed to further establish the pharmacokinetics and metabolism of linagliptin in humans after intravenous and oral administration.
Materials and Methods
Reference Compounds and Other Materials.
Labeled [14C]linagliptin was synthesized by the isotope chemistry laboratory of Boehringer Ingelheim Pharma GmbH and Co. KG (Ingelheim, Germany) with a specific radioactivity of 1.459 MBq/μmol (98.6% radiochemical purity). The 14C label was located at position 2 of the quinazolinyl moiety. For intravenous and oral administration, it was blended with nonlabeled linagliptin by using good manufacturing practice batches released for human use (98.5% purity). The specific radioactivity was 0.40 MBq/mg (i.v.) and 0.21 MBq/mg (p.o.), respectively. Nonradioactive linagliptin and reference compounds BI1355 (8-(3S-amino-piperidin-1-yl)-7-but-2-ynyl-3-methyl-1-(4-methyl-quinazolin-2-ylmethyl)-3,7-dihydro-purine-2, 6-dione), CD1790 (7-but-2-ynyl-8-(3S-hydroxy-piperidin-1-yl)-3-methyl-1-(4-methyl-quinazolin-2-ylmethyl)-3,7-dihydro-purine-2,6-dione), CD1789 (7-but-2- ynyl-8-(3R-hydroxy-piperidin-1-yl)-3-methyl-1-(4-methyl-quinazolin-2-ylmethyl)-3,7-dihydro-purine-2,6-dione), CD1750 (racemic mixture of CD1790 and CD1789), and CD10604 (7-but-2-yn-1-yl-3-methyl-1-[(4-methylquinazolin-2-yl)methyl]-8-(3-oxopiperidin-1-yl)-3,7-dihydro-1H-purine-2,6-dione) were synthesized and analyzed at Boehringer Ingelheim GmbH and Co. KG (Biberach, Germany). All other chemicals were of analytical grade or higher purity and were obtained from commercial suppliers.
In Vivo Pharmacokinetics and Disposition.
Subject/radiation protection.
Single-dose pharmacokinetics and disposition of radioactivity (including excretion mass balance, excretion pathways, and metabolism) of linagliptin and its inactive metabolite CD1790 were studied in 12 healthy male volunteers at PRA International (Zuidlaren, The Netherlands). The median age was 45.5 years (range, 30–60 years), the median weight accounted for 81.0 kg (range, 71–102 kg), and the median body mass index of the participants was 25.90 kg/m2 (range, 19.7–28.9 kg/m2). The whole-body radioactive dose was less than 1 mSV in all subjects. The study was approved by the Independent Ethics Committee, Medisch Ethische Toetsings Commissie van de Stichting Beoordeling Ethiek Bio-Medisch Onderzoek (Assen, The Netherlands) and conducted according to the principles of Good Clinical Practice and the Declaration of Helsinki (October 1996). Written informed consent was obtained from all participants.
Drug administration.
Subjects were randomized in a 1:1 ratio to receive either a single oral dose of 10 mg of [14C]linagliptin as solution in aqueous acetate buffer (20 ml) or a single intravenous infusion of 5 mg of [14C]linagliptin in 0.1% aqueous tartaric acid (13 ml) administered over a period of 1.5 h after an overnight fast (≥10 h).
Sample collection, storage, and shipping conditions.
Blood samples were collected via an indwelling cannula in a forearm vein or by venipuncture using K2EDTA as anticoagulant and were immediately placed on ice. After removal of an aliquot for measurement of total radioactivity in whole blood, plasma was separated by centrifugation (10 min, 3000g, 4°C). Remaining plasma was split into two aliquots for determination of total radioactivity and for quantification of linagliptin and CD1790. Blood sampling time points were as follows: oral administration: predose, 15, 30, 45 min, 1, 1.5, 2, 3, 4, 6, 8, 12, 24, 48, 72, 96, 120, 168, 216, and 264 h; intravenous administration: predose, 30, 60, 90, 95, 100, 105 min, 2, 2.25, 2.5, 3, 3.5, 4, 5, 6, 8, 12, 24, 48, 72, 96, 120, 168, 216, and 264 h. Blood sampling time points for metabolite identification in plasma after intravenous and oral dosing were as follows: 1.5, 3, and 6 h. Urine was collected in sampling containers containing citric acid before dosing and from 0 to 4, 4 to 8, 8 to 12, and 12 to 24 h after dosing, and thereafter over 24-h periods up to 5 days after dosing. Feces was collected in 24-h intervals up to 5 days after dosing. Samples were stored frozen at −20°C until analysis and were shipped on dry ice.
Measurement of total radioactivity.
Radioactivity in plasma, urine, and whole blood samples was analyzed by liquid scintillation counting on a Packard Tri-Carb 3100 TR liquid scintillation analyzer (PerkinElmer Life and Analytical Sciences, Downers Grove, IL) using a maximal counting time of 10 min. Whole blood samples were prepared by adding tissue solubilizer, EDTA, and hydrogen peroxide for decolorization in consecutive order with intermittent incubation steps at 45 and 60°C before counting.
Duplicate samples of fecal homogenates were combusted in a Packard 307 sample oxidizer (PerkinElmer Life and Analytical Sciences, Groningen, The Netherlands). The [14C]-labeled carbon dioxide released was trapped in 3-methoxypropylamine (CarboSorb-E, PerkinElmer Life and Analytical Sciences), and scintillation fluid (Perma Fluor E+; PerkinElmer Life and Analytical Sciences) was added. Radioactivity was determined by liquid scintillation counting as specified above.
Lower limits of quantification of total radioactivity were expressed as nanomole equivalent [14C]linagliptin per liter or kilogram of undiluted matrix. They accounted for 1.73 nM (plasma and urine, p.o.), 0.882 nM (plasma and urine, i.v.), 8.65 nM (whole blood, p.o.), and 4.41 nM (whole blood, i.v.). For undiluted feces, the lower limits of quantification were 6.92 and 3.53 nmol/kg (p.o. and i.v., respectively). However, due to the individual homogenization of each individual sample by using dilution factors of approximately 2 to 3, the lower limit of quantification (LOQ) is increased for each sample.
Analysis of linagliptin and CD1790.
Concentrations of linagliptin and CD1790 in plasma and urine samples were measured by a validated liquid chromatography-tandem mass spectrometry (LC-MS/MS) method with linagliptin and CD1750, the racemic mixture of CD1790 (S-enantiomer) and CD1789 (R-enantiomer) as reference compounds. The equimolar response of the two enantiomers was established in a separate study.
Samples were cleaned-up by automated solid-phase extraction in a 96-well plate format [Varian SPEC MP3 (C8/SCX), 15 mg/disc; Varian Deutschland GmbH, Darmstadt, Germany]. Chromatography was achieved by reversed-phase high-performance liquid chromatography (HPLC) (column: Luna phenyl-hexyl, 50 × 2.00 mm, 3 μ, and guard column; Phenomenex, Aschaffenburg, Germany) with gradient elution using 50 mM ammonium formate buffer, pH 4.0, and acetonitrile/methanol 80:20 (v/v) as solvents. 13C3-labeled linagliptin and 13C3-labeled CD1750 were used as internal standards. Compounds were quantified by LC-MS/MS (API 4000 with Analyst 1.2 software; Applied Biosystems, Darmstadt, Germany) using electrospray ionization in the positive ion mode monitoring the ion transitions m/z 473 to 420 for linagliptin and m/z 474 to 421 for CD1790 (dwell time: 0.250 s for linagliptin and CD1790 and 0.150 ms for internal standards). Results were corrected for 14C-labeled compounds by factors derived from formulation data. A volume of 150 μl of plasma and 40 of μl of urine was used; no interference of endogenous compounds was observed in blank samples.
In plasma, the calibration ranges for linagliptin and CD1790 after oral and intravenous treatment were linear from 0.104 to 104 nM and 0.109 to 109 nM and from 0.0520 to 52.0 nM and 0.0545 to 54.5 nM, respectively. Assay accuracy [deviation (%) and precision (coefficient of variation (%)] of quality control samples spiked at three concentrations was between −1.6 and 6.6% for linagliptin and between −4.1 and 7.6% for CD1790, respectively.
In urine, the calibration ranges for linagliptin and CD1790 after oral and intravenous treatment were linear from 1.04 to 1040 nM and 1.09 to 1090 nM and from 0.520 to 520 nM and 0.545 to 545 nM, respectively. Assay accuracy and precision of quality control samples spiked at three concentrations was between −9.0 and 6.7% for linagliptin and between −4.2 and 6.5% for CD1790, respectively.
Pharmacokinetic evaluation.
Pharmacokinetic parameters in plasma, urine, and feces were calculated using WinNonlin software (version 3.3; Pharsight Corporation, Mountain View, CA). The following parameters were determined: maximal plasma concentration (Cmax) and time to peak concentration (Tmax) were obtained by inspection of the plasma concentration data; area under the concentration-time curve from t = 0 to the respective time t1 using the linear trapezoidal method for ascending concentrations and the log trapezoidal method for descending concentrations, fraction excreted in urine and feces from t = 0 to the last interval with measurable drug/radioactivity concentration (Fe0-tz) as percentage of dose. For descriptive statistics of pharmacokinetic parameters, the geometric mean and geometric coefficient of variation were reported.
Sample preparation for metabolite investigation.
Plasma sampled at 1.5 h after intravenous dosing was analyzed for each subject individually. Due to the low concentration of radioactivity, plasma pools of the sampling times 1.5, 3, and 6 h after oral dosing and plasma pools of the sampling times 3 and 6 h after intravenous dosing were prepared for each subject individually and were analyzed. The plasma was processed by protein precipitation using 0.1% formic acid in acetonitrile (1:2, v/v). After storage overnight at −70°C, the supernatants were separated by centrifugation. The protein was washed twice with 0.1% formic acid in acetonitrile. Supernatants were combined and concentrated by lyophilization. Average extraction recoveries of plasma samples after intravenous and oral administration accounted for 97.7% (range, 95.2–101.2%) and 96.0% (range, 94.2–97.8%), respectively.
Sample material of excreta was not pooled over sampling times and was analyzed for each subject separately. Urine samples were processed by solid-phase extraction: SPE-cartridges (Oasis HLB; Waters, Eschborn, Germany) were preconditioned with 10 ml of formic acid (0.1%) in acetonitrile and equilibrated with 10 ml of aqueous formic acid (0.1%). Urine samples (40–500 ml) were applied onto the columns and rinsed with 10 ml of aqueous formic acid (0.1%). Absorbed material was eluted with 22 ml of formic acid (0.1%) in acetonitrile/water (1:1, v/v) and was concentrated by lyophilization. Mean extraction yields of urine samples after intravenous and oral administration accounted for 99.8% (range, 96.7–102.8%) and 97.9% (range, 94.8–106.0%), respectively.
Feces homogenates were processed by exhaustive extraction: samples (10–15 ml) were extracted eight times with 30 ml of formic acid (0.1%) in acetonitrile/water (1:1, v/v) and once with 10 ml of formic acid (0.1%) in acetonitrile/water (9:1, v/v). Extracts were combined and concentrated by lyophilization. The mean extraction yields were 86.3% (range, 69.5–95.9%) and 92.0% (range, 86.9–104.1%) after intravenous and oral administration, respectively.
Determination of nonextractable radioactivity in plasma.
Due to the low radioactivity and the limited amounts of sample material, plasma of all six subjects and at least of two sampling times were pooled as follows and were processed by protein precipitation as specified above: plasma (i.v.): 0.5 + 1 h, 1.5 + 1.58 + 1.67 + 1.75 h, 2 + 2.25 + 2.5 h, 3 + 3.5 + 4 h, 5 + 6 h, 8 + 12 h, 24 + 48 h, 72 + 96 + 120 h; plasma (p.o.): 0.5 + 0.75 h, 1 + 1.5 h, 2 + 3 h, 4 + 6 h, 8 + 12 h, 24 + 48 + 72 h.
Metabolite pattern analysis.
Metabolite pattern of sample extracts were analyzed by HPLC coupled to online (urine, feces) and offline (plasma) radioactivity detection. HPLC/online radioactivity detection systems consisted of autosamplers (LC PAL; CTC Analytics, Zwingen, Switzerland), HPLC pumps (model G1312A; Agilent Technologies, Böblingen, Germany), column heaters (model G1316A; Agilent Technologies), degassers (model G1379A; Agilent Technologies), and radioactivity detectors (LB 509 or LB 507B; Berthold Technologies, Bad Wildbad, Germany) equipped with solid-phase scintillation cells (YG 150 S4D). The systems were operated by Chromeleon software (version 6.60; Dionex, Idstein, Germany).
The HPLC/offline radioactivity detection system consisted of an autosampler (LC PAL), an HPLC pump (1525 μ; Waters, Milford, MA), a column heater (Jetstream 2 Plus; Waters), a UV-detector (model 2487; Waters), and a fraction collector (model 2757; Waters). The system was operated by MassLynx and FractionLynx softwares (both version 4.0; Waters). The postcolumn flow was sampled into 96-well plates, which were preconditioned with solid-phase scintillation material (Deepwell LumaPlates; PerkinElmer Life and Analytical Sciences, Zaventem, Belgium). The sampling frequency was 0.166 Hz. After evaporation of the solvent to dryness, the plates were analyzed by scintillation counting using a microplate counter (TopCount NXT; PerkinElmer Life and Analytical Sciences). Chromatograms were reconstructed by conversion of raw data (counts per fraction versus fraction number) into chromatographic data (counts per fraction versus retention time) and processed by MassLynx (version 4.0).
All samples were analyzed by reverse-phase HPLC using 150 × 4.0-mm HPLC columns and 10 × 4.0-mm guard columns (both YMC-ODS-AQ, S-5 μm; YMC Europe GmbH, Dinslaken, Germany). Metabolites were separated by a gradient of aqueous ammonium formate (0.02 M with 0.2% formic acid, eluent A) verses acetonitrile (eluent B) at a flow rate of 0.8 ml/min (gradient: 3% B at 0 min, 10% B at 5 min, 20% B at 45 min, 40% B at 59 min, 99% at 61 min). The limit of detection was set to a signal-to-noise ratio >2. The acceptance criteria for the linear detector response were as follows: regression coefficient: r2 > 0.99, inaccuracy <15% (lowest concentration of linear range: <20%) and imprecision <20%. These values were assessed by triplicate injections of a 14C-labeled reference compound at various concentrations. The validity of sample analysis was assessed with quality control samples, which were analyzed before and after each sample batch. Batches were considered valid when maximal deviation of peak areas of the quality control samples were <25%.
Elucidation of metabolite structures.
Aliquots of plasma, urine, and feces extracts were analyzed by electrospray ionization mass spectrometry in positive ion mode using a quadrupole orthogonal acceleration time-of-flight mass spectrometer (Waters, Manchester, UK) equipped with a combined Z-spray/lockspray interface. The instrument was coupled to the postcolumn flow of an HPLC/radioactivity detection system and gradient as specified above (see under Metabolite pattern analysis). The electrospray interface was operated with nitrogen as nebulizer and desolvation gas at flow rates of 20 l/h and 300 l/h, respectively, with a desolvation temperature of 250°C. The capillary and cone voltage was set to 3.0 kV and 60 V, respectively. The first quadrupole was operated at unit mass resolution. Collision-induced dissociation experiments were performed using collision energies of 10 to 30 eV with argon as collision gas at a pressure of 1.1 e-3 mbar. The time-of-flight analyzer was operated in V-mode optics at an average mass resolution of m/Δm = 10,000 (full width at half-maximal definition) with a pusher frequency of 16 kHz.
High-resolution mass spectra in “full scan” and “product ion scan” mode were acquired in the range of m/z 50 to 1000. Full-scan mass spectra were calibrated by using [(H3PO4)5+H]+, m/z 490.8923 of phosphoric acid (0.01%); product ion mass spectra were internally calibrated by known pseudomolecular [M+H]+ or fragment ions. Metabolite structures were elucidated by the detailed analysis of the fragmentation pattern in comparison with synthetic reference compounds.
Structures of CD1790 and M489(1) were identified by NMR spectroscopy after isolation: CD1790 was generated by incubation of linagliptin with human liver microsomes. Isolation was achieved by combined solid-phase extraction (Oasis HLB cartridges) and HPLC methods (columns: YMC Pro C18RS 150 × 4.6 mm, 5 μm and Sequant Hilic 150 × 4.6 mm, 3.5 μm) by using acetonitrile/water gradients.
M489(1) was isolated from bile of rabbits, sampled 1 h after oral administration of 25 mg/kg [14C]linagliptin. Isolation was achieved by combined solid-phase extraction (Oasis HLB cartridges) and HPLC methods (column: YMC Pro C18 RS, 150 × 4.6 mm, 5 μm) using acetonitrile/aqueous ammonium formate (0.02 M)/formic acid (0.2%) gradients and a final desalting procedure.
Isolated fractions of CD1790 and M489(1) were dried by phosphorus (V) oxide and dissolved in hexadeuterated dimethyl sulfoxide (DMSO-d6) for NMR analysis. NMR measurements (1H, 13C-BB, HH-COSY, HH-ROESY, HC-HSQC, and HC-HMBC experiments) were performed on a Bruker DRX600 NMR spectrometer (Bruker BioSpin GmbH, Rheinstetten, Germany) operated with the TOPSPIN software (version 1.3 PL6).
CD1790: 1H NMR (δ.[(ppm)]): 8.25 (1H, m), 7.91 (1H, m), 7.81 (1H, m), 7.68 (1H, m), 5.32 (2H, s), 4.93 (1H, d, J = 4.6 Hz, OH), 4.90 (1H, m), 4.87 (1H, m), 3.70 (1H, m), 3.68 (1H, m), 3.55 (1H, m), 3.40 (3H, s), 3.11 (1H, m), 2.94 (1H, dd, J = 12.2 + 8.4 Hz), 2.89 (3H, s), 1.90 (1H, m), 1.83 (1H, m), 1.77 (3H, t, J = 2.4 Hz), 1.60 (1H, m), 1.41 (1H, m).
13C NMR (δ.[ppm]): 168.8 qC, 160.9 qC, 153.1 qC, 150.9 qC, 149.0 qC, 147.6 qC, 134.0 CH, 127.8 CH, 127.1 CH, 125.7 CH, 122.4 qC, 81.1 qC, 73.8 qC, 64.7 CH, 56.0 CH2, 49.3 CH2, 45.5 CH2, 35.5 CH2, 32.5 CH2, 29.3 CH3, 22.5 CH2, 21.5 CH3, 3.0 CH3; 13C data were derived from 2D spectra (HSQC and HMBC).
M489(1): 1H NMR (δ.[ppm]): 8.25 (1H, m), 7.98 (3H, br., NH3+), 7.92 (1H, m), 7.79 (1H, m), 7.68 (1H, m), 5.33 (2H, s), 5.21 (1H, br., OH) 5.07 (1H, m), 5.02 (1H, m), 4.06 (2H, m), 3.72 (1H, m), 3.52 (1H, m), 3.44 (1H, m), 3.42 (3H, s), 3.20 (1H, m), 3.19 (1H, m), 2.88 (3H, s), 2.02 (1H, m), 1.90 (1H, m), 1.73 (1H, m), 1.62 (1H, m).
13C NMR (δ.[ppm]): 168.9 qC, 160.8 qC, 155.3 qC, 153.4 qC, 150.9 qC, 149.0 qC, 147.3 qC, 134.1 CH, 127.8 CH, 127.2 CH, 125.8 CH, 122.5 qC, 103.6 qC, 85 qC, 78 qC, 51.3 CH2, 50.1 CH2, 48.9 CH2, 46.1 CH, 45.6 CH2, 35.2 CH2, 29.5 CH3, 27.3 CH2, 21.8 CH2, 21.6 CH3.
Enantioselective analysis of linagliptin and CD1790 in human plasma.
Human plasma after a single oral dose of 600 mg of BI1356 was analyzed for linagliptin (R-enantiomer), BI1355 (S-enantiomer), CD1790 (S-enantiomer), and CD1789 (R-enantiomer). Plasma of the sampling times at 0.5, 0.75, 1.0, 1.5, 2.0, 3.0, 4.0, 6.0, and 8.0 h postdose of six volunteers was pooled to a total volume of 22.2 ml and processed by solid-phase extraction using an Oasis HLB cartridge as specified above. Combined eluates were concentrated by lyophilization. The residue was dissolved in methanol/ethanol (1:1) and transferred into vials for enantioselective LC-MS analysis of CD1790 and CD1789. An aliquot was further diluted 1:10 with methanol/ethanol (1:1) + triethyl amine (0.1%) and transferred into vials for enantioselective LC-MS analysis of linagliptin and BI1355.
The analysis was performed using a 4000 Q TRAP hybrid mass spectrometer (Applied Biosystems/MDS Sciex, Concord, Canada) equipped with an orthogonal Turbo VTM ion source operated in positive electrospray ionization mode coupled to an enantioselective chromatography using a Chiralpak IA 250 × 4.6-mm i.d., 5-μm column (Chiral Technologies Europe, Illkirch, France). For analysis of the linagliptin/BI1355, the mobile phase consisted of methanol/ethanol (1:1, v/v) + 0.1% tetraethyl amine. For analysis of the CD1790 and CD1789, the mobile phase consisted of methanol/ethanol (1:1, v/v) without triethyl amine. The flow rate was 700 μl/min with a column temperature of 30°C. Linagliptin and BI1355 were quantified by MS/MS detection of m/z 364 (C18H18N7O2+) generated by collision-induced dissociation of the pseudomolecular [M+H]+ m/z 473 (C25H29N8O2+); CD1790 and CD1789 were determined by using the MS/MS transition of the pseudomolecular [M+H]+ m/z 474 (C25H28N7O3+) to m/z 336 (C17H16N6O2+). Declustering potential, collision energy, and collision exit potential was 100 V, 51 eV, and 9 V, respectively.
Calibration standards were measured in human plasma for the assessment of assay linearity and sensitivity. Standard calibration curves were fitted with the Analyst 1.4.2 software (Applied Biosystems/MDS Sciex, Concord, Canada) using peak areas and the linear equation y = a + bx (weighting 1/×2) without internal standard. The enantiomeric excess (ee) was calculated from the respective relative concentrations of enantiomers CA and CB using the equation ee = [(CA − CB)/(CA + CB)] × 100%.
Calibration curves were linear in the range of 5 to 100,000 ng/ml (linagliptin, BI1355) and 1 to 1000 ng/ml (CD1789, CD1790) using blank human plasma spiked with reference compounds. The accuracy of calibration samples was in the range of 99.1 to 111.1% (linagliptin), 88.9 to 100.9% (BI1355), 89.2 to 107.1% (CD1789), and 87.6 to 107.9% (CD1790), respectively. No interference of endogenous compounds was observed with blank plasma. The LOQ for linagliptin/BI1355 and CD1789/CD1790 accounted for 0.23 and 0.05 ng/ml, respectively.
In Vitro Studies.
Human liver microsomes and cytosol. Human liver microsomes and human liver cytosol (pool of 50 donors of mixed gender) were obtained from XenoTech, LLC (Kansas City, KS) or prepared in house: liver tissue of 10 male and female donors was supplied by Tissue Transformation Technologies (Edison, NJ). The tissue was homogenized with ice-cold 0.1 M phosphate buffer, pH 7.4, containing 1.15% potassium chloride followed by differential ultracentrifugation. Cytosol was collected, and the 100,000-g pellet was resuspended in 20 mM Tris buffer (pH 7.6 at ambient temperature) containing 0.25 M saccharose and 5.4 mM EDTA. The suspension and the cytosolic fraction was divided into aliquots, shock-frozen in liquid nitrogen, and stored at −80°C. Information on cytochrome P450 (P450) enzyme activities was provided by the supplier or assessed using the test substrates phenacetin (1A), coumarin (2A6), S-mephenytoin (2B6 and 2C19), paclitaxel (2C8), tolbutamide (2C9), bufuralol (2D6), lauric acid (2E1 and 4A11), and nifedipine, midazolam, and testosterone (3A4).
Microsomes containing recombinant human liver P450 isoforms were obtained from BD Gentest (Woburn, MA) and delivered by Natutec (Frankfurt, Germany). These included microsomes from a B-lymphoblastoid cell line expressing CYP1A1, 1A2, 2A6, 2B6, 2C8, 2C9, 2C19, 2D6, 2E1, and 3A4 and from baculovirus insect cells expressing human CYP3A4 (Supersomes) and control microsomes from cells lacking the human liver P450 cDNA insert.
Human hepatocytes.
Hepatocytes of human donors were provided by the Human Tissue and Cell Research Foundation (Hepacult GmbH, Regensburg, Germany). Hepatocytes were prepared from surgical waste (surplus healthy liver tissue obtained during liver tumor surgery) using the collagenase perfusion technique (Le Cluyse et al., 2005). Cell density was adjusted to 1 × 10⁶ vital cells/ml. The medium for cell suspension was Dulbecco's modified Eagle's medium with 5% fetal bovine serum containing glucagon (7 ng/ml), insulin (5 μg/ml), and gentamicin (50 μg/ml).
Human whole blood and plasma.
Human blood and plasma were prepared from one male and two female healthy volunteers. Blood was collected in heparin-containing vials; plasma was prepared by centrifugation of whole blood (15 min, 4000g), and supernatants were pooled and stored at −20°C.
Incubation experiments.
Reaction mixtures consisted of 0.1 M Tris buffer (pH 7.4 at 37°C), 5 mM magnesium chloride, up to 1.0 mg/ml microsomal protein, up to 50 pmol P450/ml expressed P450 Supersomes or up to 0.5 mg/ml cytosolic protein, 1 mM NADPH, the test compound, and, when applicable, the inhibitor in a total volume of 200 μl. Incubations with human liver cytosol were performed in various buffer systems (Tris pH 7.4, phosphate pH 7.4, MES pH 5.5, and MES pH 6.5, each 0.1 M). Reactions were started by heating to 37°C. After up to 1.5 h, the reactions were terminated by heating to 80°C for 2 min followed by vortex mixing. After centrifugation at 4°C, the supernatants were analyzed by HPLC coupled to radioactivity detection. Incubations were performed at least in duplicate. Incubations with microsomes and cytosol were performed with and without 18O-labeled water. The concentrations of H218O accounted for 42.5% in incubations with linagliptin and 37.8% in incubations with CD10604. Incubations with whole blood were performed in 0.1 M Tris buffer, pH 7.4, for up to 60 min at 37°C.
HPLC of linagliptin and metabolites in incubates.
Analysis of in vitro samples was performed by HPLC coupled to radioactivity detection, which consisted of an autosampler (HTC PAL; CTC Analytics), two HPLC pumps (LC-10AD VP; Shimadzu, Duisburg, Germany), a column heater (TC-950; ACS, Macclesfield, UK), a system controller (SCL-10A VP; Shimadzu), and a degasser (DGU-14A; Shimadzu). The separation was monitored by radioactivity detection (flow scintillation analyzer 525 TR; PerkinElmer Life and Analytical Sciences, Rodgau, Germany) equipped with a liquid scintillation cell (100 μl). Chromatographic separation of metabolites was carried out on a Purospher Star RP 18e, 3 μm, 55 × 2.0-mm HPLC column and 10 × 2.0-mm guard column (Merck, Darmstadt, Germany). The mobile phase consisted of a gradient of aqueous formic acid (0.02 M, eluent A) versus acetonitrile (eluent B) at a flow rate of 0.4 ml/min and a column temperature of 50°C. Formation of CD1790 from CD10604 was monitored by using a LC-MS/MS system, which consisted of an autosampler (HTX PAL; CTC Analytics), a HPLC pump (HP1100 Capillary pump G1376A; Agilent Technologies), a column oven (MistraSwitch; MayLab, Wien, Austria), a degasser (model G1379A; Agilent Technologies), and a 4000 QTrap (Applied Biosystems/MDS Sciex). Chromatographic separation of metabolites was carried out on a YMC Pro C18, 5 μm, 50 × 2.1-mm HPLC column (YMC Europe GmbH). The mobile phase consisted of a gradient of aqueous formic acid (0.1%, eluent A) versus acetonitrile containing 0.1% formic acid (eluent B) at a flow rate of 0.4 ml/min and a column temperature of 40°C.
P450-dependent reactions.
Standard assays were used to measure the activities of P450 isoenzymes in human liver microsomes and to investigate the effect of linagliptin on the various test reactions. Activities of CYP1A1 and CYP1A2 were measured by phenacetin O-deethylation (Tassaneeyakul et al., 1993); CYP2A6 was measured by by coumarin 7-hydroxylation (Pelkonen et al., 2000); CYP2C19 and CYP2B6 were measured by S-mephenytoin 4′-hydroxylation (Wedlund and Wilkinson, 1996) and N-dealkylation (Heyn et al., 1996), respectively; CYP2C8 was measured by by paclitaxel 6α-hydroxylation (Cresteil et al., 1994); CYP2C9 was measured by tolbutamide hydroxylation (Ludwig et al., 1998); CYP2D6 was measured by bufuralol 1′-hydroxylation (Yamazaki et al., 1994); CYP2E1 and CYP4A11 were measured by lauric acid 11- and 12-hydroxylation, respectively (Clarke et al., 1994; Amet et al., 1995); and CYP3A was measured by nifedipine oxidation (Guengerich et al., 1986), testosterone 6β-hydroxylation (modified from the technique of Newton et al., 1995), and midazolam 1-hydroxylation (Gorski et al., 1994). All incubations were performed in duplicate. Enzyme activities were as follows: 220 pmol/min/mg protein phenacetin O-deethylation; 1895 pmol/min/mg protein coumarin 7-hydroxylation; 75.0 pmol/min/mg protein S-mephenytoin 4′-hydroxylation; 10.7 pmol/min/mg protein S-mephenytoin N-dealkylation; 321 pmol/min/mg protein paclitaxel 6α-hydroxylation; 567 pmol/min/mg protein tolbutamide hydroxylation; 188 pmol/min/mg protein bufuralol 1′-hydroxylation; 2335 and 1955 pmol/min/mg protein lauric acid 11- and 12-hydroxylation; 2290 pmol/min/mg protein nifedipine oxidation; 2718 pmol/min/mg protein testosterone 6β-hydroxylation; and 1407 pmol/min/mg protein midazolam 1-hydroxylation.
Data analysis.
Enzyme kinetic parameters and parameters of enzyme inhibition were calculated by nonlinear regression analysis using Xlfit software (IDBS, Guildford, UK), which was implemented in Microsoft Excel 2002.
Results
Pharmacokinetics and Disposition of Linagliptin.
After a single intravenous dose of 5 mg and a single oral dose of 10 mg of [14C]linagliptin, the parent compound was detectable in plasma of all subjects up to 264 h; concentrations of the major metabolite CD1790 declined below the LOQ beyond 48 h (Fig. 1, A and B).

A, geometric mean concentration-time profiles of linagliptin and CD1790 in plasma and [14C]linagliptin-Eq (= total radioactivity) in plasma and whole blood after intravenous infusion of 5 mg of [14C]linagliptin (top graph, linear scale with time axis reduced to 24 h; bottom graph, semilogarithmic scale). B, geometric mean concentration-time profiles of linagliptin and CD1790 in plasma and [14C]linagliptin-Eq in plasma and whole blood after oral administration of 10 mg of [14C]linagliptin (top graph, linear scale with time axis reduced to 24 h; bottom graph, semilogarithmic scale).
After intravenous administration, mean maximal concentrations of linagliptin and CD1790 accounted for 82.7 and 5.3 nM at 1.25 and 2.14 h postdose, respectively (Table 1). During the first 24 h, exposure of the metabolite CD1790 was less than 10% of parent compound systemic exposure. Mean maximal concentrations of total radioactivity in plasma and whole blood were 112.0 and 84.3 nmol · eq/l, both observed at 1.50 h postdose. The mean AUC0–264 of linagliptin was 66% of the AUC0–264 of radioactivity. Linagliptin showed a low total clearance with 150 ml/min and a long terminal half-life of 142 h in plasma. The half-life of CD1790 was determined to be 15.9 h (Table 1). This result is in line with previous observations showing that linagliptin but not CD1790 tightly bounded to the target receptor DPP-4, which leads to a long retention of linagliptin in the body (Fuchs et al., 2009a; Retlich et al., 2009).
Pharmacokinetic parameters of linagliptin in plasma, CD1790 in plasma, and total radioactivity in plasma and whole blood after intravenous infusion of 5 mg of [14C]linagliptin and oral administration of 10 mg of [14C]linagliptin
Results are presented as geometric means (gMeans).
After oral administration, the absorption of linagliptin was variable, which demonstrates a biphasic absorption profile. CD1790 in plasma was observed almost simultaneously with linagliptin. Mean maximal concentrations of linagliptin and CD1790 of 16.3 and 4.2 nM were observed at 2.75 and 2.26 h postdose, respectively (Table 1). During the first 24 h, exposure to CD1790 was 18% of the parent compound systemic exposure. Mean maximal concentrations of total radioactivity in plasma and whole blood were 31.0 and 23.6 nmol · eq/l observed at 1.75 and 1.50 h postdose, respectively, The mean AUC0–120 of linagliptin was 62% of the AUC0–264 of radioactivity. Linagliptin apparent total clearance was 374 ml/min, and the terminal half-life was 155 h in plasma. The half-life of CD1790 was determined to be 10.8 h (Table 1).
The ratio of total radioactivity of plasma to whole blood was 0.679 and 0.703 after intravenous and oral administration, respectively, indicating that most of the radioactivity was associated to plasma.
Excretion and Mass Balance in Urine and Feces.
After intravenous administration, the mean recovery of the administered dose was 89.0% (range, 87.2–91.6%), with 30.8% (range, 27.0–32.7%) excreted in urine and 58.2% (range, 55.5–62.6%) excreted in feces (Table 2). Linagliptin and CD1790 were quantified in urine of all subjects up to 120 and 24 h postdose, respectively. The renal excretion of linagliptin accounted for 21.2% of the dose.
Excretion of linagliptin, CD1790, and total radioactivity in urine and feces (both up to 120 h) after intravenous administration of 5 mg of [14C]linagliptin and oral administration of 10 mg of [14C]linagliptin
Results are presented as geometric means (gMeans).
After oral administration the mean recovery of the administered dose was 90.1% (range, 84.0–95.9%), with 5.4% (range, 1.3–11.6%) excreted in urine and 84.7% (range, 78.3–91.9%) excreted in feces. After 120 h, 2.4% of the dose was excreted as unchanged linagliptin in urine. Renal excretion of CD1790 was negligible with less than 0.1% of the dose after both oral and intravenous administration.
Structure Elucidation of Metabolites.
Metabolite structures were elucidated by high-resolution LC-MS with detailed analysis of fragmentation pathways of pseudomolecular [M+H]+-metabolite ions in comparison with mass spectrometry data of authentic reference compounds [linagliptin, CD1790, M489(1)]. Compositions of fragment ions were confirmed by exact mass data (Table 3).
LC-MS data of linagliptin and metabolites in plasma, urine, and feces after oral administration of 10 mg of [14C]linagliptin and intravenous infusion of 5 mg of [14C]linagliptin to healthy male volunteers
Compounds are listed in order of nominal [M + H]+ masses.
The fragmentation of the pseudomolecular ion [M+H]+ of the parent compound, m/z 473, was dominated by the loss of a butinyl radical (C4H5), m/z 420, followed by loss of ammonia, m/z 403. The subsequent degradation of the piperidinyl moiety resulted in m/z 375 (−C2H4), m/z 351 (−C4H4), and m/z 337 (−C5H6). Fragments with minor abundance were formed by direct loss of ammonia in combination with the nonradical elimination of C4H4 and degradation of the piperidinyl moiety (m/z 364, m/z 350). Cleavage of the methylene bridge to the quinazoline moiety resulted in m/z 158. The complementary ion after loss of C4H6 (m/z 263) and ammonia (m/z 246) were observed.
Pseudomolecular [M+H]+ ions of metabolites were subject to analog fragmentation reactions, which allowed the elucidation of metabolic changes in substructures of the parent compound. In addition, structures of metabolites with highest abundance in urine [M489(1)] and plasma (CD1790) were confirmed by NMR spectroscopy.
Metabolism of Linagliptin In Vivo.
The metabolism of linagliptin is presented in Fig. 2. Urine up to 48 h and feces up to 240 h were analyzed for metabolites covering 80.7% (i.v.) and 87.0% (oral) of excreted radioactivity. In addition, plasma sampled at 1.5, 3, and 6 h was investigated. Representative chromatograms are shown in the Figs. 3 and 4. Quantitative data after intravenous and oral administration of [14C]linagliptin are summarized in Tables 4 and 5, respectively.
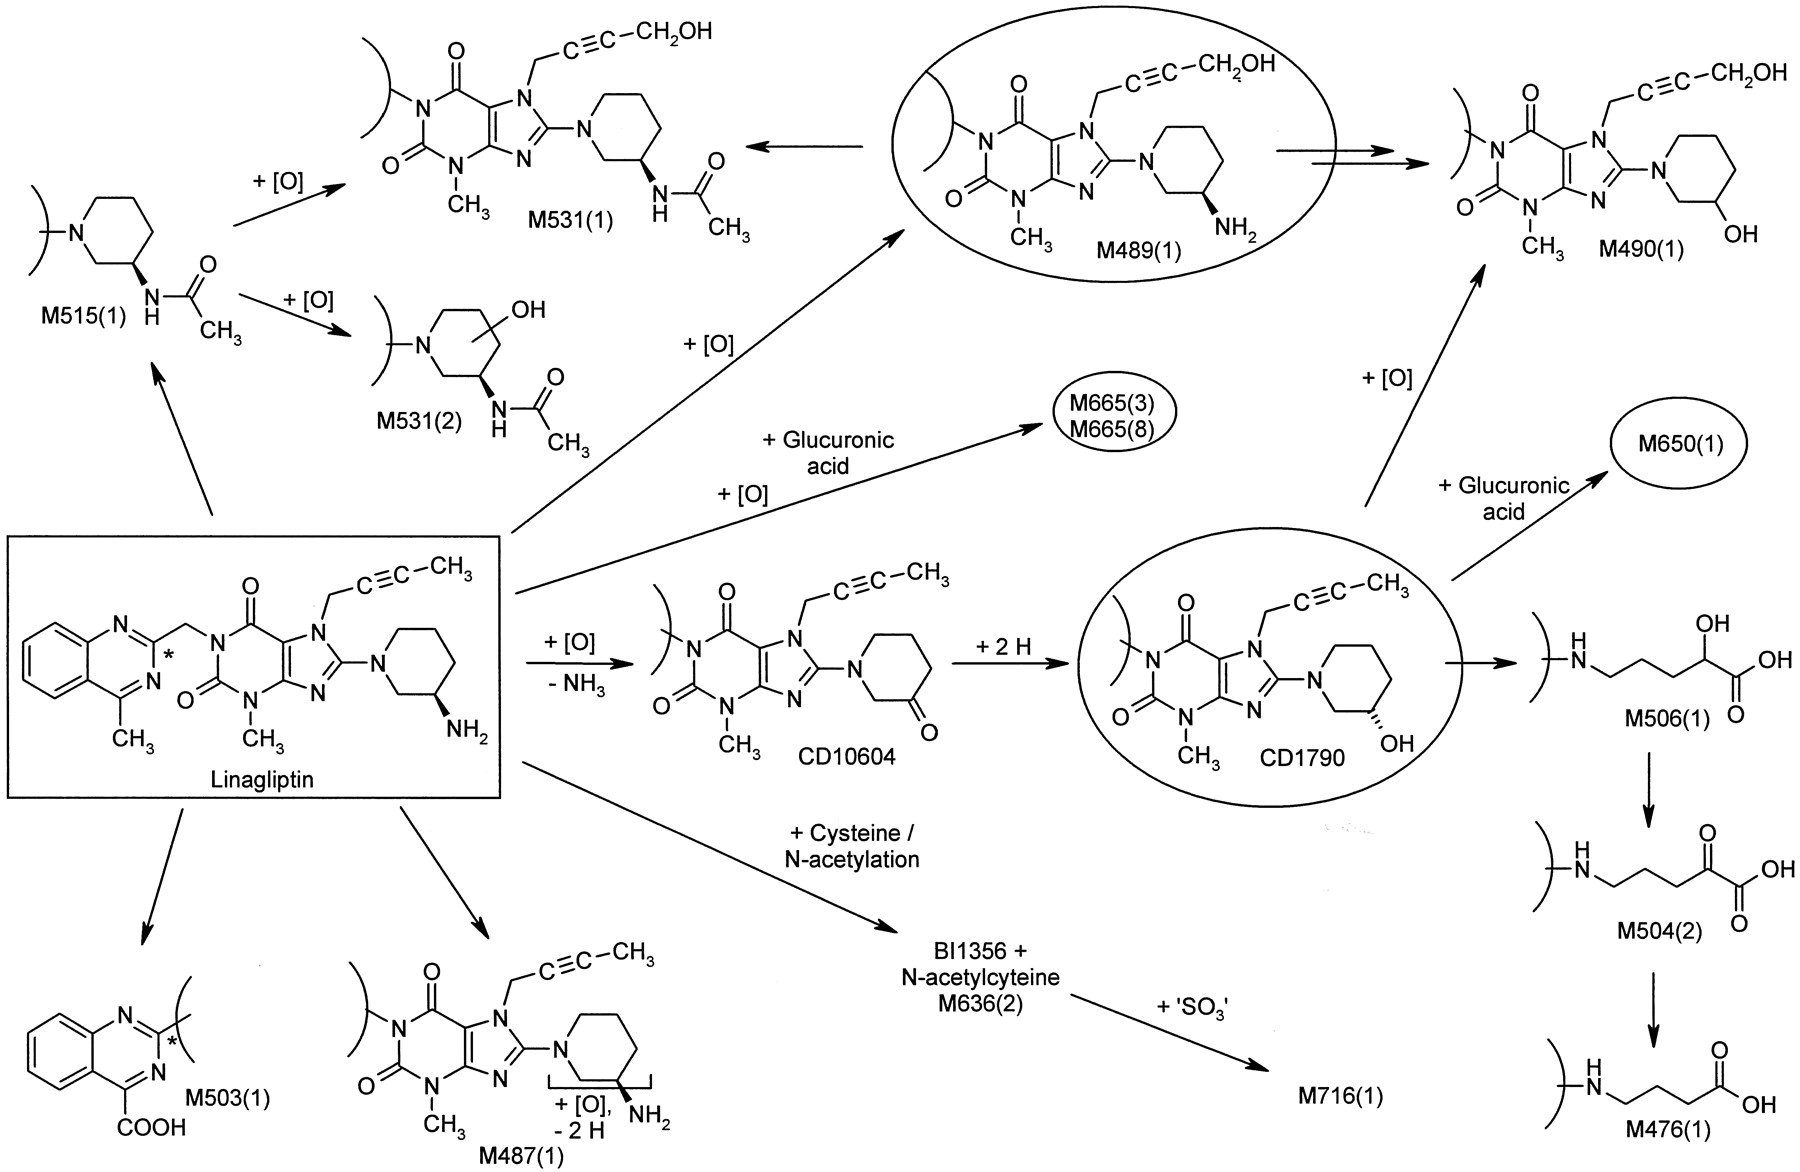
Metabolism pathways of linagliptin (rectangle) in humans after intravenous infusion of 5 mg of [14C]linagliptin or oral administration of 10 mg of [14C]linagliptin to healthy male volunteers. Structures of metabolites were characterized by mass spectrometry and NMR-spectroscopy. Metabolites in plasma are indicated by a circle. The position of the 14C radiolabel is indicated by an asterisk.

Representative chromatograms of plasma (A), urine (B), and feces (C) after oral administration of 10 mg of [14C]linagliptin to healthy male volunteers.

Representative chromatograms of plasma (A), urine (B), and feces (C) after intravenous infusion of 5 mg of [14C]linagliptin to healthy male volunteers.
Metabolite pattern in plasma, urine, and feces after a single intravenous dose of 5 mg (10.6 μmol) of [14C]linagliptin (arithmetic means of six individuals)
Metabolite pattern in plasma, urine, and feces after a single oral dose of 10 mg (21.2 μmol) of [14C]linagliptin (arithmetic means of six individuals)
Linagliptin was predominantly eliminated unchanged after both oral and intravenous administration. The sum of 78.0% of the oral dose and 61.1% of the intravenous dose was assigned to the parent compound in excreta corresponding to 89.7% (oral) and 75.7% (i.v.) of recovered radioactivity of the investigated sample material. M489(1) formed by hydroxylation of the methyl group of the butinyl side chain was observed as metabolite with highest abundance in excreta with 9.6% (i.v.) and 4.7% (oral) of the dose. Several minor metabolites accounted for ≤2.5% (i.v.) and ≤4.5% (oral) of the dose in excreta. They were formed by combinations of the following reactions: oxidation of the butinyl side chain and the piperidine moiety [M490(1), M478(1), M504(2)] followed by oxidative degradation of the piperidine moiety [M506(1), M476(1)], N-acetylation [M515(1), M531(1), M531(2)], and glucuronidation [M650(1), M665(3) M665(8)]. The oxidation of the methyl group at position 4 of the quinazoline moiety resulted in the corresponding carboxylic acid derivative M503(1). A cysteine adduct [M636(2)] and its sulfate conjugate [M716(1)] were additionally observed with 0.1% of the dose after intravenous administration in urine.
In plasma after oral administration only CD1790 accounted for more than 10% of total drug-related compounds (16.9%). The formation of CD1790 by a two-step mechanism via the ketone CD10604 was investigated in detail by in vitro investigations (see below).
The potential chiral inversion of linagliptin to BI1355 and the stereoselectivity of the formation of CD1790 were investigated in human plasma samples after a single oral dose of 600 mg of linagliptin by enantioselective LC-MS/MS analysis. Here, only the parent compound with R-configuration and the metabolite CD1790 with S-configuration were identified. The antipodes BI1355 and CD1789 were not detectable. With mean concentrations of linagliptin and CD1790 of 1736 ng/ml and 110 ng/ml and the quantification limits of 0.23 ng/ml and 0.05 ng/ml, the plasma concentrations of linagliptin and CD1790 were at least 7500-fold and 2300-fold higher than the concentration of the antipodes. Therefore, the enantiomeric excess for both linagliptin and CD1790 accounted for >99.9%. The results demonstrate that there was negligible chiral inversion of linagliptin in vivo in humans, if present it all, and that the formation of the corresponding S-configured alcohol CD1790 was highly stereoselective.
Extraction yields of plasma dedicated for metabolite investigations (1.5, 3, and 6 h) were in the range of 94.2 to 101.2% of sample radioactivity and were considered to be complete. Additional investigations of plasma samples revealed only very low amounts of nonextractable radioactivity: up to 9.4% of the sample radioactivity after intravenous dosing and 14.1% of the sample radioactivity after oral dosing were observed in pooled plasma at the late sampling times (>24 h). Based on total radioactivity, maximal concentrations of 4.1 nM at 1.5 to 1.75 h after intravenous administration and 1.9 nM at 2 to 3 h after oral administration were calculated. The amounts and concentrations were exceedingly low and were considered to be negligible.
In Vitro Studies.
The turnover of [14C]linagliptin (50 μM) with human liver microsomes and human hepatocytes in the presence of NADPH was low. CD1790, which was identified as a major metabolite in vivo, accounted for 2 to 3% of total radioactivity. Others accounted for <2% of total radioactivity or were close to background radioactivity.
Ketoconazole (5 μM) completely inhibited metabolite formation, indicating the involvement of CYP3A4. Other inhibitors (quinidine, sulfaphenazole, and furafylline) had no effect. When linagliptin was incubated with recombinant human P450 enzymes, the only enzyme that was active in metabolizing linagliptin was CYP3A4.
Linagliptin weakly inhibited CYP3A4 activity in human liver microsomes in a competitive manner, with an inhibition constant (Ki) of 115 μM. In addition, linagliptin was found to be a poor to moderate mechanism-based inhibitor of CYP3A4. KI and the maximal rate of enzyme inactivation (kinact) accounted for 1.75 μM and 0.041 min−1, respectively, of testosterone 6β-hydroxylation by CYP3A4 Supersomes.
Incubations of CD10604 with human liver microsomes and human liver cytosol demonstrated the preferential contribution of cytosolic enzymes in the formation of CD1790. The formation of CD1790 was higher by a factor of 2 to 5 in cytosol compared with human liver microsomes, indicating the involvement of aldo-keto reductase (AKR) enzymes or carbonyl reductases (CR) (Rosemond and Walsh, 2004). Maximal turnover rates were achieved at pH 5.5. In human liver cytosol, the ketone-reducing activity was linear with respect to time and protein concentration for up to 45 min and 0.5 mg of protein/ml. Enzyme kinetic investigations resulted in Km and Vmax values of 12.6 μM and 1138 pmol/min/mg protein, respectively (Fig. 5). The reducing activity of human liver microsomes could not be removed completely by repeated washing/centrifugation procedures.

Michaelis-Menten kinetics (top panel) and Eadie-Hofstee plot (bottom panel) of CD1790 formation by human liver cytosol. CD10604 was incubated with human liver cytosol (0.1 mg protein/ml) in the presence of NADPH for 20 min (mean values of two experiments, Km = 12.6 μM, Vmax = 1138 pmol/min/mg protein).
CD1790 formation was inhibited by phenolphthalein, flufenamic acid, medroxyprogesterone acetate, and dexamethasone, indicating an involvement of aldo-keto reductase enzymes (Table 6). Rutin and quercitrin had no inhibitory effect. Menadione inhibited CD1790 formation only at a high concentration of 100 μM. Weak inhibition was also observed by ethanol at a concentration of 5%.
Inhibition of CD10604 reduction in human liver cytosol
In additional, the ketone-reducing activity of human whole blood and human plasma was investigated. Twenty-three percent of CD10604 was converted to CD1790 in blood within 1 h, whereas no turnover was observed in human plasma.
Incubations with microsomes and cytosol in 18O-labeled water demonstrated the virtually complete incorporation (>96%) of oxygen into CD1790, which was derived from water, independently of the starting material linagliptin or the ketone CD10604. Further investigations with CD10604 revealed the instantaneous nonenzymatic equilibrium with its corresponding geminal diol as reason for a complete exchange of 16O by 18O. The 16O/18O-isotope pattern of the ketone mirrors the actual H216O/H218O ratio of the medium and could only be fixed when enzymatically converted to the alcohol CD1790.
Discussion
In vivo and in vitro studies were performed to investigate the absorption, metabolism, and excretion pathways of linagliptin after both oral and intravenous administration of [14C]-labeled linagliptin to healthy male volunteers.
Total recovery of radioactivity accounted for 90.1 (oral) and 89.0% (i.v.) of the dose, respectively. The majority of the recovered dose was eliminated via the feces with 84.7 (oral) and 58.2% (i.v.) of the dose.
The metabolism of linagliptin was less pronounced. After oral and intravenous administration, the parent compound was the most abundant radioactive species in all matrices investigated. In urine and feces, 90 (oral) and 76% (i.v.) of the recovered dose was assigned to unchanged linagliptin. In plasma, only the metabolite CD1790 (details: see below) accounted for >10% of total drug-related compounds. The metabolite M489(1) formed by hydroxylation of the methyl group of the butinyl side chain was identified as metabolite, with the highest abundance in excreta (9.6% i.v., 4.7% oral). Several minor metabolites were observed. They were formed by oxidation of the butinyl side chain, oxidation and oxidative degradation of the piperidine moiety, N-acetylation, glucuronidation, and cysteine adduct formation followed by sulfation.
On the basis of area under the curve (AUC) data, 62 to 71% of total circulating drug-related compounds were attributed to linagliptin and CD1790. CD1790 accounted for 18 (oral) and 10% (i.v.) of the AUC(0–24 h) of parent compound.
The difference in total circulating radioactivity was associated with the contribution of minor metabolites (as reported) and may be attributed to a divergence of the analytical methods, liquid scintillation counting, and HPLC-MS/MS. On the basis of the complete recovery of radioactivity during sample preparation and only negligible amounts of nonextractable radioactivity of plasma samples, the contribution of additional metabolites was excluded.
In vitro studies identified linagliptin as a substrate for CYP3A4. Due to the low amount of linagliptin metabolized by CYP3A4, changes in exposure to linagliptin by inhibition or induction of P450-dependent pathways by concomitantly administered drugs were considered unlikely. In addition, linagliptin was identified as a weak competitive and a moderate to poor mechanism-based inhibitor of CYP3A4. The inhibition potential of the mechanism-based inhibition of CYP3A4 was estimated according to Obach et al., 2007 and resulted in a <2 fold fractional decrease of intrinsic clearance of CYP3A4-dependent pathways of comedicated drugs. Therefore, the potential of linagliptin for the inhibition of drugs metabolized by P450 is likely to be low.
The metabolite CD1790, which was not active as an inhibitor of DPP-4, accounted for >10% of total drug systemic exposure. CD1790 was identified as S-3-hydroxy piperidinyl derivative of linagliptin with R-configuration at the chiral aminopiperidine moiety. Linagliptin itself was not subject to racemization. A two-step mechanism was proposed for the formation of CD1790: in the first step, the secondary amine of linagliptin was converted by oxidative desamination to the corresponding ketone CD10604. This step was rate-limiting and CYP3A4-dependent. Several mechanisms via the hemiaminal, imine, and/or hydroxylamine and oxime can be considered. All pathways resulted in the formation of the ketone, with loss of the chiral center at C-3 of the piperidinyl moiety. Subsequently, CD1790 was formed by reduction of CD10604, with high stereoselectivity. The optical antipode was not observed. The very low concentrations of the ketone in in vivo sample material indicated a very effective overall metabolic transformation of the parent drug to the alcohol CD1790.
Stereoselective carbonyl-reducing enzymes with high capacity, including alcohol dehydrogenases, aldo-keto reductases, short-chain dehydrogenases/reductases, and quinone reductases, are well known (Rosemond and Walsh 2004; Testa and Caldwell, 2004). Based on a limited number of examples, ketone reduction generates alcohols of S-configuration more frequently than R-configuration due to the hydride transfer mechanism to the prochiral carbonyl group.
Isotope experiments on the formation of CD1790 by incubations of both linagliptin and CD10604 in 18O-labeled water showed a virtually complete incorporation of oxygen, which was derived from water. The oxygen was incorporated into the intermediate ketone, which was shown to be in instantaneous nonenzymatic equilibrium with its geminal diol. The results and proposed mechanisms were in line with data from literature on the oxidative deamination of alicyclic primary amines (Parli and McMahon, 1973; Kurebayashi et al., 1982, 1988).
Incubations of CD10604 with human liver microsomes and human liver cytosol demonstrated the preferential contribution of cytosolic AKR enzymes or CR (Rosemond and Walsh, 2004). The pronounced inhibition of ketone reduction by potent inhibitors of AKRs, including flufenamic acid (AKR 1C2), phenolphthalein (AKR 1C1, 1C2, 1C4), dexamethasone (AKR 1C4), and medroxyprogesterone acetate (AKR 1C4) (Hara et al., 1990; Deyashiki et al., 1992; Atalla et al., 2000), and the weak inhibition by inhibitors of CRs [quercitrin, rutin, and menadione (Atalla et al., 2000; Iffert et al., 2000)] suggested the predominant role of AKR enzymes in the reduction of CD10604. However, a weak contribution of CR could not be excluded. The absence of commercially available AKRs and the lack of specific inhibitors did not allow a further discrimination of individual AKR isoforms.
Conversion of CD10604 under formation of CD1790 was also observed in human blood but not in human plasma. mRNA of members of the AKR superfamily has been detected in many tissues, such as heart, kidney, muscle, and peripheral blood lymphocytes (Nishizawa et al., 2000). This effect may indicate that liver is not the only site of CD10604 reduction.
Carbonyl reduction as a major metabolic clearance route can generally be viewed as a favorable property, from a drug interaction standpoint (Rosemond and Walsh, 2004). To our knowledge, no clinically relevant drug-drug interactions have been reported involving carbonyl reduction pathways.
In conclusion, the studies demonstrated that metabolism only contributes in a minor way to the overall disposition and elimination of linagliptin in humans. Linagliptin was mainly eliminated unchanged via feces. Renal excretion was low. In addition to linagliptin, CD1790, which was pharmacologically inactive, was identified as a major circulating metabolite, with >10% of total drug systemic exposure after oral administration. CD1790 was formed via the corresponding ketone by oxidative desamination followed by stereoselective reduction predominantly by cytosolic aldo-keto reductases. In vitro studies showed that the P450 system plays a little part in the metabolism of linagliptin, and hence at therapeutic doses linagliptin is likely to have weak potential for clinically relevant interactions with drugs metabolized by this system.
Acknowledgments.
We thank R. Laux, A. Grimminger, T. Link, M. Schuster, M. Schmidtke, R. Beilmann, and T. Sauter for excellent technical work; R. Kiesling for preparation of the 14C-labeled drug and labeled reference standards; and U.-J. Ries and W. Pfrengle for synthesis of synthetic reference compounds.
Footnotes
Article, publication date, and citation information can be found at http://dmd.aspetjournals.org.
doi:10.1124/dmd.109.031476.
-
- T2DM
- type 2 diabetes mellitus
- DPP-4
- dipeptidyl peptidase-4
- GLP-1
- glucagon-like peptide-1
- BI1355
- 8-(3S-amino-piperidin-1-yl)-7-but-2-ynyl-3-methyl-1-(4-methyl-quinazolin-2-ylmethyl)-3,7-dihydro-purine-2,6-dione
- CD1790
- 7-but-2-ynyl-8-(3S-hydroxy-piperidin-1-yl)-3-methyl-1-(4-methyl-quinazolin-2-ylmethyl)-3,7-dihydro-purine-2,6-dione
- CD1789
- 7-but-2-ynyl-8-(3R-hydroxy-piperidin-1-yl)-3-methyl-1-(4-methyl-quinazolin-2-ylmethyl)-3,7-dihydro-purine-2,6-dione
- CD10604
- 7-but-2-yn-1-yl-3-methyl-1-[(4-methylquinazolin-2-yl)methyl]-8-(3-oxopiperidin-1-yl)-3, 7-dihydro-1H-purine-2,6-dione
- LOQ
- lower limit of quantification
- LC-MS/MS
- liquid chromatography-tandem mass spectrometry
- HPLC
- high-performance liquid chromatography
- LC-MS
- liquid chromatography coupled to mass spectrometry
- P450
- cytochrome P450
- AKR
- aldo-keto reductase
- CR
- carbonyl reductases
- BI1356
- 8-(3R-amino-piperidin-1-yl)-7-but-2-ynyl-3-methyl-1-(4-methyl-quinazolin-2-ylmethyl)-3,7-dihydro-purine-2,6-dione
- AUC
- area under the curve.
- Received December 1, 2009.
- Accepted January 19, 2010.
- Copyright © 2010 by The American Society for Pharmacology and Experimental Therapeutics


