


Abstract
A fluorescent quinazoline derivative was shown to retain high affinity for, and act as a competitive antagonist at, alpha-1 adrenoceptors. This allowed it to be used in live cells to localize receptors and to quantify receptor binding characteristics. The technique was demonstrated and validated on fibrobasts transfected with a recombinant alpha-1d adrenoceptor. Using confocal laser scanning microscopy and image analysis methods both diffuse and clustered binding sites were found: their binding characteristics were assessed and found comparable to radioligand binding on membrane preparations. This approach should have widespread applicability in nonradioactive assays determining the location, quantity and binding properties of receptors and other biological molecules on live tissue.
We have used a fluorescent antagonist ligand on living preparations to describe the subcellular localization of alpha-1d adrenoceptors and have used image analysis to study the ligand binding characteristics of subcellular populations of receptors.
Cell surface G-protein-coupled receptors are notoriously difficult to localize accurately, even in fixed tissue, due to the nonspecificity of antibodies, in turn due to the high degree of conservation of sequence, and to the inherent low resolution of autoradiography. In live cells these approaches are fundamentally unrealistic. However, high affinity fluorescent ligands based on “antagonist” drugs/ligands could be used in a manner analogous to radioligands, but with much higher spatial resolution and in real-time on live tissue, if their concentration can be measured photometrically.
For validation against radioligand-based knowledge the fluorescently labeled compounds can be tested vs. radioligands in standard radioligand competition binding experiments (McGrath et al., 1996). The fluorescent compound can then be substituted for radioligands in the conventional manner (i.e.,bound-fluorescence measured postwash) and binding quantified photometrically.
Additional advantages lie in localization from the microscope image. Two main advantages are: first, quantitative ligand binding on the cellular level allows ligand binding in particular cell types in heterogeneous tissue; second, at the subcellular level, assessment of binding characteristics of receptors in different domains becomes a possibility in live cells.
Furthermore an extra advantage emerged in practice: with the ligand used in our study there was little fluorescence from the compound in solution; consequently the detected fluorescence was entirely due to the ligand-receptor complex and was, in effect, a report of the concentration of the ligand-receptor complex.
The fluorescent ligand-receptor complex can be studied particularly effectively with confocal microscopy. This allows localization of the receptive site within a cell, tissue or organ giving much higher spatial resolution than autoradiography and offers high resolution and quantitative analysis in three-dimensions. Furthermore, temporal resolution is attainable: binding can be followed in real time in live tissue with the consequent advantages of studying the kinetic properties of the receptors and their relationship to cellular activation processes.
Previously, the potential applicability of fluorescent ligands has been proven for several receptor types but only as a means of nonquantitative localization (Petty and Frances, 1986; Anderson and Cohen, 1974; Faure et al., 1994). This has invariably involved exposure to a high concentration of ligand, a postwash technique akin to radioligand binding, followed by still photography, providing essentially an outcome similar to autoradiography but with higher resolution.
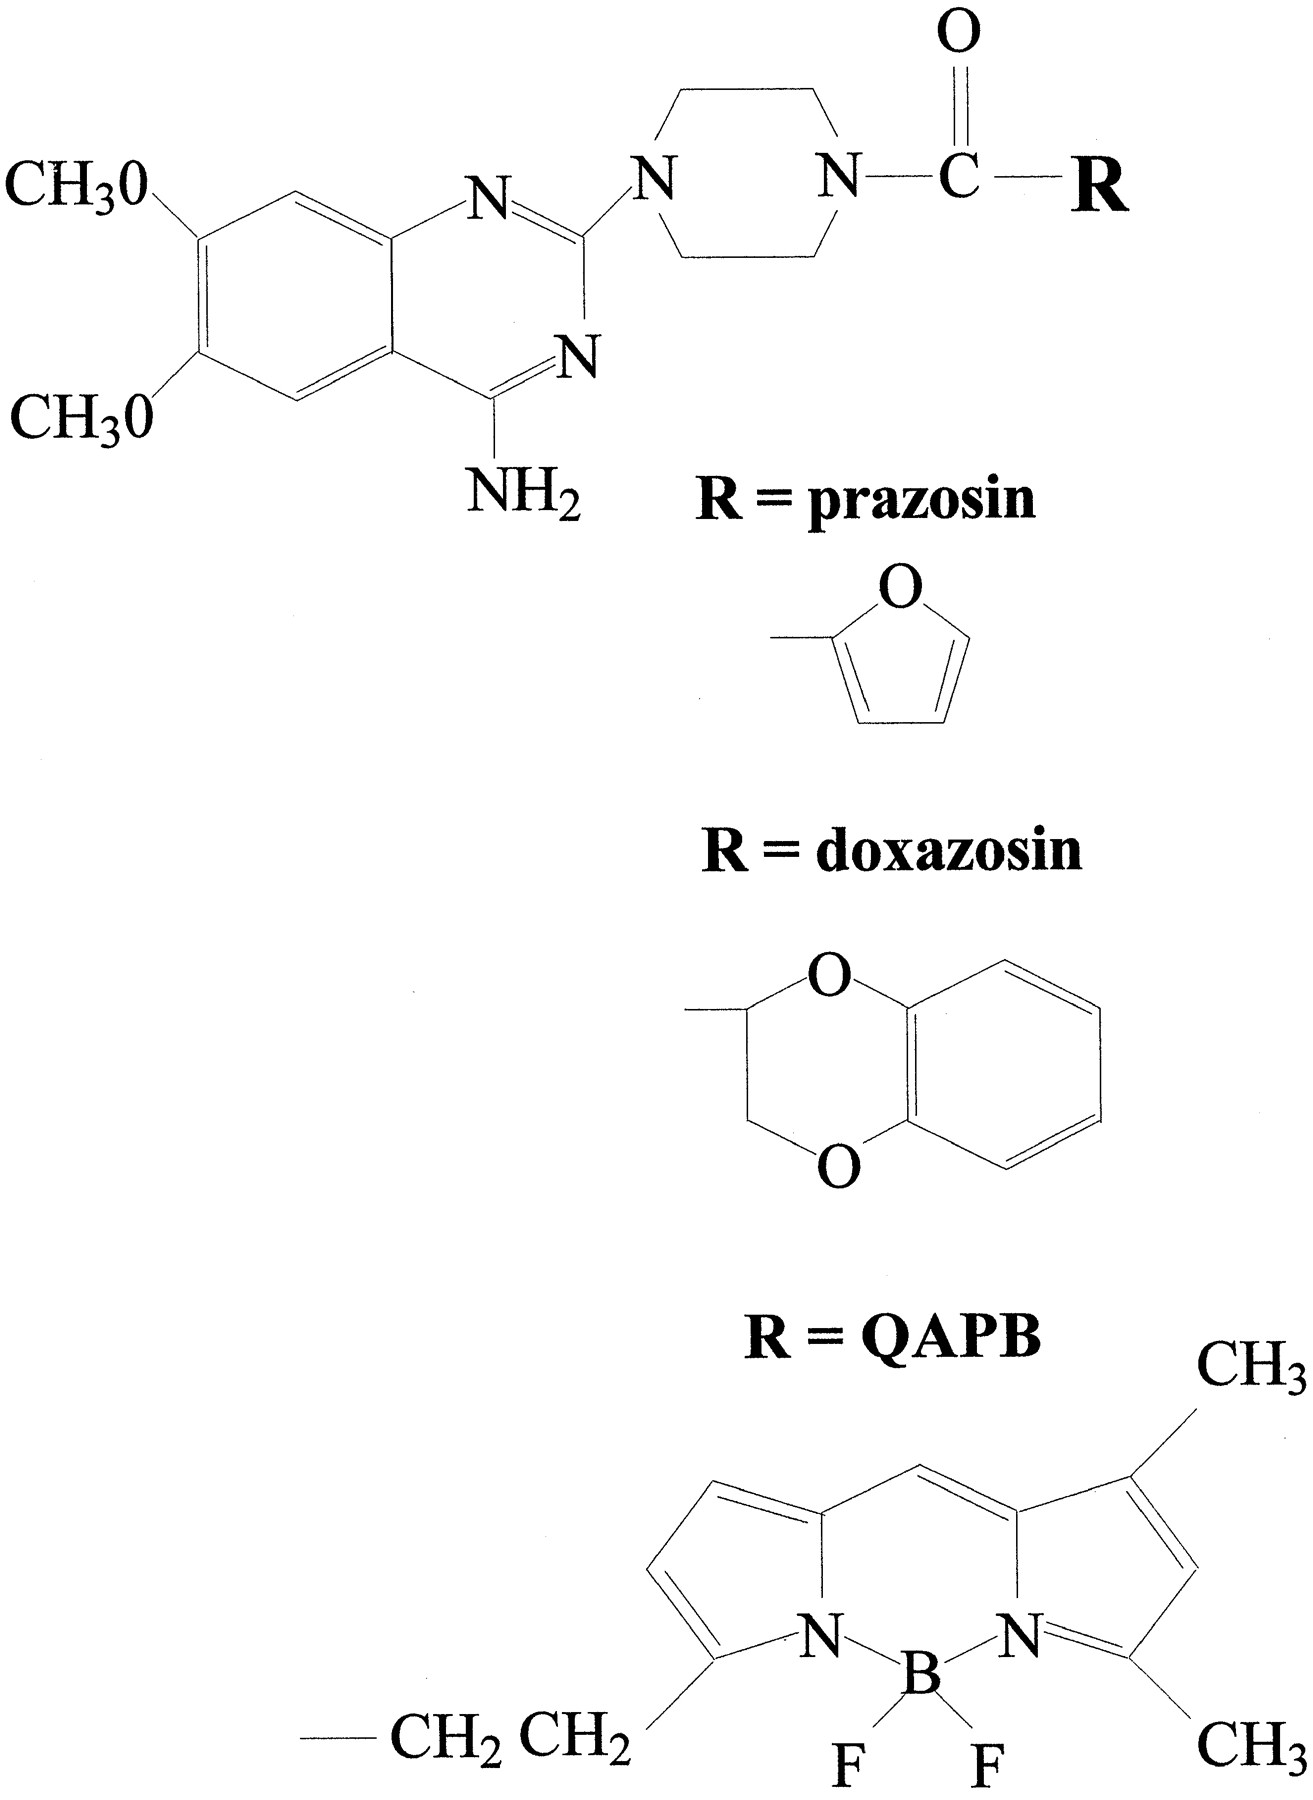
The ligand used in this study (which we call QAPB, an abbreviation of quinazolinyl piperazine-BODIPY; see fig.1 and McGrath et al., 1996 for details) is related to the alpha-1 adrenoceptor antagonists doxazosin, prazosin and terazosin (Ruffolo et al., 1995) sharing an identical quinazolinyl piperazine group (fig. 1) and so might be expected to have nM affinity for alpha-1 adrenoceptors. We have now taken the important further step of visualizing QAPB at concentrations equivalent to those used for radioligand binding (0.4–10 nM), in real time, at kinetic equilibrium, with a defined receptor subtype, on live cells, which allows the construction of a ligand binding curve on an individual cell or subcellular region therefrom. In addition we have used image analysis methods to quantify the diffuse and clustered “specific” binding sites that can only be visualized in the 0.4 to 5 nM range. The cells used were rat-1 fibroblasts expressing the recombinantalpha-1d adrenoceptor.

The structure of quinazolinyl piperazine (top) and the various substituents (R) that distinguish prazosin, doxazosin and QAPB. This particular form of BODIPY is excited at 488 nm and emits above 515 nm. The compound was obtained from Molecular Probes and is listed in their catalogue as “BODIPY FL-prazosin” but because it lacks the furan group that defines prazosin, as opposed to other compounds that share the quinazolinyl piperazine group, such as doxazosin, we refer to it by an acronym, “QAPB,” derived from its chemical name (quinazolinyl piperazine borate-dipyrromethene).
The pharmacology of the compound was first validated by showing that it was a functional antagonist against phenylephrine and that it displaced3H-prazosin in conventional binding experiments. Using confocal microscopy, the compound was shown to produce fluorescent regions on the cells, which could be diminished byalpha adrenoceptor antagonists. Saturation binding characteristics of the fluorescent regions were quantitatively consistent with the pharmacological properties and were interpreted as a measure of the fluorescent ligand-receptor complex. This provides the basis for the high resolution, subcellular mapping of the receptors and the study of their binding affinities and kinetics.
Experimental Procedures
Materials.
Reagents used were of the highest analytical grade. The following compounds were used: DMEM (GIBCO UK); [3H]-prazosin (86 Ci mmol−1) andmyo-[2-3H]inositol were obtained from Amersham Corp. (Arlington Heights, IL); BODIPY FL-prazosin “QAPB”(Molecular Probes Inc., Eugene, OR); prazosin HCl and doxazosin (Pfizer, Sandwich, UK); phentolamine mesylate (Sigma Chemical Co., Dorset, UK); phenylephrine HCl (Sigma Chemical Co., St. Louis, MO); .
Cell culture.
Rat 1 fibroblasts stably expressing thealpha-1d adrenoceptor (see Wise et al., 1995) were maintained in DMEM containing 5% (v/v) newborn calf serum, glutamine, penicillin, streptomycin and geneticin (G418) in a humidified atmosphere at 37°C containing 5% CO2.
Inositol phosphate studies.
Cells were seeded in 24-well plates and labeled close to isotopic equilibrium by incubation with 1 μCi/ml myo-[2-3H]inositol in 0.5 ml of inositol-free DMEM containing 1% (v/v) dialyzed newborn calf serum for 36 hr. On the day of the experiments the labeling medium was removed and cells were washed twice with HBG buffer [0.5 ml Hanks’ buffered saline, pH 7.4, containing 1% (w/v) bovine serum albumin and 10 mM glucose]. Cells were then washed twice for 10 min with HBG/LiCl buffer (HBG supplemented with 10 mM LiCl) and subsequently stimulated with agonist in HBG/LiCl for 20 min. All incubations were conducted at 37°C. Reactions were terminated by the addition of 0.5 ml of ice-cold methanol. Cells were then scraped, transferred to vials and chloroform was added to a CHCl3/MeOH ratio of 1:2 (v/v). Total inositol phosphates were extracted for 30 min before the addition of chloroform and water to a final ratio of 1:1:0.9 (CHCl3/MeOH/H2O, by vol). The upper phase was taken and total inositol phosphates were analyzed by batch chromatography on Dowex-1 formate as previously described (Wise et al., 1995).
Membrane preparation.
Cells were grown to confluence and harvested using a rubber policeman followed by centrifugation at 600 × g for 5 min. The cell pellet was resuspended in 5 ml of Tris-HCl assay buffer (150 mM NaCl, 50 mM Tris-HCl, 10 mM MgCl2, 5 mM EDTA, 1 μg/ml leupeptin, 10 mM benzamidine, 500 μg/ml soya bean trypsin inhibitor, pH 7.4) and homogenized at setting 6 for 3 x 5 sec using a ultrapolytron. After centrifugation (600 × g, 10 min, 4°C) the supernatant was retained on ice while the pellet was resuspended, rehomogenized and recentrifuged. The supernatants were pooled and centrifuged at 56,000 × g for 30 min at 4°C. The resulting membrane pellet was resuspended in 1 ml of ice-cold Tris-HCl assay buffer and homogenized with a 5-ml Teflon-in-glass homogenizer. The homogenate was processed for protein estimation using a Pierce protein assay kit and adjusted to 0.5 mg/ml. Aliquots that were not used immediately for ligand binding were stored frozen at −80°C.
Radioligand binding studies.
Saturation studies were performed with rat alpha-1d fibroblast membranes (0.05 mg/ml) that were incubated in triplicate with [3H]-prazosin (0.05–10 nM) in a total volume of 0.5 ml of 150 mM NaCl, 50 mM Tris-HCl, 10 mM MgCl2, 5 mM EDTA, pH 7.4. Competition binding assays were performed by incubating membranes with 0.2 nM [3H]-prazosin in the presence or absence of a range of concentrations of the competing ligands. Nonspecific binding was defined as the concentration of bound ligand in the presence of 10 μM phentolamine. After equilibrium (30 min at 25°C) bound ligand was separated from free by vacuum filtration over GF/C filters on a Brandell cell harvester.
Inhibition of specific binding of [3H]-prazosin by ligands was analyzed to estimate the IC50(concentration of the ligand displacing 50% of specific binding). The inhibitory constant (Ki ) was calculated from the IC50 by the equation of Cheng and Prusoff (1973). Binding isotherms from displacement studies were analyzed by a nonlinear least square parametric curve fitting program GRAPHPAD Prism, capable of iterative curve fitting to a single or two-site model.
Confocal microscopy.
A Noran Odyssey real-time CLSM was used in conjunction with an Nikon Diaphot (inverted) microscope. The 488 nm line (515 nm band pass) of an argon-ion laser was used throughout. To maximize the signal detection at very low concentrations of the fluorescent ligand a 100-μm slit was used in all experiments. Although not giving the optimum “confocality” required for three-dimension reconstruction work, this slit width nevertheless gave a significant increase in axial resolution compared with a conventional fluorescence microscope. A Nikon 40x oil immersion objective (NA 1.3) was used throughout.
Whole cell image analysis.
Images were collected and analyzed using Universal Imaging’s “MetaMorph” software. Cells were grown on coverslips for 24 hr before use. Coverslips were mounted in a flow chamber (WPI) and placed on the stage of an invert (Nikon Diaphot) microscope fitted with a Noran Odyssey Laser Scanning Confocal Module. Using cell autofluorescence a suitable group of cells was selected and the focal plane fixed by locking the focus motor. The system was then set to acquire images (64 frame averages; 2.56-sec exposure) at 1-min intervals. After a “run in” period of 5 to 6 min the first concentration of fluorescent ligand was added and allowed to equilibrate for at least 5 min. After equilibration the next concentration of fluorescent ligand is added, without washing, and given at least 5 min to reach equilibrium (i.e., no further increase in fluorescence). Once saturation has been reached the individual cells are outlined using MetaMorph’s define-region tool and the whole time series is plotted as intensity vs. time for each cell. Nonspecific binding was defined as fluorescent binding in the presence of 10 μM phentolamine. The composition of the HEPES buffer for cellular studies was as follows: (mM) NaCl 130, KCl 5.0, HEPES 20, glucose 10, MgCl 1, CaCl 1.
Results
Ligand affinity.
In rat-1 fibroblasts expressing the ratalpha-1d adrenoceptor, coincubation of the cells with increasing concentrations of QAPB resulted in a progressive, parallel rightward shift in the concentration-effect curve for the generation of inositol phosphate induced by the alpha-1 adrenoceptor agonist phenylephrine (Wise et al., 1995) without alteration in the maximal effect (fig. 2a), demonstrating QAPB to act as a competitive, functional antagonist at this receptor. Transformation of this data to produce a Schild plot resulted in an estimated pA2 for QAPB at the ratalpha-1d adrenoceptor of 7.78 which was not significantly different from its antagonism of phenylephrine in rat aorta (pA2 8.25, data not shown).
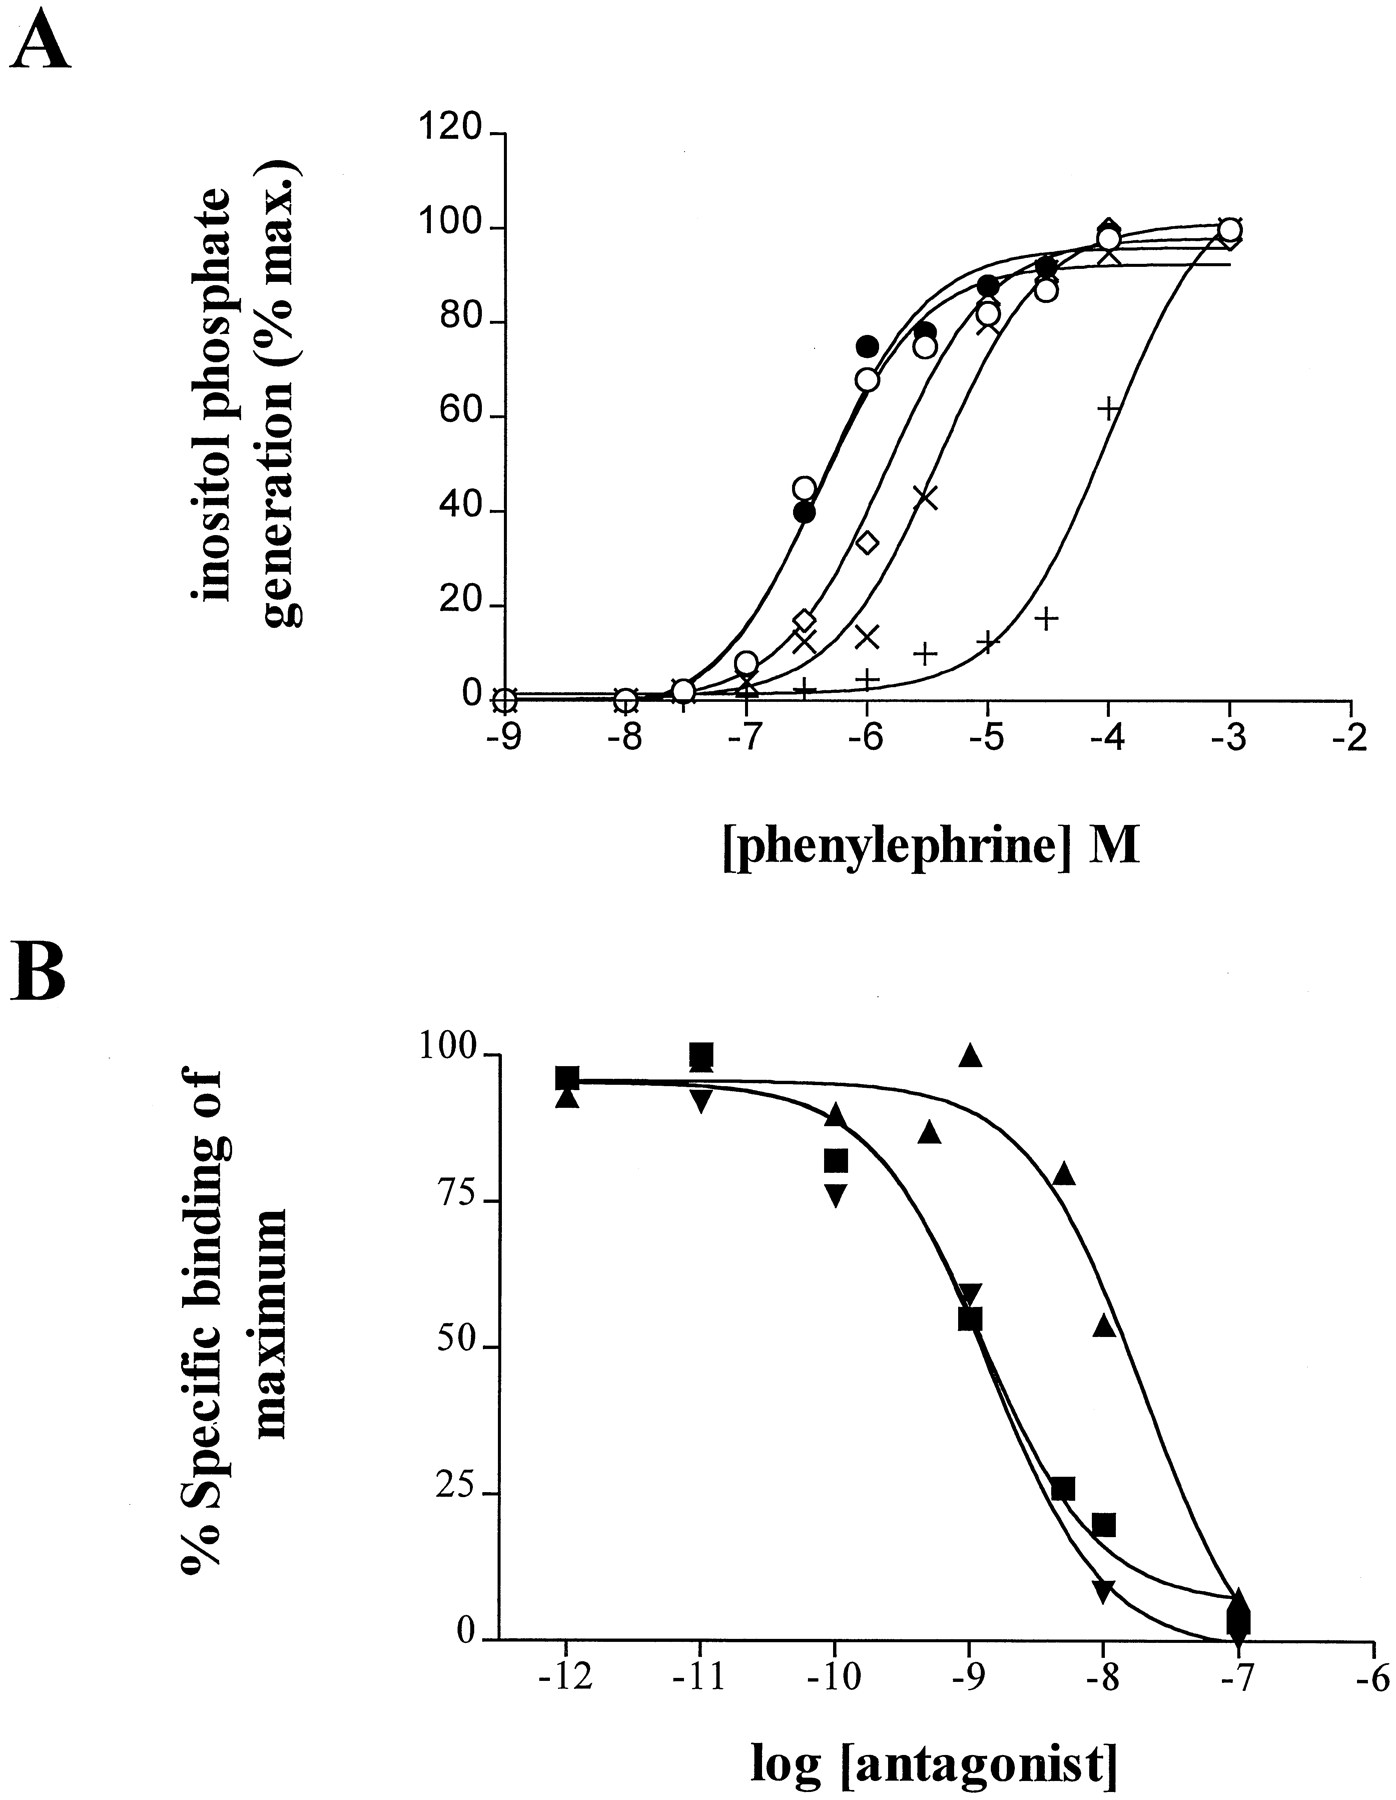
The graphs show two different assays in which QAPB has been tested for its functional antagonism atalpha-1d/D adrenoceptors. a, Inositol phosphate generation in response to varying concentrations of phenylephrine was measured in the presence of a range of concentrations of QAP-B (control ○; 10 nM •; 30 nM ⋄; 100 nM ×; 1 μM +) in cells of thealpha-1d adrenoceptor expressing clone. b, Inhibition of .2 nM 3H-prazosin from alpha-1d membranes by prazosin ▪, QAPB ▾ and doxazosin ▴.
3H-prazosin binding to fractionated cell membranes is the common method used to determine alpha-1 adrenoceptor number and affinity (Kenny et al., 1996). Inhibition of 3H-prazosin binding toalpha-1d membranes by unlabelled competitors resulted inKi (pKi ; antagonist) values of 1.04 (9; prazosin), 1.24 (8.9; QAPB) and 17.8 nM (7.5; doxazosin) (fig. 2b). Inhibition curves were analyzed using GraphPad PRISM and were statistically best fit by a single-site model, confirming binding-site homogeneity.
Fluorescent ligand binding.
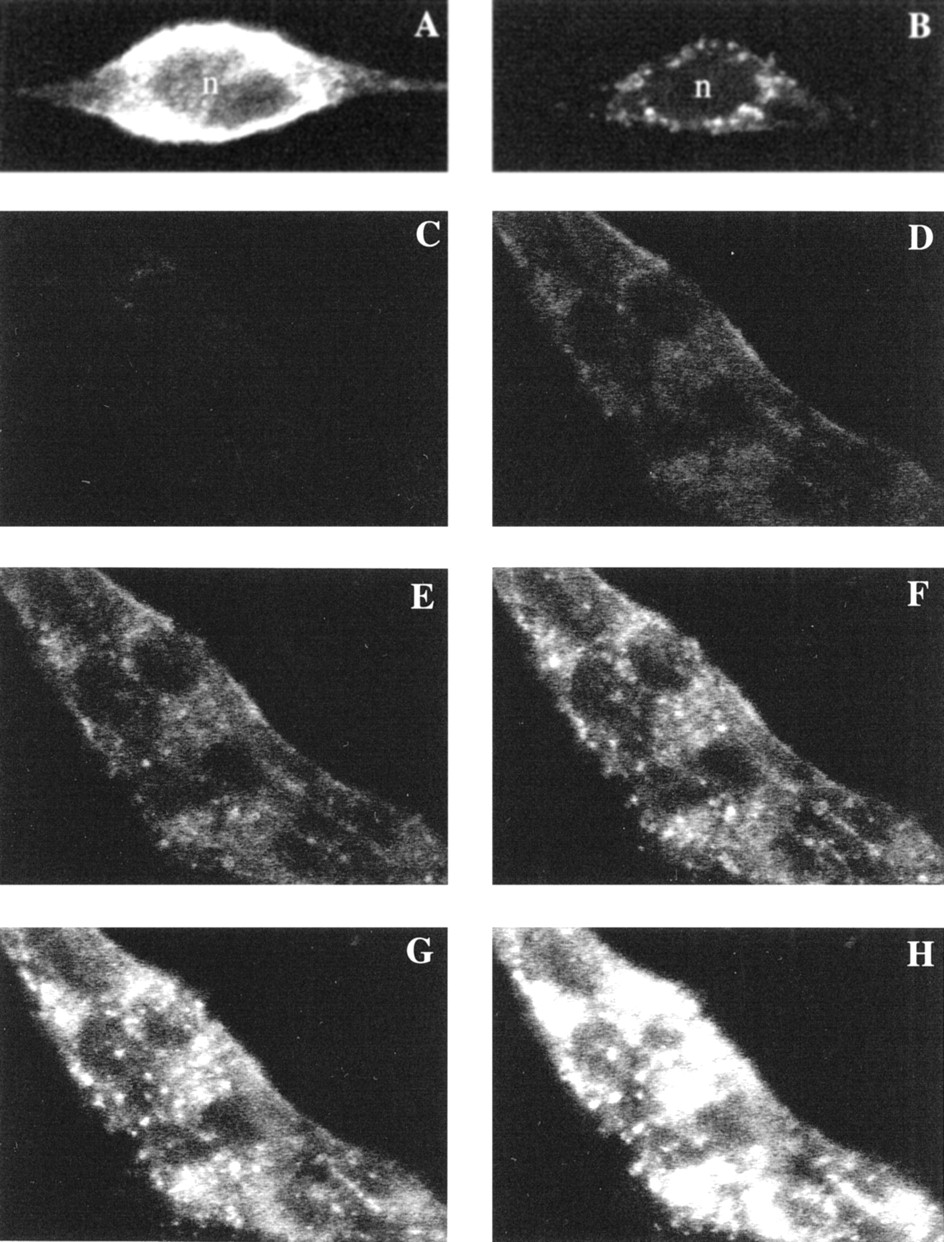
If the ligand is fluorescent when bound to the receptor then it should be possible to localize the receptors microscopically. Whether this can be achieved at equilibrium will depend on the degree of background fluorescence from the overlying medium. This was tested on the cells expressing the recombinantalpha-1d adrenoceptor. Incubation with QAPB produced concentration-related fluorescence on the cells. There was virtually no background fluorescence from QAPB in solution and minimal fluorescence from nontransfected fibroblasts demonstrating a high specificity of fluorescence for the presence of the receptors. This enabled capture of a fluorescent image of the alpha-1d adrenoceptor expressing cells in the presence of the fluorescent ligand that is virtually an image of the receptor distribution. Incubation with 1 nM QAPB showed clear binding to the cell membrane that was inhibited in the presence of 10 μM phenoxybenzamine (fig. 3a and b).

QAPB binding-induced fluorescence on α1d-adrenoceptor transfected cells. a, A single cell stained with 1 nM QAPB exhibits binding on the cell membrane. b, The presence of phenoxybenzamine (10 μM) markedly inhibits the binding of 1 nM QAPB and leaves only the intracellular sites available. The nucleus (n) contains no binding sites for QAPB. The diffuse fluorescence over the nucleus in a is probably the result of light diffraction from the overlying membrane. Patches of cells grown on coverslips were examined by confocal microscopy. c-h, Timelapse photography of a patch of seven fibroblasts (individual cells are identified by the nonstained “black” nuclei). Increasing concentrations (0.4–10 nM) were added cumulatively and images were collected at 1-min intervals. c-h, show images collected at equilibrium point for each concentration (c, control; d, .4; e, 1; f, 2; g, 5; h, 10 nM). Images are in grayscale where black indicates no staining and white indicates maximal concentration (saturation) of the fluorophore.
Images were taken at 1-min intervals and each concentration was given time to reach equilibrium, typically 3 to 6 min. Two patterns of fluorescence were visible over a cumulatively increasing concentration range (0.4–10 nM). At the lowest concentration (0.4 nM) binding sites appeared to be diffuse and tended to be concentrated at the cell membrane/boundaries (fig. 3d). At 1 nM diffuse staining became stronger and clusters of binding sites became visible (fig. 3e). As the concentration increased to 10 nM (fig. 3f-h) the clusters became visibly more distinct from the diffuse staining.
Image analysis.
The digital image contains considerable information on the concentration as well as localization of the fluorescent ligand-receptor complex. The image was segmented into three regions of interest, 1) the high intensity “clusters,” 2) the mid-range intensities and 3) lower intensity “diffuse” fluorescence, to compare how much of the total receptor population each represented and to assess whether their affinities differed (fig 4a-d). The regions were set according to the images obtained at 5 nM QAPB (fig. 3g). This shows that the majority of the total fluorescence emanates from the diffuse and mid-range regions (41.2 and 43.2%, respectively), even though the average fluorescence intensity of the clusters is greater. The clusters cover 9.4% of the cell area and contain 15.5% of the total fluorecence and hence receptors. The diffuse staining covers 54.9% of the total cell area providing 41.2% of the total fluorescence. These data are summarized in table1.
Analyses of the image obtained after incubation with 5 nM QAPB (figs. 4and 5)
The data can be scattered and fit by a nonlinear regression to give a fluorescence half maximum value in nM (fig.4c and d). The mid range intensities (green) produced a value of 1.6, slightly higher than the low (diffuse; red) and high (clustered; blue) ranges that produced identical values of 1.3 nM, consistent with the Ki(1.04 nM) calculated from displacement of3H-prazosin with QAPB. This is of course total binding, although the very low fluorescence from nontransfected cells suggests that the amount of nonspecific binding at the concentrations used is negligible.

a-d, Image analysis of the data set shown in figure3 (c-h). a, 5 nM QAPB staining (taken from fig 3g). b, The diffuse, mid-range and clustered areas were separately analyzed. The image of the receptors was split into low intensity (65–128; ▪; red) “diffuse” areas, mid-range intensity (129–191; ▴; green) and high intensity (192–255; •; blue) “clustered” areas, prepared from figure 3g. c, The “masks” were then used to measure separately the total and average fluorescence of each region at each concentration. This is plotted as saturation curves of average fluorescence calculated from the images shown in figure 3. d, The data from c is shown as percentage of maximum fluorecence. e, A single cell in the presence of 10 nM QAPB at saturation. f, A single cell, preincubated with phentolamine 10 μM, in the presence of 10 nM QAPB at saturation. g, Total (▪), specific (•) and nonspecific (▴) binding of QAPB to “live” alpha-1d cells. h, Total (▪), specific (•) and nonspecific (▴) binding of [3H]-prazosin toalpha-1d adrenoceptor membrane preparations. Nonspecific binding was determined in the presence of 10 μM phentolamine. Note: The digital image is made up of pixels whose values range from 0 (black) to 255 (white) with intermediate values representing shades of grey (grayscale LUT). It is possible to define a region of interest either as a locality within a boundary or as those areas, wherever they are, whose pixels fall within a range of intensity values. The total or average intensity within each region can then be quantified. A mask can be created to define the region of interest under a particular set of conditions and the defined region under the mask can be revisited for analysis.
Specificity of binding was further defined in a separate series of experiments in which absolute values of fluorescence intensity were measured over a range of concentrations under identical conditions in separate sets of cells. Data were collected from experiments in the absence (total binding; example cell shown in fig. 4e) or presence (nonspecific binding; example cell shown in fig. 4f) of 10 μM phentolamine and used to construct a specific binding curve (fig. 4g;Kd = 2.39 ± 1.23 nM). Scatchard analysis of the specific binding curve for3H-prazosin binding to alpha-1d membranes produced a Kd of 1.89 ± 0.15 nM (fig. 4h). Thus the binding characteristics of fluorescent QAPB on living cells and radioactive prazosin on membrane fractions are very similar as shown by their dissociation constants and saturation binding curves (Fig. 4g and h).
Discussion
QAPB was validated as a competitive antagonist vs.phenylephrine’s production of inositol phosphates and as a competitive ligand vs.3H-prazosin, confirming that it is a ligand for functional alpha-1d adrenoceptors. The binding and functional antagonism data shows that despite the modification of the molecule to incorporate the fluorescent tag, it retains the properties required of a high affinity pharmacological “antagonist” ligand. The affinity for QAPB vs.3H-prazosin (-log Ki = 8.9) is slightly higher than the derived pA2values of 8.25 (in rat aorta) and 7.78 (vs. IP3 generation in transfected cells) and is consistent with other comparisons of binding and functional antagonism. This validates QAPB as a competitive antagonist ligand at alpha-1d/D adrenoceptors. The absence of background fluorescence detected by microscopy in the medium or in parent cells indicates that the amount of fluorescence from the free ligand in solution is quantitatively infinitesimal at the concentrations used in our study. Thus, the fluorescent signal from the cells in the presence of QAPB originates from ligand molecules bound to the receptors and this exists in a situation of a high signal to noise ratio. Thus the detected fluorescence signal originates from the ligand-receptor complex and is proportional to the concentration of ligand-receptor complex which is in equilibrium with the nonfluorescent aqueous phase. This provides ideal conditions for assay of the ligand-receptor complex.
If our interpretation is correct, then the fluorescence binding characteristics should correspond quantitatively to the other pharmacological measures. The binding characteristics of QAPB’s fluorescence (log fluorescence half maximum of 8.4) lay between its functional competitive antagonism at the alpha-1d adrenoceptor (pA2 = 7.9) and its displacement of3H-prazosin (pKi= 8.7). A further corollary confirming that fluorescence indicates the ligand-receptor complex is the reduction of fluorescence by other competitive ligands for the site. Experiments performed in the presence of phentolamine (fig. 4g) allow the quantification of “specific” binding. In fact this is an extremely useful feature of fluorescence binding because image subtraction can remove the nonspecific binding leaving only the image of the receptors which have been “removed,” i.e., competitively antagonized by the competitor.
A requirement for efficient ligand binding is the ability to use the ligand at concentrations that are low in relation to its binding affinity. To represent receptor binding, the concentration of unlabeled ligand displacing 50% of the labeled ligand should be similar to theKd . It proved possible to use the fluorescent antagonist QAPB on live cells at similar concentrations to those of 3H-prazosin on membrane preparations in radioactive binding experiments. A study of alpha-1b adrenoceptors using flow cytometry (Hirasawa et al., 1996) examined QAPB binding at 1 μM, a concentration that we believe to have significant nonspecific effects. Similarly, Wang et al., (1997) used 50 to 500 nM of QAPB to study alpha-1 adrenoceptors in rat cultured cortical neurons. Interestingly, the same group also reported an apparent Ki for QAPB of 64 nM (vs. 10 nM [3H]-prazosin). This is in contrast to our estimation of 1.24 nM (vs. 0.2 nM [3H]-prazosin). It is clear from ours and these other studies with QAPB that great caution should be taken in the interpretation of fluorescence-derived images. It is crucial that for any given tissue and receptor subtype the degree of nonspecific binding at the concentrations used should be determined. In our studies we have sacrificed a certain degree of confocality (i.e., by using a wide, 100 μm, slit) to ensure that we are retaining ligand specificity in the low nM range (0.4–10). However, at 10 nM we have found evidence of intracellular binding which may account for the observed “nonspecific” binding in the presence of both phenoxybenzamine (fig. 3b) and phentolamine (fig. 4f). Because the quinazoline drugs are lipophilic it may be expected that nonquinazolines will fail to compete with high concentrations of QAPB (see McGrath et al., 1996 for further discussion). It could be argued, for living cells, that binding in the presence of phentolamine is not completely nonspecific and may represent the fraction of receptors not accessible to phentolamine. This again points to the need for caution when interpreting image data derived using high (with respect to the Kd value) concentrations of a fluorescent ligand such as QAPB.
Because the detection is by microscopy, analysis can be made on the subcellular level and under physiological conditions, both of which are advances on radioligands. New information on both of these aspects was found in relation to “clusters” of receptors, which have previously been demonstrated by immunohistochemistry in fixed tissue for several receptor types. For example, Uhlen et al. (1995) using epitope tagged antibodies, reported that alpha-2A adrenoceptors exist as two populations of diffuse and clustered receptors which is in accord with the known clustering of G proteins.
Our study demonstrates for the first time the existence of diffuse and clustered populations of alpha-1 adrenoceptor binding sites in live cells. We showed that the affinity of both populations for the ligand is identical. This shows that the environment of the clustered domain leaves the binding site accessible to ligands. We then estimated the relative distribution of receptors between these two domains. This quantitative analysis showed that although the clusters are visually striking they represent a relatively small proportion of the receptor population which is accessible to ligand. This emphasizes that subjective visual assessment can exaggerate the relative proportion of receptors that appears to be present in the clusters. It is also possible to be misled by quantification of processed photographic images because alteration of “contrast” can change the linearity of the signal, thus underestimating the diffuse signal or in other circumstances underestimating intense “out-of-range” peaks. In immunohistochemistry a similar bias against low level diffuse staining is found since this can be dismissed as background noise.
Our demonstration and validation of fluorescent ligand binding and quantitative image analysis was carried out in a simple transfected cell system where the receptor is molecularly defined. Even here there is an advance in knowledge because binding can be compared directly with functional responses under identical conditions and the localization of the receptive sites of receptor molecules can be mapped. There are further advantages in intact tissues where multiple native receptor subtypes may be separately identified, mapped and studied, even in the presence of multiple cell types, and with considerable gain in resolution over available receptor antibodies. We have obtained images of receptor distribution in isolated smooth muscle cells dissociated from human prostate and mouse tail artery using QAPB (0.4–5 nM; unpublished observations). Unfortunately, the fluoresceine-like “green” autofluorescence from elastin in intact tissues masks the relatively low fluorescence signal from the QAPB-receptor complex. Therefore, a new selection of subtype specific “red” ligands is currently being synthesized and evaluated in our laboratories.
With the synthesis of appropriate ligands the principle of quantitative fluorescent ligand binding should be widely applicable to the subcellular analysis of sites involved in reversible associations such as receptors and transporters. Once validated on this level it should be possible to develop simpler assays for use in spectrofluorimeters.
Acknowledgment
The Glasgow Clinical Research Initiative Laboratory is a member of the EU Biomed project EURECA.
Footnotes
-
Send reprint requests to: Dr. Craig J. Daly, Clinical Research Initiative, West Medical Building, University of Glasgow, University Avenue, Glasgow G12 8QQ, Scotland.
-
↵1 This work was supported by the Medical Research Council, the Scottish Hospitals Endowments Research Trust and Pfizer.
- Abbreviations:
- CLSM
- confocal laser scanning microscope
- BODIPY
- borate-dipyrromethene
- QAPB
- quinazolinyl piperazine-BODIPY
- DMEM
- Dulbecco’s modified Eagle medium
- HBG
- Hanks buffered glucose
- Received January 26, 1998.
- Accepted April 14, 1998.
- The American Society for Pharmacology and Experimental Therapeutics


