


Abstract
Organic anion transporting polypeptide (OATP) 1B1 and OATP1B3 are responsible for the hepatic uptake of organic anions. They share similar sequences and structures with 12 putative transmembrane domains (TMs). Their substrate specificities are very broad and overlap each other, whereas each transporter specifically recognizes certain substrates. Because the homology of the amino acid sequence in the latter part of OATP1B1 and OATP1B3 is relatively low, to determine which TMs in the latter part of OATP1B1 are important for its substrate recognition, we constructed several cell lines expressing chimeric transporters in which some TMs of OATP1B1 were substituted with those of OATP1B3, and we investigated the transport kinetics of estrone-3-sulfate (E-sul; a substrate preferentially accepted by OATP1B1) and estradiol-17β-d-glucuronide (EG; a substrate accepted by both transporters). As the number of substituted TMs at the N terminus with those of OATP1B3 increased, the Km value of E-sul greatly increased and its uptake clearance decreased. The substitution of TM7 or TM9 of OATP1B1 with that of OATP1B3 (named 1B1-TM7 or 1B1-TM9) did not change the transport kinetics of EG, whereas the Km value of E-sul in 1B1-TM9 increased 7.4-fold. Conversely, the substitution of TM8 resulted in an 18-fold increase in the Km value of E-sul and abolished the transporter-mediated uptake of EG. These results suggest that TM8 in OATP1B1 is critical for the substrate recognition of both E-sul and EG and that TM9 is important for the recognition of E-sul, whereas it is interchangeable with that of OATP1B3 for EG transport.
To protect the body from exposure to various endogenous and exogenous compounds, many kinds of transporters and metabolic enzymes are expressed, and substrate specificity of each protein is generally very broad. However, the underlying mechanisms to explain why each drug transporter can accept a variety of compounds as substrates so far remain to be elucidated because the crystal structures of mammalian drug transporters have not yet been solved. Recently, some reports have created in silico models to explain the substrate specificity of drug transporters by using ligand-based drug design approach (Chang et al., 2005). However, there are few studies identifying the exact binding sites of multiple substrates in drug transporters from in silico analysis.
Organic anion transporting polypeptide (OATP) 1B1 and OATP1B3 are predominantly expressed on the basolateral membrane of human hepatocytes (Abe et al., 1999, 2001; Hsiang et al., 1999; König et al., 2000a,b). The genomic sequence of OATP1B1 and OATP1B3 is arranged in tandem on the same locus, and their genomic exon-intron coordination is very similar (König et al., 2000a). The homology of their amino acid sequences is 80%, and they share the same structure with 12 putative transmembrane domains (TMs). The substrate specificity of OATP1B1 and OATP1B3 is very broad, and various structurally unrelated compounds can be accepted by these transporters as substrates. Moreover, the substrate specificity of OATP1B1 often overlaps with that of OATP1B3, such as that for estradiol 17β-d-glucuronide (EG), taurocholate, thyroid hormones, sulfobromophthalein, and clinically used drugs (including HMG-CoA reductase inhibitors and angiotensin II receptor antagonists) (Tirona and Kim, 2007). Several lines of clinical evidence have suggested that the change in the transport function of OATP1B1 caused by genetic polymorphisms and drug-drug interactions affects the pharmacokinetics and subsequent pharmacological/toxicological effect of multiple anionic drugs (Shitara et al., 2005; Maeda and Sugiyama, 2008). Hirano et al. (2004) have established several methodologies for estimating the contribution of OATP1B1 and OATP1B3 to the overall hepatic uptake of compounds. These approaches have revealed that HMG-CoA reductase inhibitors (pitavastatin and rosuvastatin) are generally taken up into human hepatocytes predominantly via OATP1B1 (Hirano et al., 2004; Kitamura et al., 2008), whereas angiotensin II receptor antagonists (valsartan and olmesartan) are taken up via both OATP1B1 and OATP1B3 to the same extent (Yamashiro et al., 2006; Yamada et al., 2007). Thus, OATP1B1 and OATP1B3 are responsible for the hepatic uptake of organic anions in humans.

Schematic diagram of the name and structure of chimeric proteins used in this study. Black and white boxes represent the TMs originating from OATP1B1 and OATP1B3, respectively. A, chimeric OATP1B1 protein in which the former part of the consecutive TMs (first to Nth) is replaced with that of OATP1B3 is named 1B1-TM1-N. B, chimeric OATP1B1 protein in which single Nth TM is replaced with that of OATP1B3 is named 1B1-TMN.
Although these transporters show overlapping substrate specificities, some substrates are highly specific to each transporter. For example, E-sul, caspofungin, and SN-38 (active metabolite of irinotecan) are reported to be specifically transported by OATP1B1 but not OATP1B3 (Hirano et al., 2004; Nozawa et al., 2005; Sandhu et al., 2005). Alternatively, cholecystokinin octapeptide (CCK-8), telmisartan, and docetaxel are transported only by OATP1B3 (Ismair et al., 2001; Smith et al., 2005; Ishiguro et al., 2006). This suggests that even the substrate recognition properties of highly homologous transporters, OATP1B1 and OATP1B3 are somewhat different and may be the result of small differences in their amino acid sequences. To explore the amino acids important for discriminating the substrate specificity of OATP1B1 and OATP1B3, the creation of several chimeric proteins using parts of OATP1B1 and OATP1B3 is a powerful approach for determining which TMs are interchangeable and for narrowing the candidate binding sites of transporter substrates. During the preparation of our article, Gui and Hagenbuch (2008) showed that three amino acids in TM10 of OATP1B3 are critical for the transport of CCK-8 by using several kinds of chimeric proteins in which TMs of OATP1B3 are substituted with those from OATP1B1. However, little is known about the molecular mechanism for the broad but strict substrate specificity of OATP1B1, and the important binding sites for its substrates have not been clarified. Especially in the latter part of OATP1B1 and OATP1B3 sequences, the homology of amino acid sequence is relatively lower, which implies that this region might be important for substrate recognition by OATP1B1.
Therefore, the purpose of this study was to clarify the difference and similarity of the substrate recognition properties of OATP1B1 and OATP1B3. To achieve this goal, we especially focused on the latter half of TMs and observed the effect of the exchange of TMs in OATP1B1 with those of OATP1B3 on the transport properties of their common substrate, EG and the OATP1B1-selective substrate, E-sul, by using a series of chimeric OATP1B1 transporters.
Materials and Methods
Materials. [3H]EG (45 μCi/nmol) and [3H]E-sul (46 μCi/nmol) were purchased from PerkinElmer Life and Analytical Sciences (Boston, MA). [3H]CCK-8 (77 Ci/mmol) was purchased from GE Healthcare (Chalfont St. Giles, Buckinghamshire, UK). All other chemicals were commercially available and of reagent grade.
Definition of the Names for Chimeric OATP1B1 Proteins. As shown in Fig. 1, a chimeric OATP1B1 protein in which the first to Nth TMs of OATP1B1 were substituted with those of OATP1B3 is named 1B1-TM1-N. A mutated protein, in which the Nth TM of OATP1B1 was replaced with that of OATP1B3 is named 1B1-TMN.
Construction of the Plasmid Vectors for Chimeric Proteins. Using previously constructed pcDNA3.1(+)/Neo vectors carrying human OATP1B1 and OATP1B3 cDNA (Hirano et al., 2004) as templates, mammalian expression vectors for chimeric proteins including 1B1-TM1-3, 1B1-TM1-6, 1B1-TM1-7, 1B1-TM1-8, and 1B1-TM1-9 were amplified by overlap extension polymerase chain reaction. The pcDNA3.1(+)/Neo expression vectors for mutated proteins, whose single TM of OATP1B1 was substituted with that from OATP1B3 including 1B1-TM7, 1B1-TM8, and 1B1-TM9 were constructed using a QuikChange site-directed mutagenesis kit (Stratagene, La Jolla, CA) as described previously (Geiser et al., 2001). The sequences of all the constructs were verified using a DNA sequencer (3130xl Genetic Analyzer; Applied Biosystems, Foster City, CA).
Cell Culture and Transfection of Plasmid Vectors into Cells. Each pcDNA3.1(+)/Neo expression vector carrying cDNA of chimeric transporter was transfected into HEK293 cells using Fu-GENE 6 reagent (Roche Diagnostics, Indianapolis, IN) as described previously (Hirano et al., 2004). The transfected HEK293 cells were selected with Geneticin (G418, 800 μg/ml; Invitrogen, Carlsbad, CA). HEK293 cells stably expressing each type of chimeric transporter were cultured in low-glucose Dulbecco's modified Eagle's medium (Invitrogen) with 10% fetal bovine serum (Sigma-Aldrich, St. Louis, MO) and 1% antibiotic-antimycotic solution (Invitrogen) at 37°C under 5% CO2 and 95% humidity.
Western Blot Analysis. Crude membrane was prepared from HEK293 cells as reported previously (Sasaki et al., 2002). After the crude membrane fraction was suspended in PBS, it was immediately frozen in liquid N2 and stored at -80°C until used. The protein concentration of the crude membrane fractions prepared from HEK293 cells was determined by the method of Lowry (1951) with bovine serum albumin as a standard. The membrane fraction was dissolved in 3× SDS sample buffer (New England Biolabs, Ipswich, MA) and loaded onto a 7% SDS-polyacrylamide electrophoresis gel with a 3.75% stacking gel. The molecular weight was determined using a prestained protein marker (New England Biolabs). Proteins were transferred electrophoretically to a polyvinylidene difluoride membrane (Pall Corporation, East Hills, NY) using a blotter (Transblot; Bio-Rad, Hercules, CA) at 15 V for 1 h. The membrane was blocked with Tris-buffered saline containing 0.05% Tween 20 (TTBS) and 5% skimmed milk for 1 h at room temperature. After washing with TTBS, the membrane was incubated overnight at 4°C in TTBS with 500-fold diluted anti-OATP1B1 antiserum that we had produced previously in rabbit (Hirano et al., 2004). For the detection of each transporter, the membrane was placed in contact with 5000-fold diluted donkey anti-rabbit IgG conjugated with the horseradish peroxidase (GE Healthcare, Uppsala, Sweden) for 1 h in TTBS. The immunoreactive band was detected using an ECL Plus Western blotting starter kit (GE Healthcare), and its intensity was quantified using a luminescent image analyzer (LAS-3000 mini; Fuji Film, Tokyo, Japan).

Quantification of the relative protein expression level of each chimeric OATP1B1 protein in crude membrane fractions from HEK293 transfectant by Western blot analysis. Crude membrane fractions prepared from each HEK293 transfectant were separated by SDS-polyacrylamide gel electrophoresis. Wild-type OATP1B1 and various types of chimeric OATP1B1 proteins in HEK293 transfectants were detected using rabbit antiserum raised against the carboxyl terminus of human OATP1B1 (A). The amount of protein applied in each lane is indicated below the blot. The band density of wild-type OATP1B1 in various protein amounts of the loaded crude membrane fraction was quantified and plotted in B as a standard curve. Then, the ratio of the relative expression level of each chimeric protein to that of wild-type OATP1B1 was calculated using the standard curve (C). Each bar represents the mean value of two independent determinations.

Immunolocalization of chimeric OATP1B1 proteins in HEK293 cells. Wild-type and chimeric OATP1B1 proteins (red fluorescence) and nuclei (blue fluorescence) were stained using the rabbit antiserum raised against the carboxyl terminus of OATP1B1 and TO-PRO-3 iodide, respectively. Each figure represents the immunocytochemical staining of HEK293 cells expressing OATP1B1 (B), 1B1-TM1-3 (C), 1B1-TM1-6 (D), 1B1-TM1-7 (E), 1B1-TM1-8 (F), 1B1-TM1-9 (G) as well as vector-transfected control cells (A).
Immunocytochemical Staining. HEK293 cells stably expressing chimeric and single TM-substituted OATP1B1 proteins were grown on a poly-l-lysine-coated coverglass (Micro coverglass, 18 × 18 mm and 0.12-0.17 mm in thickness; Matsunami Glass, Osaka, Japan). After fixation at -20°C with methanol for 10 min and permeabilization with 1% Triton X-100 containing PBS for 5 min, cells were incubated with rabbit antiserum raised against the carboxyl terminus of human OATP1B1 diluted 50-fold in PBS overnight at 4°C, washed three times with PBS, and then incubated for 1 h at room temperature with goat anti-rabbit IgG Alexa 568 (Invitrogen) diluted 250-fold in PBS in Fig. 3 or goat anti-rabbit IgG Alexa 488 (Invitrogen) diluted 250-fold in PBS in Fig. 6 for 1 h. Nuclei were stained with 200-fold diluted TO-PRO-3 iodide (Invitrogen). The localization was visualized using confocal laser microscopy (Zeiss LSM-510; Carl Zeiss, Thornwood, NY).
Transport Study. The transport study was performed as reported previously (Hirano et al., 2004). In brief, HEK293 cells were grown for 3 days in 12-well plates coated with poly-l-lysine and poly-l-ornithine (Sigma-Aldrich), and the normal culture medium was replaced with the culture medium supplemented with 5 mM sodium butyrate 24 h before the transport study to induce the expression of exogenous transporters. Uptake was initiated by adding Krebs-Henseleit buffer containing radiolabeled and unlabeled substrates after cells were washed once and preincubated with Krebs-Henseleit buffer at 37°C for 15 min. The Krebs-Henseleit buffer consisted of 118 mM NaCl, 23.8 mM NaHCO3, 4.83 mM KCl, 0.96 mM KH2PO4, 1.20 mM MgSO4, 12.5 mM HEPES, 5.0 mM glucose, and 1.53 mM CaCl2 adjusted to pH 7.4. The uptake was terminated at a designated time by adding ice-cold Krebs-Henseleit buffer after removal of the incubation buffer. Then, cells were washed three times with 1 ml of ice-cold Krebs-Henseleit buffer, solubilized in 500 μl of 0.2 N NaOH, kept overnight at room temperature, and then 250 μl of 0.4 N HCl was added. The radioactivity of cell lysate (500 μl) and incubation buffer (100 μl) was measured in a liquid scintillation counter (QuantaSmart, PerkinElmer Life and Analytical Sciences, Downers Grove, IL) after mixing each sample with 3 ml of scintillation fluid (Clear-sol I; Nacalai Tesque, Kyoto, Japan) in a scintillation vial. The remaining 20 μl of cell lysate was used to determine the protein concentration by the method of Lowry with bovine serum albumin as a standard.
Kinetic Analyses of the Transport of Substrates. Kinetic analysis was conducted as described previously (Hirano et al., 2004). Ligand uptake was expressed as the uptake volume (microliters per milligram of protein), given as the amount of radioactivity associated with the cells (dpm per milligram of protein) divided by its concentration in the incubation medium (dpm per microliter). Specific uptake was obtained by subtracting the uptake into vector-transfected cells from that into cDNA-transfected cells. Kinetic parameters were obtained using the equation v = Vmax × S/(Km × S), where v is the uptake velocity of the substrate (picomoles per minute per milligram of protein, S is the substrate concentration in the medium (micromolar), Km is the Michaelis-Menten constant (micromolar), and Vmax is the maximal uptake rate (picomoles per minute per milligram of protein). After v was normalized by the relative expression level of each chimeric protein to that of wild-type OATP1B1 by quantifying the band density of Western blots using a luminescent image analyzer (LAS-3000mini; Fuji Film), fitting was performed with the nonlinear least-squares method using MULTI software (Yamaoka et al., 1981) with the damping Gauss-Newton algorithm method.
Results
The Expression and Cellular Localization of Chimeric OATP1B1 Proteins (1B1-TM1-3, 1B1-TM1-6, 1B1-TM1-7, 1B1-TM1-8, and 1B1-TM1-9). To estimate the normalized Vmax value of the uptake clearance of EG and E-sul in HEK293 cells expressing each chimeric OATP1B1 protein by the relative protein expression level, Western blot analysis was performed using the crude membrane fraction obtained from HEK293 cells expressing each chimeric protein, and the band density of each chimeric protein was compared with that of wild-type OATP1B1 (Fig. 2). The specific band corresponding to each chimeric protein was observed at approximately 70 to 80 kDa (Fig. 2A), as shown previously (Iwai et al., 2004). The band density of wild-type OATP1B1 was proportional to the protein amount of the loaded sample within the range of 10 to 40 μg of protein/lane (Fig. 2B). Using the graph in Fig. 2B as a calibration curve, the ratio of the expression level of each chimeric protein to that of wild-type OATP1B1 was estimated (Fig. 2C).

Eadie-Hofstee plots for the transport of E-sul and EG by HEK293 cells expressing each chimeric OATP1B1 protein. The concentration dependence of E-sul (A) and EG (B) uptake is shown as Eadie-Hofstee plots. The uptake of E-sul (for 0.5 min) and EG (for 2 min) was measured in various concentrations (0.03-100 μM) in each transfectant. The transport velocity of E-sul and EG was normalized by the expression level of each chimeric OATP1B1 protein determined by Western blot analysis as shown in Fig. 2. Each point and bar represents the mean ± S.E. (n = 6-9). Each line represents the fitted curve calculated by nonlinear regression based on the equation described under Materials and Methods.
Furthermore, the cellular localization of each chimeric OATP1B1 protein was investigated by immunocytochemical staining (Fig. 3). All of the chimeric OATP1B1 proteins (1B1-TM1-3, 1B1-TM1-6, 1B1-TM1-7, 1B1-TM1-8, and 1B1-TM1-9) as well as wild-type OATP1B1 were predominantly localized on the cell surface of HEK293 cells. No signal was observed in vector-transfected HEK293 cells.
The Kinetic Properties of the Uptake of EG and E-sul in Chimeric OATP1B1 Proteins (1B1-TM1-3, 1B1-TM1-6, 1B1-TM1-7, 1B1-TM1-8, and 1B1-TM1-9). Transport kinetics of EG and E-sul in each chimeric and wild-type protein can be explained by the one-saturable component (Fig. 4; Table 1). In 1B1-TM1-9, the uptake clearance of EG and E-sul was not large enough to estimate the reliable kinetic parameters (EG, 2.9 ± 1.1 μl/min/mg protein; E-sul, 4.4 ± 0.2 μl/min/mg protein). The Km value of E-sul in each chimeric OATP1B1 protein was greatly increased, and its uptake clearance was decreased, as the number of substituted TMs with those of OATP1B3 was increased (Fig. 4A). In contrast, the uptake clearance of EG was decreased mainly as a result of the decrease in Vmax value, as the number of substituted TMs with those of OATP1B3 was increased, whereas the substitution of TM1-8 caused the slight increase in the Km value of EG (Fig. 4B).
Kinetic parameters for the transport of E-sul and EG by HEK293 cells expressing each chimeric OATP1B1 protein
Data shown in Fig. 4 were used to determine these parameters calculated using nonlinear regression analysis as described under Materials and Methods. Each parameter represents the mean ± computer-calculated S.D.
The Expression and Cellular Localization of Single TM-Substituted OATP1B1 Proteins (1B1-TM7, 1B1-TM8, and 1B1-TM9). To estimate the normalized Vmax value of the uptake clearance of EG and E-sul in HEK293 cells expressing each chimeric OATP1B1 protein by the relative protein expression level, we used the same method as described above (Fig. 5). The specific band corresponding to each chimeric protein was observed at approximately 70 to 80 kDa (Fig. 5A), as shown previously (Iwai et al., 2004). The band density of wild-type OATP1B1 was proportional to the protein amount of the loaded sample within the range of 10 to 60 μg of protein/lane (Fig. 5B). Using the graph in Fig. 5B as a calibration curve, the ratio of the expression level of each chimeric protein to that of wild-type OATP1B1 was estimated (Fig. 5C).
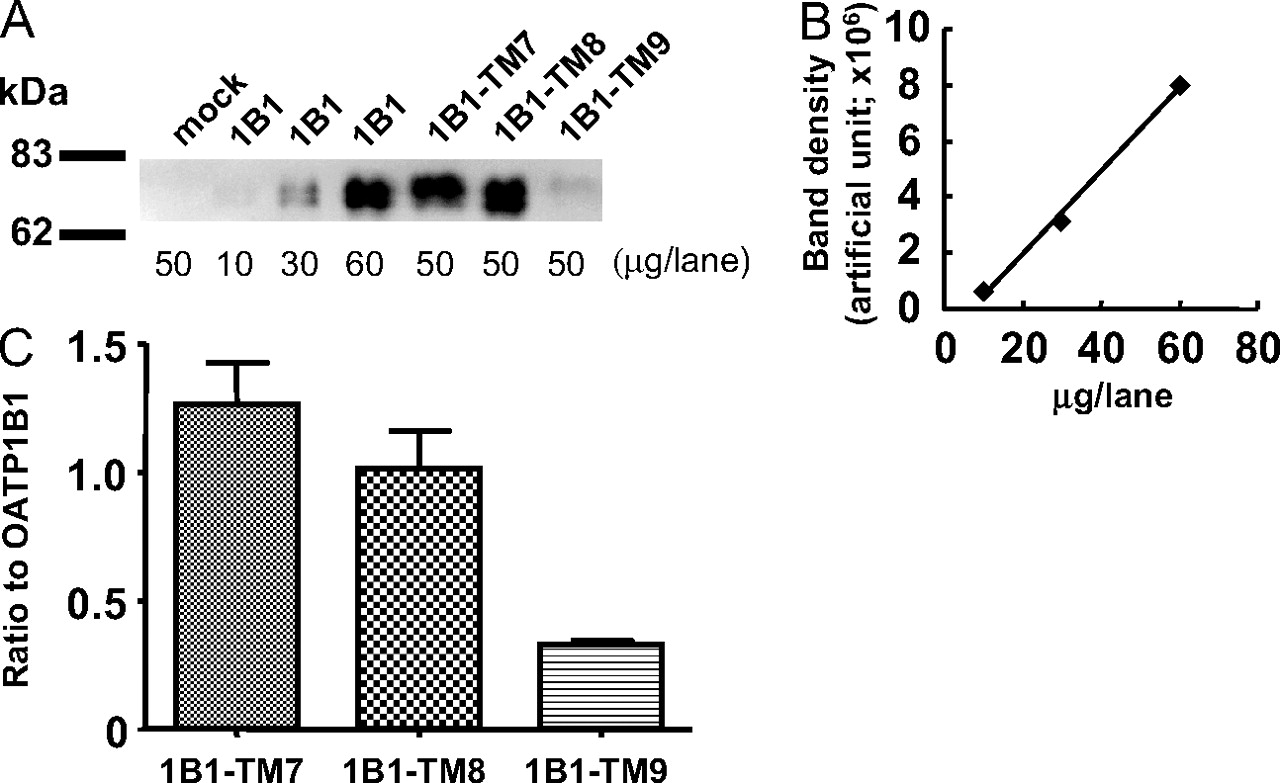
Quantification of the relative protein expression level of each single TM-substituted OATP1B1 protein in crude membrane fraction from HEK293 transfectant by Western blot analysis. Crude membrane fraction prepared from each HEK293 transfectant was separated by SDS-polyacrylamide gel electrophoresis. Wild-type OATP1B1 and various types of single TM-substituted proteins in HEK293 transfectants were detected using rabbit antiserum raised against the carboxyl terminus of human OATP1B1 (A). The amount of protein applied to each lane was indicated below the blot in each lane. The band density of wild-type OATP1B1 in various protein amounts of the loaded crude membrane fraction was quantified and plotted in B as a standard curve. Then, the ratio of the relative expression level of each chimeric protein to that of wild-type OATP1B1 was calculated using a standard curve (C). Each bar represents the mean ± S.E. of three independent determinations.

Immunolocalization of single TM-substituted OATP1B1 proteins in HEK293 cells. Wild-type and single TM-substituted OATP1B1 proteins (green fluorescence) and nuclei (blue fluorescence) were stained using the rabbit antiserum raised against the carboxyl terminus of OATP1B1 and TO-PRO-3 iodide, respectively. Each figure represents the immunocytochemical staining of HEK293 cells expressing OATP1B1 (B), 1B1-TM7 (C), 1B1-TM8 (D), and 1B1-TM9 (E) as well as vector-transfected control cells (A).
Furthermore, the cellular localization of each single TM-substituted OATP1B1 protein was investigated by immunocytochemical staining (Fig. 6). 1B1-TM7, 1B1-TM8, and 1B1-TM9 as well as wild-type OATP1B1 were predominantly localized on the cell surface of HEK293 cells. No signal was observed in vector-transfected HEK293 cells.
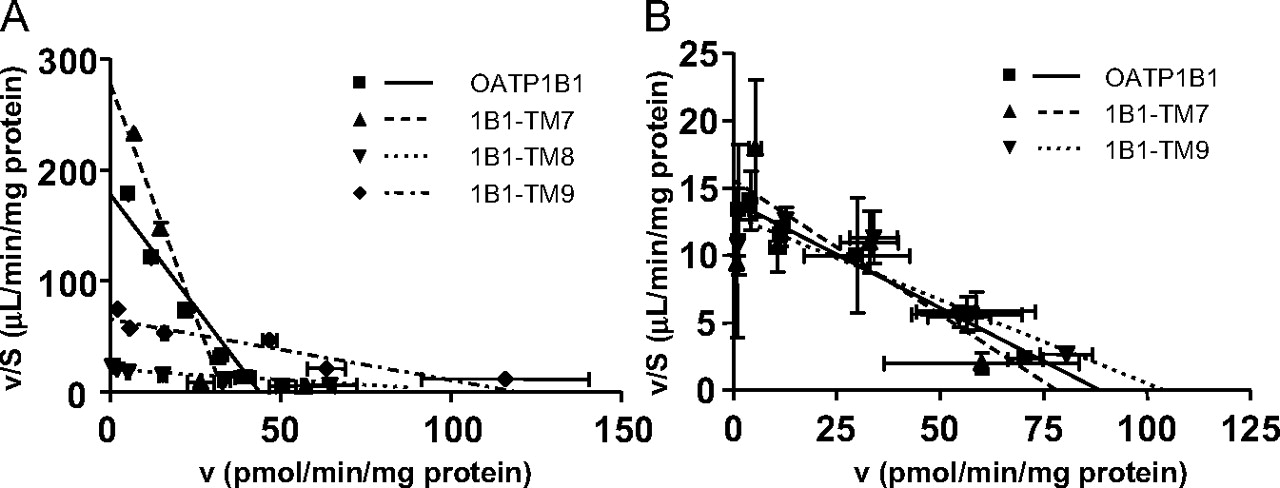
The Kinetic Properties of the Uptake of EG and E-sul in Single TM-Substituted OATP1B1 Proteins (1B1-TM7, 1B1-TM8, and 1B1-TM9). Transport kinetics of EG and E-sul in each chimeric and wild-type protein can be explained by the one-saturable component judging from Eadie-Hofstee plots (Fig. 7; Table 2). In 1B1-TM8, we could not observe any significant specific uptake of EG compared with the vector-transfected control HEK293 cells. The substitution of TM7 with that of OATP1B3 did not greatly affect the transport kinetics of E-sul and EG. However, the transport activity of E-sul and EG was drastically decreased in 1B1-TM8, and the Km value for the transport of E-sul was increased 18-fold. Moreover, interestingly, the substitution of TM9 resulted in a 7.4-fold increase in the Km value of E-sul, whereas that for EG was not significantly changed.
Kinetic parameters for the transport of E-sul and EG by HEK293 cells expressing each single TM-substituted OATP1B1 protein
Data shown in Fig. 7 were used to determine these parameters calculated by nonlinear regression analysis as described under Materials and Methods. Each parameter represents the mean ± computer-calculated S.D.
Discussion
In the present study, we constructed HEK293 cell lines expressing several kinds of chimeric OATP1B1 transporters and observed the transport kinetics of E-sul and EG to determine which TMs are important for substrate recognition by OATP1B1.
We first constructed a set of chimeric transporters in which TMs at the N terminus originated from OATP1B3 and those at C terminus from OATP1B1 and investigated the transport kinetics of EG (a substrate common to OATP1B1 and OATP1B3) and E-sul (a substrate preferentially accepted by OATP1B1). All of the chimeric OATP1B1 proteins were confirmed to be expressed in HEK293 cells by Western blot analysis and immunocytochemical staining. In Fig. 2A, the apparent molecular mass of chimeric OATP1B1 proteins was significantly larger compared with wild-type OATP1B1. Our previous results indicated that the apparent molecular mass of OATP1B3 judged from Western blot analysis was significantly larger than that of OATP1B1 in our HEK293-based expression system (Hirano et al., 2004). Because chimeric OATP1B1 proteins have an N-terminal region identical to that of OATP1B3 and putative binding sites of N-glycosylation in OATP1B3 can be found in the second outer loop, chimeric OATP1B1 proteins may be highly glycosylated, and their apparent molecular mass may be larger compared with wild-type OATP1B1.

Eadie-Hofstee plots for the transport of E-sul and EG by HEK293 cells expressing each single TM-substituted OATP1B1 protein. The concentration dependence of E-sul (A) and EG (B) uptake is shown as Eadie-Hofstee plots. The uptake of E-sul (for 0.5 min) and EG (for 5 min) was measured in various concentrations (0.03-100 μM) in each transfectant. The transport velocity of E-sul and EG was normalized by the expression level of each single TM-substituted OATP1B1 protein determined by Western blot analysis as shown in Fig. 5. Each point and bar represents the mean ± S.E. (n = 6-9). Each line represents the fitted curve calculated by nonlinear regression based on the equation described under Materials and Methods.
By immunocytochemical staining, all of the chimeric proteins were found to be mainly localized on the cell surface as with wild-type OATP1B1 (Fig. 3), suggesting that substitution of TMs in OATP1B1 does not affect the correct sorting of OATP1B1 protein. Because both OATP1B1 and OATP1B3 are originally expressed on the membrane surface of HEK293 cells, they may both have the important amino acids for correct membrane sorting, and substitution of TMs between OATP1B1 and OATP1B3 does not change the cellular localization of chimeric proteins.
As the result of uptake study, the Km value of E-sul in 1B1-TM1-3 was not changed compared with wild-type OATP1B1, suggesting that the binding site of E-sul may not be located at TM1-3 of OATP1B1. In contrast, substitution of TM1-6 of OATP1B1 with that of OATP1B3 resulted in the increase in its Km value and as the number of the substituted TMs increased, the Km value of chimeric protein gradually increased, and it is 27-fold larger in 1B1-TM1-8 compared with wild-type OATP1B1. Moreover, substitution of TM1-9 resulted in the marked decrease in the transport activity of E-sul. It is possible that the affinity of OATP1B1 for E-sul was further decreased by the substitution of TM1-9, although we cannot estimate its Km value. These results suggest that the latter half of OATP1B1 as well as TM4-6 may be important for the specific substrate recognition of E-sul by OATP1B1. In the case of EG, its Km value was not largely changed by the substitution of TMs, although it was 2.3-fold higher in 1B1-TM1-8 than in wild-type OATP1B1. In contrast, the Vmax value gradually decreased as the number of substituted TMs increased, suggesting that the translocation efficiency of EG by chimeric transporter may be decreased. In contrast, the binding site of EG was interchangeable between OATP1B1 and OATP1B3, although the binding affinity of EG to OATP1B3 (24.6 μM) (Hirano et al., 2004) was lower than that to OATP1B1.
Next, we focused on the latter part of OATP1B1 by searching the specific recognition sites of E-sul in OATP1B1 using single TM-substituted chimeric proteins because the homology of amino acid sequence in the latter part of TMs is relatively low compared with that in the earlier part of the sequence. Immunocytochemical staining revealed that all of the single TM-substituted OATP1B1 proteins are mainly localized on the cell surface as with wild-type OATP1B1 (Fig. 6), also suggesting that substitution of single TM in OATP1B1 does not affect the correct sorting of OATP1B1 protein.
Substitution of TM7 in OATP1B1 with that from OATP1B3 did not change any kinetic parameters of E-sul and EG, suggesting that TM7 is interchangeable between OATP1B1 and OATP1B3. A previous report indicated that a I353T mutation in TM7 resulted in a decrease in the transport activity of E-sul and EG (Tirona et al., 2001). In our study, isoleucine is located at position 353 of TM7 of both OATP1B1 and OATP1B3, and our finding is thought to be reasonable. A recent report indicated that substitution of TM7 in OATP1B3 with that from OATP1B1 also did not decrease the transport of the OATP1B3-specific substrate CCK-8 (Gui and Hagenbuch, 2008). Therefore, it is suggested that TM7 does not determine the binding of transporter-specific substrates like E-sul by OATP1B1 or CCK-8 by OATP1B3.
On the contrary, the substitution of TM8 significantly increased by 18-fold the Km value of E-sul compared with wild-type OATP1B1 and abolished the transport activity for EG. Because the transport activity for EG was approximately 8% of that for E-sul in wild-type OATP1B1, it might be possible that an increase in the Km value to the same extent of E-sul results in the undetectable uptake of EG by 1B1-TM8. Therefore, TM8 is critical for EG and E-sul substrate recognition by OATP1B1, and it is not interchangeable with that of OATP1B3. Tamai et al. (2001) showed that the saturable transport of E-sul by OATP1B1 consists of two saturable components, although we could not find its biphasic saturation in our experiments. Tamai et al. (2001) reported that only the high-affinity site of E-sul transport is inhibited by EG, whereas its low-affinity site is not inhibited by EG. It may be possible that TM8 in OATP1B1 works as a high-affinity binding site for E-sul. A previous report indicated that substitution of TM8 in OATP1B3 with that from OATP1B1 resulted in a partial decrease in the transport of CCK-8 (Gui and Hagenbuch, 2008). These results suggest that TM8 may partially determine the difference in the substrate specificity between OATP1B1 and OATP1B3.
Interestingly, the Km value of E-sul was 7.4-fold higher in 1B1-TM9 than in wild-type OATP1B1, whereas that of EG was not significantly changed. Thus, it is suggested that TM9 and TM8 play an important role in the substrate recognition of E-sul by OATP1B1. Regarding the EG transport, it is possible that TM9 is not important for the substrate recognition of EG or that it has a binding site for EG, which can be interchangeable between OATP1B1 and OATP1B3. We cannot discriminate between these two possibilities at this time.
Comparing the amino acid sequence of TM8 and TM9 between OATP1B1 and OATP1B3, six and 11 of 21 amino acids are different, respectively. Some of these amino acids are considered to determine the substrate recognition of EG and E-sul by OATP1B1. The transport kinetics of EG and E-sul will be required to be observed using mutated proteins, whose single amino acid in TM8 or TM9 is replaced with the other, to show the important binding sites for EG and E-sul in OATP1B1.
In conclusion, we found that TM8 in OATP1B1 is critical for the transport of E-sul and EG, whereas TM9 in OATP1B1 is also important for the transport of E-sul. However, for EG it is interchangeable with that from OATP1B3. The present data provide insight into the structure-activity relationship of OATP1B1 and help us to understand the very broad, yet specific substrate specificity of OATP1B1.
Footnotes
-
This study was supported by a grant-in-aid for scientific research (A) from the Ministry of Education, Culture, Sports, Science and Technology (MEXT) of Japan [Grant KAKENHI: 20249008].
-
doi:10.1124/jpet.108.148411.
-
ABBREVIATIONS: OATP, organic anion transporting polypeptide; TM, transmembrane domain; EG, estradiol-17β-d-glucuronide; E-sul, estrone-3-sulfate; SN-38, 7-ethyl-10-hydroxycamptothecin; CCK-8, cholecystokinin octapeptide; HEK, human embryonic kidney; PBS, phosphate-buffered saline; TTBS, Tris-buffered saline containing 0.05% Tween 20.
- Received November 7, 2008.
- Accepted February 23, 2009.
- The American Society for Pharmacology and Experimental Therapeutics


