


Abstract
Within the family of serotonin receptors, the 5-hydroxytryptamine-3 (5-HT3) receptor is the only ligand-gated ion channel. It is composed of five subunits, of which the 5-HT3A and 5-HT3B subunits are best characterized. Several studies, however, have reported on the functional diversity of native 5-HT3 receptors, which cannot solely be explained on the basis of the 5-HT3A and 5-HT3B subunits. After our discovery of further putative 5-HT3 serotonin receptor-encoding genes, HTR3C, HTR3D, and HTR3E, we investigated whether these novel candidates and the isoform 5-HT3Ea are able to form functional 5-HT3 receptor complexes. Using immunofluorescence and immunoprecipitation studies of heterologously expressed proteins, we found that each of the respective candidates coassembles with 5-HT3A. To investigate whether the novel subunits modulate 5-HT3 receptor function, we performed radioligand-binding assays and calcium-influx studies in human embryonic kidney 293 cells. Our experiments revealed that the 5-HT3C,5-HT3D, 5-HT3E, and 5-HT3Ea subunits alone cannot form functional receptors. Coexpression with 5-HT3A, however, results in the formation of functional heteromeric complexes with different serotonin efficacies. Potencies of two agonists and antagonists were nearly identical with respect to homomeric 5-HT3A and heteromeric complexes. However, 5-HT showed increased efficacy with respect to 5-HT3A/D and 5-HT3A/E receptors, which is consistent with the increased surface expression compared with 5-HT3A receptors. In contrast, 5-HT3A/C and 5-HT3A/Ea receptors exhibited decreased 5-HT efficacy. These data show for the first time that the novel 5-HT3 subunits are able to form heteromeric 5-HT3 receptors, which exhibit quantitatively different functional properties compared with homomeric 5-HT3A receptors.
The 5-HT3 receptor is the only ligand-gated ion channel (LGIC) within the family of serotonin (5-hydroxytryptamine, 5-HT) receptors (Hoyer et al., 2002). Based on structural and functional homologies, the nicotinic acetylcholine receptor and the 5-HT3 receptor are most closely related; both are cation channels. The 5-HT3 receptor is formed by a pentameric complex and is permeable to Na+,K+, and Ca2+. Binding of serotonin to the 5-HT3 receptor leads to a fast excitatory response of the neuron.
After cloning of the human HTR3A gene (Belelli et al., 1995; Miyake et al., 1995), findings concerning variable receptor compositions and properties led to the hypothesis that further 5-HT3 receptor subunits and isoforms should exist (Hussy et al., 1994; Jackson and Yakel, 1995; Fletcher and Barnes, 1998). This hypothesis was confirmed by the cloning of the human HTR3B gene (Davies et al., 1999) and of two different human splice variants of the HTR3A gene (Brüss et al., 2000). To date, HTR3A and HTR3B (Belelli et al., 1995; Miyake et al., 1995; Davies et al., 1999) are well characterized. 5-HT3A subunits are able to form functional homooligomeric receptors after expression in Xenopus laevis oocytes or human embryonic kidney (HEK) 293 cells, whereas 5-HT3B subunits cannot build a functional homopentameric receptor on their own (Belelli et al., 1995; Miyake et al., 1995; Davies et al., 1999; Dubin et al., 1999). Recombinant homooligomeric 5-HT3A receptors show extremely reduced channel conductance compared with native receptors, whereas heteromeric complexes composed of both 5-HT3A and 5-HT3B subunits more closely resemble the properties of the native receptors (Davies et al., 1999). Because the complexity within the 5-HT3 receptor system can still not solely be explained by differences in 5-HT3A and 5-HT3B subunit composition, we have investigated whether additional 5-HT3 receptor genes reside in the human genome. We isolated novel HTR3 homologous genes termed “HTR3-like genes” HTR3C, HTR3D, and HTR3E (Niesler et al., 2003) based on comparative sequence analysis. The putative 5-HT3C, 5-HT3D, and 5-HT3E subunits share key features with common 5-HT3 subunits and are most closely related to the 5-HT3 receptor family (Reeves and Lummis, 2002; Niesler et al., 2003). 5-HT3C and 5-HT3E present a huge N-terminal extracellular segment containing a cysteine loop, four hydrophobic transmembrane regions, a large intracellular loop between the third and fourth transmembrane region, and an extracellular C terminus. In contrast, the architecture of the 5-HT3D subunit is rather different. It lacks the signal sequence and the large N-terminal region, including the ligand binding site. This raises the question of whether the 5-HT3D subunit itself is able to form a functional ion channel or whether it is part of a ligandgated ion channel showing only some of the crucial elements of a 5-HT3 subunit. Unlike the other known HTR3 genes that are almost ubiquitously expressed in the central nervous system and in the periphery, HTR3D is predominantly and HTR3E is exclusively expressed in the gastrointestinal (GI) tract (Niesler et al., 2003). This has given rise to the hypothesis that the novel 5-HT3D and 5-HT3E subunits may act as modulators of 5-HT3 function in the gastrointestinal tract (Karnovsky et al., 2003; Niesler et al., 2003).
5-HT3 receptors are of particular interest because of their therapeutic potential and pathophysiological implications. 5-HT3 receptor antagonists are used to treat emesis and nausea caused by radiotherapy or chemotherapy in patients with cancer and are the only effective treatment of diarrhea-predominant irritable bowel syndrome (Gregory and Ettinger, 1998; Gershon, 2005; Mawe et al., 2006).
In this study, we investigated whether the novel putative HTR3 genes encode functional 5-HT3 subunits. Using immunofluorescence and immunoprecipitation of recombinantly expressed proteins, we explored whether they are able to form 5-HT3 receptors. In addition, ligand-binding studies and calcium-influx analyses were performed to reveal whether they modulate 5-HT3 receptor function.
Materials and Methods
Cell Culture and Transfection
HEK293 cells were cultured as recommended and were grown to a relative density of 40 to 70%. For immunofluorescence and immunoprecipitation analysis, cells were transfected by Fugene (Roche, Mannheim, Germany): 0.250 μg (per well of a 12-well plate) and 10 μg (per 6-cm dish) plasmid DNA. Equal amounts of constructs were used in all transfections. The DNA mixtures were as follows: 1) for the particular subunits, one half of subunit cDNA and one half of salmon sperm DNA; 2) combination of 5-HT3A with another subunit, one half of each subunit cDNA; and 3) negative control, pcDNA3 (mock transfection). For radioligand binding assays, transfections were performed by TransIT-293 (Mobitec, Goettingen, Germany) using 35 μg of DNA per 175-cm2 flask. The mixtures of cDNAs were the following: 1) for the particular subunits, one half of subunit cDNA and one half of salmon sperm DNA; and 2) combination of 5-HT3A with another subunit, one half of each subunit cDNA. For aequorin assays 15 μg of plasmid DNA per 75-cm2 flask were transfected. The DNA mixtures were as follows: 1) for the particular subunits, one third of apoaequorin cDNA, one third of subunit cDNA, and one third of salmon sperm DNA; and 2) combination of 5-HT3A with another subunit, one third of apoaequorin cDNA, and one third of each subunit cDNA. Cells were analyzed 48 h after transfection. During cultivation, cells were maintained in a humidified atmosphere at 37°C and 5% CO2.
Expression Constructs
All human 5-HT3 subunits encoding cDNAs from HTR3A, HTR3B, and the HTR3-like genes HTR3C, HTR3D, HTR3E, and HTR3Ea (GenBank accession numbers D49394, AF080582, AF459285, AY159812, AY159813, and DQ644022, respectively) were cloned into the expression vector pcDNA3 (Invitrogen, Karlsruhe, Germany). To allow detection of the encoded protein by Western blot analysis and in immunofluorescence experiments, Myc (EQKLISEEDL) and HA (YPYDVPDYA) epitope tags were introduced after the signal sequence: HA and Myc tag was introduced into the 5-HT3A subunit at positions 29 and 30 (TT, as described previously by Boyd et al., 2002). The 5-HT3B, 5-HT3E, and 5-HTEa subunits were tagged by the Mycepitope between amino acids 5 and 6 (P/Q, as described before by Boyd et al., 2002), 120 and 121, and 105 and 106 (EE), respectively. In case of the 5-HT3C and 5-HT3D subunits, the HA-epitope was inserted between amino acids 105 and 106 (KE) and 37 and 38 (ER), respectively (Supplemental Fig. S1). A mutant of the 5-HT3A subunit was constructed by site-directed mutagenesis in which the tryptophan residue 178 was replaced by serine using the QuikChange site-directed mutagenesis system (Stratagene, La Jolla, CA). This mutant was HA- and Myc-tagged at the same site as the 5-HT3A wild-type subunit for immunofluorescence experiments. After cloning, the fidelity of the cDNA sequences was verified by sequence analysis using the MEGABACE system from GE Healthcare (Munich, Germany) as indicated by the manufacturer. We carried out aequorin assays for the respective subunits to test the functional consequences of the epitope. Epitope-tagged subunits also formed LGICs together with the tagged 5-HT3A subunit with analogous properties compared with the untagged subunits (data not shown). The aequorin cDNA (GenBank accession number L29571) encoding a jellyfish photoprotein was originally derived from cytAEQ/pcDNA1 (Invitrogen) and subcloned into HindIII/XbaI-digested pcDNA 3.1/Zeo(+) (Invitrogen).
Drugs
5-HT, meta-chlorophenylbiguanide (mCPBG), and ondansetron hydrochloride were from Sigma (Munich, Germany). MDL72222 was from Sigma/RBI (Natick, MA). Azasetron (Y-25130) was obtained from Biotrend (Cologne, Germany). [3H]GR65630 (specific activity, 77.2 or 86 Ci/mmol) was from PerkinElmer Life and Analytical Sciences (Boston, MA).
Solutions
MDL72222 solution was prepared daily from a 10 mM dimethyl sulfoxide stock (stored at -20°C). The other drug solutions were prepared daily from aqueous stocks (stored at -20°C).
Membrane Preparation and Radioligand Binding Assay
For preparation of crude membranes, transiently transfected cells of a 175-cm2 cell culture flask were harvested 48 h after transfection and washed once with binding assay buffer (150 mM NaCl, 1.8 mM CaCl2, 1 mM MgCl2, 10 mM HEPES, and 5.4 mM KCl, pH 7.4). All steps were carried out on ice. After resuspension of the cells in 2 ml of buffer, they were homogenized with a glass potter, and homogenates were pelleted by centrifugation (1000g, 4 min, 4°C). Supernatant was recentrifuged in an ultracentrifuge (40,000g, 25 min, 4°C). After the pellet was washed once with buffer, an additional centrifugation step followed (40,000g, 25 min, 4°C). The final pellet was resuspended in 0.5 ml of buffer and homogenized by pipetting through a 0.4 × 20-mm gauge needle. Protein measurement of 10 μl of membrane suspension was done by the method of Lowry et al. (1951) using bovine serum albumin as standard. Membranes were diluted to a protein concentration of 0.33 μg/μl and stored at -80°C until use.
For saturation experiments 15 μg of membranes were incubated in triplicates with five increasing concentrations of [3H]GR65630 (0.03-3 nM) in a final reaction volume of 0.5 ml. After an incubation time of 60 min at room temperature, incubation mixes were filtered through GF/B filters (Whatman, Kent, UK) using a Brandel cell harvester and washed three times with 2 ml of ice-cold buffer. Measuring of radioactivity was carried out in a liquid scintillation counter (Beckman Coulter, Fullerton, CA). Specific binding was determined as the fraction of [3H]GR65630 that could be displaced by 100 μM MDL72222.
In one series of experiments, [3H]GR65630 binding was carried out using intact and transiently transfected HEK293 cells cultured in 24-well plates. After removal of the culture medium, cells were incubated (at room temperature for 120 min) in binding assay buffer (see above) containing 5.5 mM d-glucose and 1 nM [3H]GR65630. Nonspecific binding was determined at mock-transfected cells in the presence of 10 μM MDL72222. After three washes with ice-cold buffer, cells were solubilized with 0.1% Triton X-100; protein and radioactivity were determined from the cell lysate as described above.
Aequorin Luminescence Assay
Cell Preparation. HEK293 cells were harvested by centrifugation (180g, 4 min) 48 h after transfection and resuspended in 1.5 ml of Dulbecco's modified Eagle's medium/Ham's F-12 plus 10% fetal calf serum. From this point forward, all steps were performed under light protection. Cell suspension was supplemented with coelenterazine h (Nanolight, Pinetop, AZ) at a final concentration of 5 μM and incubated for 3 h at room temperature. After the coelenterazine incubation, cells were harvested by centrifugation (45g, 3 min) and resuspended in aequorin assay buffer (150 mM NaCl, 1.8 mM CaCl2, 5.4 mM KCl, 10 mM HEPES, and 20 mM glucose, pH 7.4) to obtain an approximate cell density of 2.5 to 3.5 × 10⁶ cells/ml. An incubation time of 10 to 20 min at room temperature followed.
Aequorin Assay. For agonist concentration-response curves, a white 96-well Teflon plate with 80 μl of the cell suspension per well was placed into a Centro LB 960 luminometer (Berthold Technologies, Bad Wildbad, Germany). Before injection of the agonist, baseline luminescence was measured for 8 s at a sampling rate of 2 Hz. After injection of 20 μl of agonist solution to the cells, light emission was recorded for 35 to 70 s at the same sampling rate.
For antagonist concentration-response curves, 60 μl of the cell suspension was added per well of a white 96-well Teflon plate. The wells were then supplemented with 20 μl of the different antagonist concentrations, mixed, and incubated for 15 min at room temperature to reach an equilibrium. The following steps were identical with the agonist-response curves.
Each drug concentration was measured in quadruplicate per transfection. After measurement of the agonist-induced light signal, remaining aequorin luminescence was determined by injecting 100 μl of a cell lysis solution [0.2% Triton X-100 (v/v) and 100 mM CaCl2] and recording luminescence at 0.5-s intervals for 15 s in the case of 5-HT maximal responses.
Data Analysis
Peak values for the concentration-response curves were obtained by subtraction of baseline luminescence from the agonist-induced peak maximum luminescence. In the case of 5-HT, maximal responses peak luminescence (RLUpeak) was normalized against total aequorin luminescence (RLUmax) after cell lysis to control for differences in transfection efficiency and cell number (RLUpeak/RLUpeak + RLUmax).
The concentration-response curves and saturation binding curves and the corresponding constants EC50 and IC50 and the binding constants Kd and Bmax were calculated by means of GraphPad Prism 4.0 (GraphPad Software Inc., San Diego, CA). Data are presented as mean ± S.E.M. Statistical analysis was performed by using ANOVA followed by Dunnett's post test. The unpaired Student's test (t test) was used to compare the results of only two groups. Differences were considered as significant with p < 0.05 (*), p < 0.01 (**), and p < 0.001 (***).
Immunofluorescence Experiments
HEK293 cells were grown on poly(d-lysine)-coated coverslips. For subcellular localization of the respective subunits by immunofluorescence experiments, we used the HA-/Myc epitope-tagged subunit cDNAs. Cells were analyzed 48 h after transfection. In brief, cells were washed twice using 1× PBS. Then they were fixed by incubation in 3.75% paraformaldehyde for 15 to 20 min. Afterward, they were washed three times for 10 min in 1× PBS at room temperature. Then cells were blocked in 2% bovine serum albumin/PBS. In case of intracellular staining (permeabilized cells), blocking solution included 0.2% saponin. The first antibodies rabbit anti-Myc Tag (Upstate, Hamburg, Germany) and rat anti-HA 3F10 (Roche) were diluted as recommended in blocking solution and applied for at least 1 h at room temperature. Afterward, cells were washed three times for 5 min each in 1× PBS at room temperature and incubated in blocking solution containing the fluorochrome-labeled secondary antibodies (goat/sheep anti-mouse Cy3/FITC and goat/sheep anti-rabbit-Cy3/FITC; Sigma) diluted as recommended for at least 1 h. From this point forward, every step was carried out light-protected. Cells were washed three times for 5 min each in 1× PBS. A nuclear counterstain with 4,6-diamidino-2-phenylindole (1:10,000) was carried out. After two washes in 1× PBS, coverslips were mounted in Mowiol (Calbiochem, Darmstadt, Germany) and stored at 4°C until confocal microscopy.
Confocal Microscopy
Confocal microscopy was performed on a Zeiss LSM510 Meta system (Zeiss, Oberkochen, Germany) equipped with a Zeiss Plan-Apochromat 63×/1.4 numerical aperture objective, 405 nm DPSS argon and green and red HeNe lasers (DPSS Lasers, Santa Clara, CA). Pictures were analyzed by the Zeiss LSM Image Examiner software.
Biotinylation of Cell Surface Proteins
Biotinylation of the cell surface proteins was carried out using the Pinpoint Cell Surface Protein Isolation Kit (Pierce Chemical, Rockford, IL). Flow-through and biotinylated cell surface proteins (captured by NeutrAvidin) were separated on 4 to 12% Bis-Tris NuPAGE Gels (Invitrogen). Gels were blotted onto PVDF membranes using the XCell system from Invitrogen, and Western blot analysis was carried out using the SuperSignal West Pico Chemiluminescent Substrate (Pierce).
Western Blot Analysis
Transfections of HEK293 cells were performed as described above. Immunoprecipitation was carried out as described previously (Boyd et al., 2002). For the immunoprecipitation of the 5-HT3A subunit, the epitope-specific anti-5-HT3A (KGVRPVRD-WRKPTTV) was used; for the 5-HT3C subunit, the anti-5-HT3C (GELAGKKLGPRETEPD) was used; and for the 5-HT3D and 5-HT3E subunits the anti-5-HT3DE (WTRAQREHEAQKQHS) antibodies, raised in rabbit and guinea pig, were used. Each cell lysate was split in half, and immunoprecipitation was performed once using the anti-5-HT3A and once using the respective anti-5-HT3C/anti-5-HT3DE antibody. Immunoprecipitated proteins were separated on 4 to 12% Bis-Tris NuPAGE gels (Invitrogen). Gels were blotted onto PVDF membranes using the XCell system from Invitrogen. Western-blotted membranes were blocked in milk buffer [1× PBS, 5% dry milk (w/v), and 0.05% Tween 20] and incubated with the first antibody mouse anti-Myc Tag 9B11 (Cell Signaling, Frankfurt, Germany) in milk buffer overnight. Then membranes were washed three times with 1× PBS/0.05% Tween 20 for 10 min and incubated for at least 3 h with the second peroxidase-conjugated goat anti-mouse antibody in milk buffer (Sigma). After a final washing step with 1× PBS/0.05% Tween 20, 10-min detection was carried out using enhanced chemiluminescence following standard protocols.

Immunofluorescence analysis of transfected HEK293 cells coexpressing Myc-/HA-tagged 5-HT3A plus one of the novel subunits (5-HT3C, 5-HT3D, 5-HT3E, and 5-HT3Ea). Surface, not permeabilized; intracellular, permeabilized. Antibodies used were rat anti-HA (3F10) and rabbit anti-Myc. Secondary antibodies were either anti-mouse-CY3 or anti-mouse-FITC, anti-rabbit-FITC, or anti-rabbit-CY3. The 5-HT3A subunit is stained in red, and the novel 5-HT3C, 5-HT3D, 5-HT3E, and 5-HT3Ea subunits are visualized in green. All cells were 4,6-diamidino-2-phenylindole-counterstained to visualize nuclei in blue. Bar, 10 μm.
Results
A plethora of data on the heterogeneity of native 5-HT3 receptors strongly suggest that in addition to the 5-HT3A and 5-HT3B subunits, other as-yet-unidentified subunits are part of native receptors and may contribute to this diversity. We reported recently on the identification of three novel putative 5-HT3 receptor genes and here address the question of whether the novel candidates represent functional components of the 5-HT3 receptor system.
5-HT3C, 5-HT3D, 5-HT3E, and 5-HT3Ea Constitute Novel Subunits of 5-HT3 Receptor Complexes. To answer the question of whether the novel 5-HT3 receptor candidates are able to form 5-HT3 receptor complexes, we carried out immunofluorescence and immunoprecipitation analysis. For this purpose, we generated HA-/Myc-epitope-tagged subunits of 5-HT3A, 5-HT3C, 5-HT3D, 5-HT3E, and the recently identified isoform 5-HT3Ea (Supplemental Figs. S1 and S2; Karnovsky et al., 2003).
Immunofluorescence Analysis. Immunofluorescence experiments of transfected HEK293 cells with and without prior permeabilization revealed that expression of neither candidate subunit alone results in membrane staining (Supplemental Fig. S3). In contrast, cotransfection experiments of the candidate subunits with epitope-tagged Myc-/HA-5-HT3A, revealed membrane staining in all cases (Fig. 1). Therefore, we propose that hetero-oligomerization of the novel subunits with the 5-HT3A subunit is required to facilitate and/or stabilize the association of receptor complexes within the cell membrane. In agreement with this finding, colocalization of the tagged 5-HT3A with the candidate subunits strongly suggests the assembly of heteromeric complexes (Fig. 1).

Western blot analysis of transfected HEK293 cells. Shown are results obtained with Myc- or HA-tagged 5-HT3A, 5-HT3C, 5-HT3D, 5-HT3E, and 5-HT3Ea, coexpressed Myc-/HA-5-HT3A plus 5-HT3C, 5-HT3D, 5-HT3E, 5-HT3Ea and pcDNA3 (mock-transfected) negative controls. Immunoprecipitated proteins (antibodies used are indicated below the blots) were separated ona4to12% Bis-Tris NuPAGE Gel (Invitrogen) after gel-run XCell blotted onto PVDF membranes as recommended by the manufacturer and then probed using the anti-Myc (9B11) antibody (Upstate) after incubation overnight. As secondary antibody, the anti-mouse-HRP (Sigma) was used, and bands were visualized using enhanced chemiluminescence following standard protocols. Exposure times were 1 to 2 min. Immunoreactive bands were detectable for Myc-5-HT3A of approximately 55 kDa (A and B) and of Myc-5-HT3E (C) and Myc-5-HT3Ea (D) of approximately 55 and 60 kDa, respectively.

Western blot analysis of transfected and biotinylated HEK293 cells. Shown are results obtained with coexpressed Myc-/HA-5-HT3A plus 5-HT3C, 5-HT3D, 5-HT3E, and 5-HT3Ea. Intracellular proteins (flow-through: F, nonbiotinylated) and biotinylated cell surface proteins (S) were separated ona4to12% Bis-Tris NuPAGE Gel (Invitrogen), after gel-run XCell-blotted onto PVDF membranes and then probed using the anti-Myc (9B11) antibody (Upstate) (A) or the anti-HA (3F10) antibody (Roche) (B) after incubation overnight. As secondary antibody, the antimouse-HRP or anti-rat-HRP (Sigma) was used, and bands were visualized using the Western Pico Kit (Pierce) as recommended. Exposure times were 30 s to 1 min. Immunoreactive bands of approximately 55 kDa for HA/Myc-5-HT3A (A and B), approximately 55 kDa for HA-5-HT3C (B), approximately 25 kDa in the case of HA-HT3D (B), and of Myc-5-HT3E and Myc-5-HT3Ea (A) of approximately 55 and 60 kDa, respectively, were detectable. The respective antibody used for immunoblot detection is indicated.
Immunoprecipitation Experiments. We were interested in whether the novel subunits are components of such respective heteromeric complexes. We carried out immunoprecipitation experiments of transfected and metabolically labeled HEK293 cells to test whether the tagged 5-HT3C, 5-HT3D, 5-HT3E, and 5-HT3Ea subunits coprecipitate with the tagged 5-HT3A subunit. Immunoreactive bands of the expected sizes were detectable: approximately 55 kDa for Myc-/HA-5-HT3A, approximately 55 kDa for HA-5-HT3C, approximately 25 kDa in the case of HA-HT3D, and approximately 60 kDa for Myc-5-HT3E/Ea. In double-transfected HEK293 cells, immunoreactive bands from both subunits were present, indicating that these subunits must have been coprecipitated (Supplemental Fig. S4). In immunoprecipitation experiments using epitope-specific anti-5-HT3A, anti-5-HT3C, and anti-5-HT3DE antibodies, we were able to prove the coprecipitation of 5-HT3C, 5-HT3D, 5-HT3E, and 5-HT3Ea with the 5-HT3A subunit (Fig. 2). In conclusion, these data further support the hypothesis that the novel subunits are part of the heteromeric 5-HT3A/C, 5-HT3A/D, 5-HT3A/E, and 5-HT3A/Ea receptor complexes.

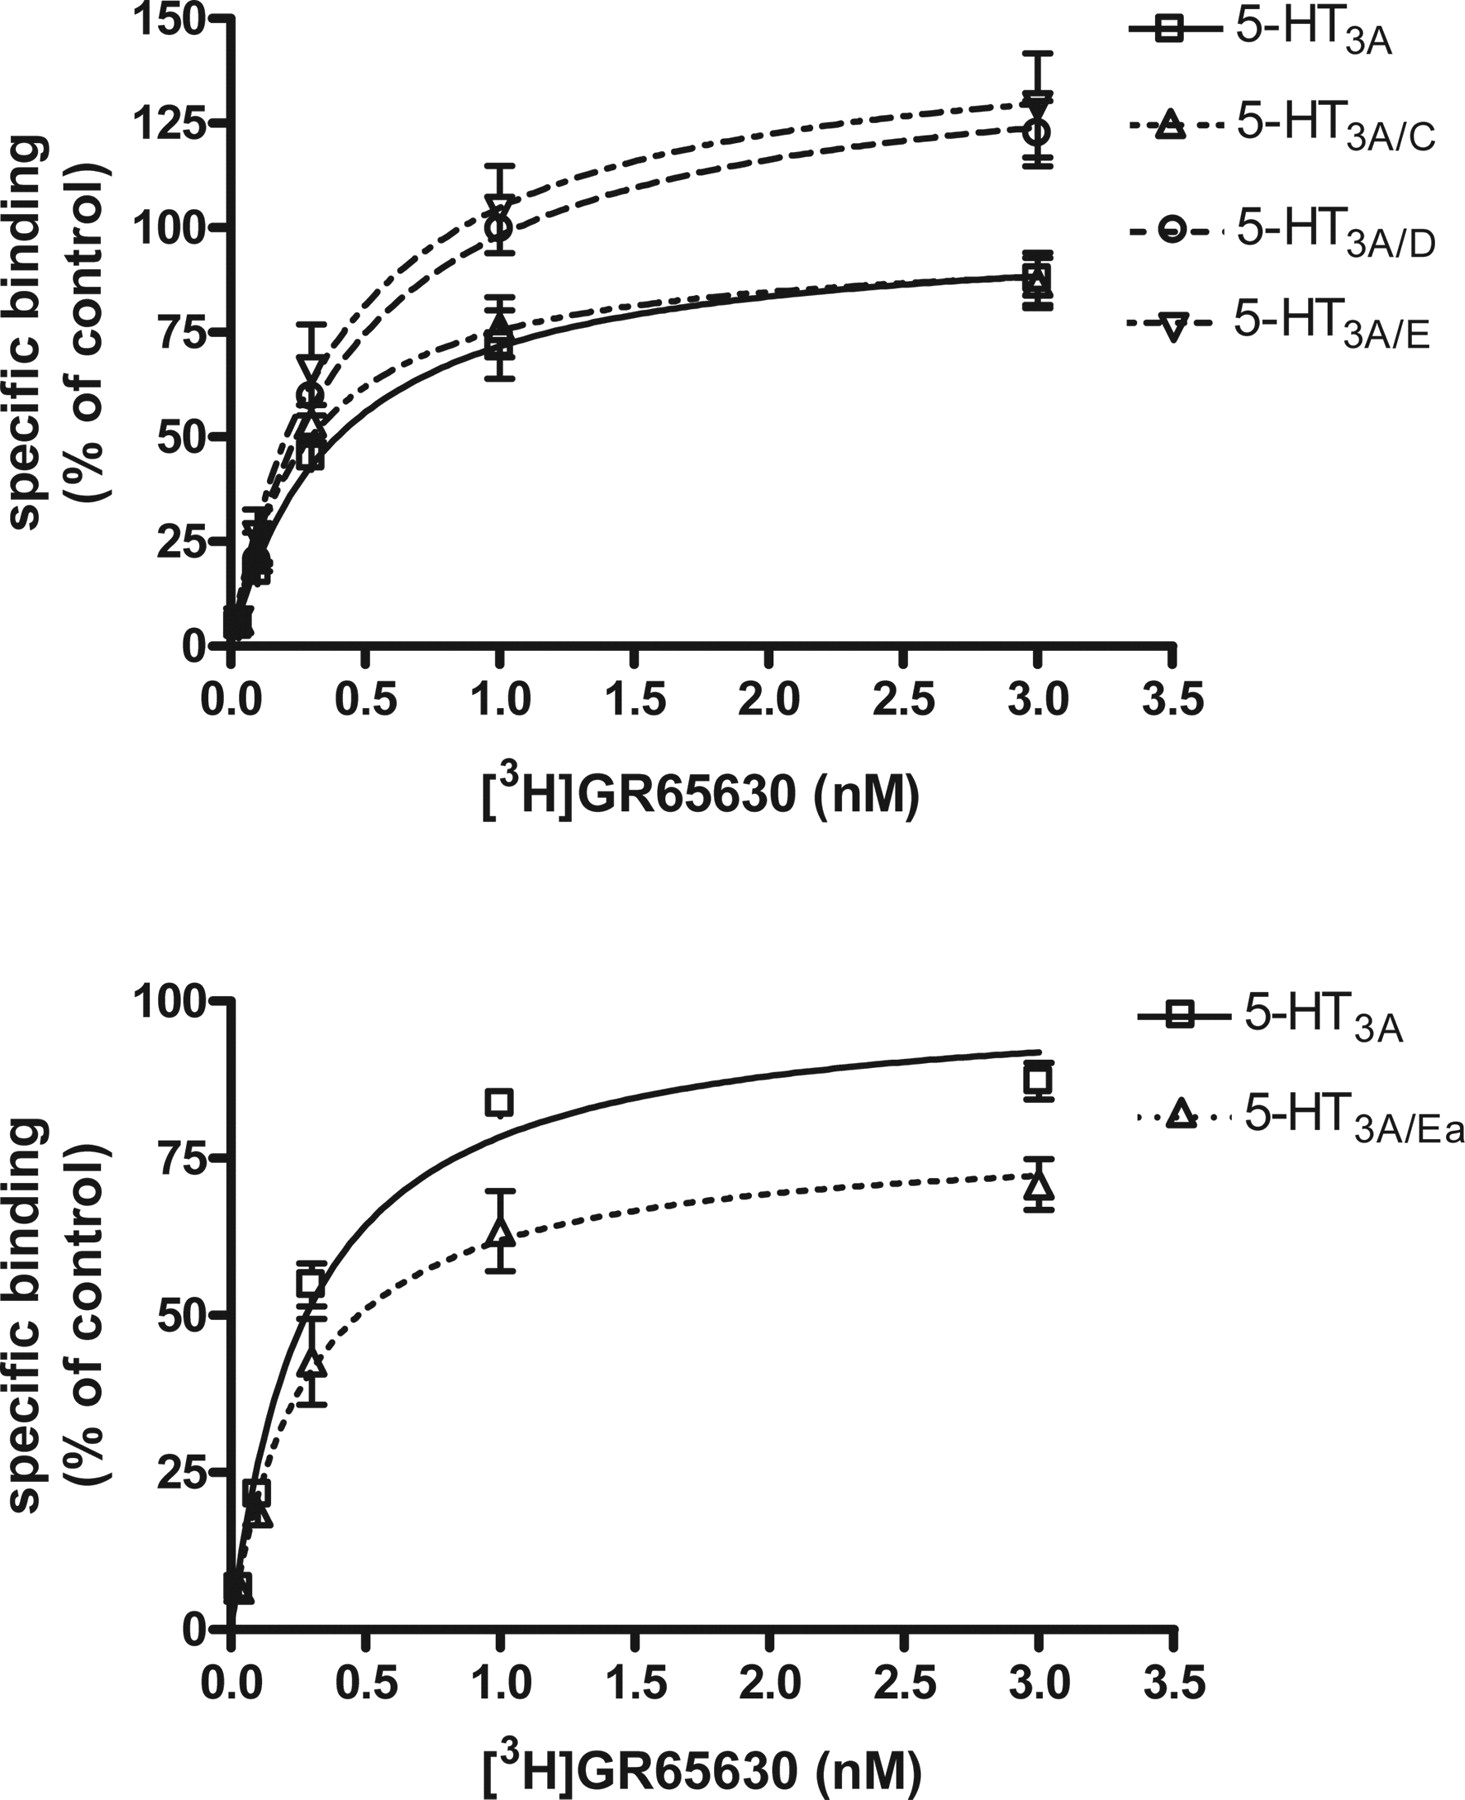
Radioligand binding studies. Saturation curves for specific (MDL72222-sensitive) binding of [3H]GR65630 (0.03-3 nM) in membranes of HEK293 cells transiently expressing various 5-HT3 subunit combinations. For each subunit combination, three to five independent experiments were performed in triplicate. Nonspecific binding in the presence of 100 μM MDL72222 was approximately 10% of overall binding. Specific binding was expressed as a percentage of control (i.e., as a percentage of the Bmax of the homopentameric 5-HT3A receptor; means ± S.E.M. of three to five experiments with separate membrane preparations). The absolute Bmax values were 6.8 ± 0.6 and 10.5 ± 0.3 pmol/mg protein for the top and bottom, respectively. The difference is due to the fact that the experiments were performed in two separate groups.
Biotinylation Experiments. To additionally investigate whether the novel subunits are part of heteromeric complexes on the cell surface, we carried out biotinylation experiments. Double-transfected HEK293 cells were analyzed to determine whether the tagged 5-HT3C, 5-HT3D, 5-HT3E, and 5-HT3Ea subunits and the tagged 5-HT3A subunit are biotinylated. In this experiment, immunoreactive bands from both subunits were present in the eluate (the intracellular, nonbiotinylated fraction) and in the biotinylated cell surface fraction on the Western blot, indicating that these subunits must have been colabeled on the cell surface (Fig. 3). In summary, these data further confirm that the novel subunits must be part of heteromeric 5-HT3A/C, 5-HT3A/D, 5-HT3A/E, and 5-HT3A/Ea receptor complexes at the cell surface.
The Novel 5-HT3 Receptor Subunits Modulate 5-HT3 Receptor Function. To investigate the pharmacological and functional properties of the novel 5-HT3 receptors, we expressed the 5-HT3C, 5-HT3D, 5-HT3E, and 5-HT3Ea subunits in HEK293 cells and performed radioligand saturation binding studies and calcium influx analyses.
Pharmacological Properties of the Novel 5-HT3 Receptor Complexes. The novel subunits expressed on their own showed no specific binding to the 5-HT3 receptor antagonist [3H]GR65630 (data not shown). To examine whether the novel subunits are able to bind the 5-HT3 receptor antagonist [3H]GR65630, HEK293 cells were cotransfected with a defined subunit cDNA and the 5-HT3AW178S mutant cDNA. The latter has been shown previously to be nonfunctional and unable to bind the 5-HT3 receptor antagonist [3H]granisetron, although it can access the cell surface (Boyd et al., 2002). We could confirm that this mutant is expressed at the cell surface and shows no specific binding of [3H]GR65630 (data not shown). Using the 5-HT3AW178Smutant, we were able to confirm these data by immunofluorescence experiments (Supplemental Fig. S5). Although the mutant was capable of transporting the 5-HT3B and the novel subunits (5-HT3C, 5-HT3D, 5-HT3E, and 5-HT3Ea) to the cell surface, the heteromeric 5-HT3 receptor composed of one of these subunits and the mutant 5-HT3A subunit exhibited no specific binding of [3H]GR65630 (data not shown). This suggests that a tryptophan residue in this region of the ligand binding domain, which is present only in the 5-HT3A subunit, is crucial for ligand recognition. Analysis of the 5-HT3A subunit alone or coexpressed with 5-HT3C, 5-HT3D, 5-HT3E, or 5-HT3Ea revealed a single binding site (Fig. 4). The Kd values did not significantly differ from each other (Table 1). All subunits but the 5-HT3C subunit led to a significant change of Bmax of the resulting receptor complex when coexpressed with 5-HT3A. Upon coexpression with 5-HT3D and 5-HT3E, the Bmax value increased to 143.6 and 147.4% (p < 0.05) compared with the Bmax value of the homopentameric 5-HT3A receptor, respectively. Conversely, coexpression of the splice variant 5-HT3Ea led to a decreased Bmax value of 81.0% (p < 0.01) (Table 1).
Relative Bmax and Kd values obtained from [3H]GR65630 saturation binding to membranes of HEK293 cells transiently expressing either homopentameric 5-HT3A receptors or heteromeric receptors of 5-HT3A with one of the novel subunits
Functional Characterization of Receptors Using the Aequorin Assay. Because patch-clamp analysis is time consuming and requires specialized technical equipment and expertise for the characterization of multiple ion channel isoforms, we have established an alternative technique for fast and effective functional analysis of the 5-HT3 subunit candidates: the aequorin assay. Based on the calcium permeability of the 5-HT3 receptor (Hargreaves et al., 1994; Rondé and Nichols, 1997; Davies et al., 1999), agonist stimulation induces a concentration-dependent influx of calcium ions through the open-channel pore, which leads to aequorin bioluminescence (Brini et al., 1995). Aequorin assays were performed using two agonists (5-HT, mCPBG) and two antagonists (azasetron, ondansetron). No response was measurable for 5-HT in the case of the novel 5-HT3 subunits expressed on their own (data not shown). Concentration-response curves at heteromeric complexes composed of the 5-HT3A together with one of the novel subunits revealed no significant differences in potency of the agonists 5-HT and mCPBG (Fig. 5, A and B; Table 2) and the antagonists azasetron (Y-25130; Fig. 5, C and D) and ondansetron (Fig. 5, E and F). However, in comparison with homomeric 5-HT3A receptors, the concentration-response curve for 5-HT at heteromeric 5-HT3A/B receptors (Fig. 5A, inset) showed the typical shift to the right together with a decrease of the Hill coefficient as described previously (Davies et al., 1999). This is a pharmacological piece of evidence for the surface expression of heteromeric 5-HT3 receptor complexes. It is remarkable that the maximum response (Emax) of 5-HT at the heteromeric receptors containing one of the novel subunits significantly differed compared with the homopentameric 5-HT3A receptor (Fig. 6). The Emax value at the 5-HT3A/C and 5-HT3A/Ea receptors was significantly reduced to 70.7 ± 10.6% (p < 0.05) and 43.9 ± 5.6% (p < 0.01), respectively, whereas an increased 5-HT maximum response was detected at the 5-HT3A/D receptor (145.8 ± 10.2%; p < 0.01) and the 5-HT3A/E receptor (144.3 ± 22.8%; p < 0.01).
pEC50 values of agonists, pIC50 values of antagonists (against the response to 10 μM 5-HT), and 5-HT maximum peak responses for calcium influx in the aequorin assay of HEK293 cells transiently expressing either homopentameric 5-HT3A receptors or heteromeric receptors of 5-HT3A with one of the novel subunits
Antagonist experiments and 5-HT maximum responses were performed in two separate groups.

Concentration-response curves for agonists and antagonists in the aequorin assay in HEK293 cells transiently expressing different 5-HT3 subunit combinations. Bioluminescence signals in the aequorin assay caused by calcium influx induced by increasing concentrations of 5-HT were measured as described under Materials and Methods. Concentration-response curves for calcium influx in the aequorin assay evoked by increasing concentrations of 5-HT (A) and mCPBG (B) are shown. Data are expressed as the percentage of the agonist maximal peak response. The inset in part A additionally shows results obtained at heteromeric 5-HT3A/B receptors (means of at least four experiments). C to F, inhibition of 5-HT (10 μM) induced calcium-influx in the aequorin assay by increasing concentrations of azasetron (C and D) and ondansetron (E and F). The antagonist was present 15 min before and during 5-HT application. Antagonist experiments were performed in two separate groups. Data are expressed as a percentage of the 5-HT (10 μM) response in the absence of the antagonist (means ± S.E.M. of three to seven independent experiments).
Discussion
This study demonstrates for the first time that the novel putative HTR3 genes encode functional components of heteromeric 5-HT3 receptor complexes. The 5-HT3C/D/E and 5-HTEa subunits are not able to form functional receptors on their own, but upon coexpression of the 5-HT3A subunit, functional heteromeric receptors are assembled. A similar result was reported previously for the 5-HT3B subunit. Unlike the 5-HT3A subunit, the 5-HT3B subunit is not able to form functional homomeric receptors (Davies et al., 1999). After coexpression of the 5-HT3A and 5-HT3B subunits, heteromeric receptors are formed, displaying properties of native neuronal receptors (Davies et al., 1999). Immunofluorescence and immunoprecipitation data clearly showed that the 5-HT3A plus the 5-HT3C, 5-HT3D, 5-HT3E, and 5-HT3Ea subunit participate in the complex formation of the receptor. Similar results were obtained by analyzing HEK293 cells coexpressing HA-5-HT3A together with HA-5-HT3B (Supplemental Fig. S6). Furthermore, biotinylation experiments confirmed the incorporation of the coexpressed subunits into the cell membrane at the cell surface. In addition, immunofluorescence data suggest that the 5-HT3A subunit plays a key role in 5-HT3 receptor assembly and trafficking. We drew this conclusion because the 5-HT3C, 5-HT3D, 5-HT3E, and 5-HT3Ea receptor subunits are intracellularly retained, presumably within the endoplasmic reticulum (ER) unless coexpressed with 5-HT3A. The same phenomenon was reported for the heteromeric 5-HT3A/B receptors previously (Boyd et al., 2002). In the case of the 5-HT3B subunit, the ER-retention signal has been identified (Boyd et al., 2003). This signal is not conserved in the novel subunits (Supplemental Fig. S1). Accordingly, future analysis of the novel subunits should lead to the identification of signal sequences contributing to ER retention.
Only recently, atomic force microscopy identified the stoichiometry of 5-HT3A/B receptors as a complex of two 5-HT3A and three 5-HT3B subunits (Barrera et al., 2005). The exact stoichiometry of the individual native 5-HT3 receptors will now be investigated by subsequent analysis of 5-HT3 receptors composed of different mixtures of recombinant homo- and hetero-oligomeric 5-HT3 receptor complexes using all five 5-HT3 receptor subunits in different combinations. This will provide a far more detailed insight into the maturational, structural, and functional diversity of the 5-HT3 receptor system. Analogous data from the most closely related LGIC, the nicotinic acetylcholine receptor, revealed various stoichiometries of α, β, γ, δ, and ϵ subunits in native receptors with different properties and functions (Karlin, 2002; Le Novère et al., 2002).
The aequorin assay was used previously for measurement of intracellular Ca2+ levels (Brini et al., 1995). We have used this method for the first time for the characterization of 5-HT3 receptors. Our results clearly show that this assay is a valuable tool for the fast analysis of serotonin type 3 receptors and demonstrate that pharmacological characteristics of the 5-HT3 receptor are similar to those reported using other functional methods. More established in the analysis of Ca2+-permeable channels is the fluorescence imaging plate reader assay using Ca2+-sensitive dyes (Fitch et al., 2003). The 5-HT3 receptor analysis has been described using Ca2+ and membrane potential-sensitive fluorescent dyes (Price and Lummis, 2005). The main advantage in using the aequorin method is that exclusively transfected cells are measured, and background problems are largely avoided (Brini et al., 1995). In the aequorin assays, all heteromeric 5-HT3 receptors containing the novel subunits exhibited pharmacological properties similar to those of homomeric 5-HT3A receptors for the agonists 5-HT and mCPBG and for inhibition of the 5-HT response by the 5-HT3 receptor antagonists ondansetron and azasetron (Y-25130). Although heteromeric 5-HT3A/B receptors show some distinct differences compared with homomeric 5-HT3A receptors (e.g., for 5-HT; see also present study), the overall pharmacological profiles are very similar. The 5-HT3B receptor subunit was reported to predominantly alter the biophysical rather than the pharmacological properties of the 5-HT3 receptor (Brady et al., 2001). Yet distinct pharmacological properties using structurally different compounds and 5-HT3 receptors of diverse composition of more than two different subunits cannot be excluded. However, we can rule out that the novel subunits contain a 5-HT3 ligand binding site, which may contribute to pharmacological effects. This is based on the fact that coexpression (at the cell surface) of the novel subunits together with the ligand binding-incapable 5-HT3AW178S mutant did not show any binding of [3H]GR65630.

Maximal peak responses (Emax) evoked by 5-HT (10 μM) induced calcium influx in the aequorin assay of HEK293 cells transiently transfected with various 5-HT3 subunit combinations. Experiments were performed in two separate groups. Responses were normalized by dividing the agonist-induced peak luminescence (RLUpeak) by the overall aequorin peak luminescence [RLUmax, agonist induced peak luminescence plus the peak luminescence after cell lysis by 50 mM CaCl2 containing 0.1% (v/v) Triton X-100]. Data are expressed as a percentage of the Emax of the homopentameric 5-HT3A receptor (percentage of control). Bars represent means ± S.E.M. of 10 to 12 independent experiments. Significant differences (repeated ANOVA followed by Dunnett's post test) compared with the homopentameric 5-HT3A receptor are indicated with *, p < 0.05, and **, p < 0.01.
Although in the present study 5-HT had a similar potency at all examined receptor complexes containing the novel subunits, it exhibited different efficacies compared with homopentameric 5-HT3A receptors (Table 2 and Fig. 6). This may be due to either different Ca2+ permeabilities, distinct biophysical properties (receptor kinetics or single channel conductance), or different receptor densities on the cell surface. In our experiments, 5-HT3A/D and 5-HT3A/E receptors showed increased relative Emax and Bmax values of approximately 145% compared with homomeric 5-HT3A receptors. Because the ligand binding properties are not changed, the increased efficacies at these heteromeric receptors are obviously caused by an enhanced surface expression. Thus, both the 5-HT3D and the 5-HT3E subunits seem to interact with the 5-HT3A subunit and influence the trafficking of functional 5-HT3 receptors to the cell membrane. In addition, heteromeric 5-HT3A/C and 5-HT3A/Ea receptors exhibited a reduced relative maximum response of approximately 71 and 44%, respectively (Table 2). However, the relative Bmax values indicate no decrease in receptor densities of 5-HT3A/C receptors and only a reduction by 19% of 5-HT3A/Ea receptors (Table 1). Therefore, the stronger reduction of the relative maximum effect is compatible with the view of reduced Ca2+ permeabilities. For further characterization of the biophysical properties of heteromeric receptors composed of different 5-HT3A, 5-HT3B, 5-HT3C, 5-HT3D, and 5-HT3E subunits, patch-clamp analyses are warranted.
It is striking that HTR3D is predominantly and HTR3E and HTR3Ea are exclusively expressed in the GI tract. 5-HT3 receptors are known to be key players in motor-sensory control of normal GI function and sensitivity (Gershon, 2005; Mawe et al., 2006). Therefore, we hypothesize that the novel subunits may play a crucial role in the enteric nervous system and may be involved in functional diseases of the GI tract, including irritable bowel syndrome. Because the majority of data of 5-HT3 receptors are extrapolated from animal studies in mice and rat (Gershon, 2004; Chameau and van Hooft, 2006) and the novel subunits apparently are absent in rodents (Karnovsky et al., 2003), the investigation of the human GI tract is warranted to elucidate the role of the different 5-HT3 receptors in the enteric nervous system.
In addition, 5-HT3 receptors are attractive targets for the treatment of functional bowel disorders. To date, 5-HT3 receptor antagonists are the only effective treatment for diarrhea-predominant irritable bowel syndrome (Andresen and Camilleri, 2006; Mawe et al., 2006). In addition, chemotherapy- and radiotherapy-induced emesis and nausea of patients with cancer are routinely treated by 5-HT3 receptor antagonists (Gregory and Ettinger, 1998). Therefore, side effects like constipation, dizziness, and headache up to complications such as ischemic colitis present a major problem. New drugs with fewer side effects and a higher selectivity for a certain as-yet-undefined 5-HT3 receptor complex are highly desirable.
In conclusion, we show for the first time that the novel 5-HT3C, 5-HT3D, 5-HT3E, and 5-HT3Ea receptor subunits form serotonin receptors upon coexpression of the 5-HT3A subunit and modulate 5-HT3 receptor function in HEK293 cells. Our results have significant implications because the novel 5-HT3 receptor subunits may help to elucidate functional and regulatory processes in the serotonin receptor system.
Acknowledgments
We thank the people who contributed to this work: Gundula Hesse and Natalie Kopp for technical assistance, and Veronika Neubrand who helped us to establish the immunofluorescence experiments. We thank Michel Emerit for his information concerning the immunostaining of HEK293 cells. We acknowledge the kind support of Rainer Pepperkok who enabled us to carry out the immunofluorescence imaging at the Advanced Light Microscopy Facility of the European Molecular Biological Laboratories in Heidelberg. We are also grateful to Rüdiger Blaschke, Nadja Muncke Del, and Elyanne Ratcliffe for discussion and helpful comments on the manuscript.
Footnotes
-
This study was supported by the German Federal Ministry for Education and Research in the National Genome Research Network NGFN-2 EP (B.N.) and the Deutsche Forschungsgemeinschaft (M.B. and M.G.). Parts of this work were presented previously at the SfN Neuroscience Meeting 2006 in Atlanta, GA, as a poster presentation (number 625.5).
-
ABBREVIATIONS: 5-HT, 5-hydroxytryptamine, serotonin; LGIC, ligand-gated ion channel; HEK, human embryonic kidney; mCPBG, meta-chlorophenylbiguanide; GI, gastrointestinal; HA, hemagglutinin; PBS, phosphate-buffered saline; ANOVA, analysis of variance; FITC, fluorescein isothiocyanate; RLU, relative light unit; PVDF, polyvinylidene difluoride; ER, endoplasmic reticulum; HRP, horseradish peroxidase; MDL72222, 3-tropanyl-3,5-dichlorobenzoate; Y-25130, azasetron; [3H]GR65630, [3H]3-(5-methyl-1H-imidazol-4-yl)-1-(1-methyl-1H-indol-3-yl)-1-propanone.
-
↵
 The online version of this article (available at http://molpharm.aspetjournals.org) contains supplemental material.
 - Received October 24, 2006.
- Accepted March 28, 2007.

- The American Society for Pharmacology and Experimental Therapeutics


