


Abstract
Signaling through A2A adenosine receptors (A2AR) regulates T lymphocyte expansion and modulates T cell receptor (TCR)-mediated effector functions in vitro. To understand the role of A2ARs in the regulation of immune response, we investigated the expression levels of this receptor in different functional lymphocyte subsets. Monoclonal anti-A2AR antibody was used to develop a flow cytometric assay to quantify the expression A2ARs on lymphocytes. We report that detectable levels of expression of A2ARs are much higher among T cells than B cells. More CD4+ than CD8+ T cells express A2ARs, but activation of T cells increases A2AR expression, predominantly in CD8+ T cells. No significant differences were found in the proportion of A2AR+ cells between CD8low and CD8high T cells or between TCR/CD3low and TCR/CD3high T cells. Studies of T helper cell subsets (TH1 and TH2) reveal that lymphokine-producing cells are much more likely to express A2ARs than are cells that do not produce lymphokines. These results suggest that A2ARs are variably expressed on T cell subsets and may regulate cytokine production in activated T lymphocytes.
The recognition of antigen by T cell antigen receptor (TCR) and coreceptors (CD4 or CD8) triggers transmembrane signaling cascades involving phosphotyrosine and phosphoserine/threonine protein kinases and phosphatases (reviewed in Qian and Weiss, 1997; Alberola-Ila et al., 1997; Berridge, 1997). This, in turn, causes activation of T lymphocytes, leading to cellular cytotoxicity and synthesis and secretion of lymphokines.
The activation of cAMP-dependent protein kinase (PKA) causes inhibition of TCR-triggered T cell effector functions that do not require protein synthesis, including cytotoxic granule exocytosis, cell-mediated cytotoxicity, and lymphokine secretion (Takayama et al., 1988; Sugiyama et al., 1992, 1993). However, basal activities of PKA appears to be required for successful propagation of signals leading to completion of TCR-triggered lymphokine secretion (Kammer, 1988; Laxminarayana and Kammer, 1996; Sugiyama et al., 1997). These data suggest an important role for PKA as both a positive and a negative regulator of T cell activation. Accordingly, receptors that modulate adenylyl cyclase activity in response to physiologic stimuli, such as purinergic receptors (Apasov et al., 1995; Olah and Stiles, 1995; Jacobson et al., 1996), are likely to influence the TCR-driven immune response.
ATP and adenosine modulate TCR-driven immune response at least in part by binding to purinergic receptors (Apasov et al., 1995, 1997). Purines produce pleiotropic effects on murine thymocytes (Apasov et al., 1997), and detailed biochemical and pharmacologic studies led to the identification of the p2x7 receptor for ATP [formally called p2z (Steinberg et al., 1987; Chused et al., 1996] and the A2A adenosine receptors (A2AR) for adenosine (Koshiba et al., 1997b; Huang et al., 1997) as the functionally predominant purinergic receptors on murine T cells. Previous studies of the expression of purinergic receptors in subsets of lymphocytes have been limited to receptors for ATP. It was shown, for example, that ATP receptors behave as immediate, early-response genes (e.g., p2y2 receptor in thymocytes) (Koshiba et al., 1997). Moreover, immature thymocytes express far fewer p2x7 receptors than do mature T cells (Chused et al., 1996), suggesting a differentiation-dependent regulation of p2x7 receptor expression. Indeed, CD4+ single-positive thymocytes and CD4+ peripheral T cells are more functionally responsive to p2x7 receptor activation than are other T cell subsets (Apasov et al., 1997). Little was known about the expression of adenosine receptors among subsets of lymphocytes, butEppell et al. (1989) showed that radioligand binding to A2 receptors dramatically increases during monocyte differentiation in vitro.
Information about the lymphocyte subset-specific expression of adenosine receptors would be useful, but it has been difficult to obtain sufficient quantities of cells to analyze expression of Ado receptors in biochemical or radioligand binding assays, particularly in the minor subpopulations of lymphocytes. Flow cytometry has been useful for determining the distribution of p2x7 receptor-gated channels among lymphocyte subsets (Chused et al., 1996) but these techniques are difficult to apply to low-density G protein-coupled receptors such as adenosine receptors. However, by immunizing mice with purified recombinant A2AARs (Robeva et al., 1996a,b), we were able to produce monoclonal antibodies (mAbs) suitable for Western blotting and immunohistochemical evaluations of brain (Rosin et al., 1998). We report that anti-A2AR antibodies are also suitable for flow cytometric studies and for the analysis of A2AR receptor expression on lymphocytes. In this study we show that A2ARs are expressed more in T cells than in B cells. We find that among TH1 and TH2 T helper cell subsets, the production of cytokines is greater in A2AR-expressing (A2AR+) than in A2AR-nonexpressing (A2AR−) cells.
Experimental Procedures
Antibodies.
Mouse anti-human A2AR mAbs (clone 7F6, IgG2a) were prepared and purified as described previously (Robeva et al., 1996). Mouse anti-human Cy-Chrome-conjugated anti-CD3 mAbs (clone UCHT1, IgG1); R-phycoerythrin (PE)-conjugated anti-CD4 (clone RPA-T4, IgG1);R-PE-conjugated anti-CD8 (clone RPA-T8, IgG1) were purchased from PharMingen (San Diego, CA). Mouse anti-humanR-PE-conjugated anti-CD69 (clone CH/4, IgG2a) andR-PE-conjugated anti-γ interferon (IFN)-(clone B27, IgG1) were obtained from Caltag Laboratories (Burlingame, CA). Rat anti-humanR-PE-conjugated anti-IL-2 (clone MQ1–17H12, IgG2a);R-PE-conjugated anti-IL-4 (clone MP4–25D2, IgG2a), andR-PE-conjugated anti-IL-10 (clone JES3–9D7, IgG1) were obtained from Caltag Laboratories. Isotype controls for flow cytometry and fluorescein isothiocyanate (FITC)-labeled goat anti-mouse IgG2a were obtained from Caltag Laboratories.
Reagents.
All reagents were purchased from Sigma Chemical Company (St. Louis, MO) unless otherwise mentioned. The selective A2AR agonist CGS21680 was purchased from RBI (Natick, MA), and the A2AR-selective antagonist ZM241385 (4-(2-[7-amino-2-(2-furyl)(triazolo [2,3-a]-[1,3,5] triazin-5-ylamino]ethyl)phenol) was a kind gift from Dr. Kenneth Jacobson (National Institutes of Health, Bethesda, MD).
Cells.
Human peripheral mononuclear cells (PBMCs) were separated by density (Ficoll-Paque Plus; Pharmacia Biotech, Piscataway, NJ) from buffy coats obtained from healthy donors (National Institutes of Health Blood Bank) and stored in liquid nitrogen. The representative data shown here were obtained with samples of peripheral blood from normal individuals 19, 20, and 89. Human embryonic kidney (HEK) cells transfected with human A2A cDNA (HEK/A2AR; Robeva et al., 1996) were maintained in Dulbecco’s modified Eagle’s medium/F12 media (Life Technologies, Gaithersburg, MD) supplemented with glutamine, penicillin, streptomycin, fungizone (Biofluids, Rockville, MD), and 10% fetal calf serum (FCS; Life Technologies) at 37°C in a 5% CO2 incubator. T84 human colon carcinoma cells were obtained from the American Type Culture Collection (Rockville, MD) and maintained in 5% FCS-Dulbecco’s modified Eagle’s medium/F12.
Preparation of cDNA.
Total RNA was prepared from 1 × 10⁶ cells by the single-step method of Chomczynski and Sacchi (RNA STAT-60; Tel-Test “B”, Friendswood, TX). After DNase I treatment, the first-strand cDNA was synthesized by the SuperScript preamplification system (Life Technologies) according to the manufacturer’s instructions.
Determination of A2A mRNA Expression by Reverse Transcription-Polymerase Chain Reaction (RT-PCR) in HEK/A2AR and T84 cells.
The human A2A sequence was amplified with primers corresponding to 490–507 and 1001–982 nucleotides of the open reading frame of human A2A cDNA. Human glyceraldehyde-3-phosphate dehydrogenase (GAPDH) sequence was amplified with primers corresponding to 50–71 and 521–500 nucleotides of human GAPDH cDNA open reading frame as previously described (Koshiba et al., 1997). All PCR primers used were synthesized by Genosys Biotechnologies (The Woodlands, TX). RT-PCR was performed under standard conditions. A 30-μl reaction volume that included 3 μl of the diluted cDNA and 10 ml of PCR product was electrophoresed on a 4% (w/v) NuSieve 3:1 agarose gel (FMC BioProducts, Rockland, ME) and examined by ethidium bromide staining.
Flow Cytometry.
Flow cytometry data acquisition and analysis were typically done using 0.5 × 10⁶ cells per sample. Stained cells were examined on fluorescence-activated cell sorting analysis (FACScan) with CellQuest analysis software (Becton Dickinson, San Jose, CA) using mAb to different T cell subset-identifying surface markers (mAb), which have been established in careful immunologic studies of lymphocyte subsets. Lymphocytes are divided into two major subsets according to their function and cell surface markers: surface Ig- or CD20-expressing B cells and CD3/TCR- or CD4- or CD8-expressing T cells. Flow cytometry analysis using mAb to these surface markers facilitates studies of immature versus mature thymocytes (mAbs to TCR, CD4, CD8) and B cells versus T cells [mAbs to CD20 (Himmelmann et al., 1997; Kappes et al., 1995]. Functional subsets of T-helper cells (TH1 versus TH2 cells) can be distinguished with mAbs to different cytokines including interleukin (IL)-2, IL-4, IL-10, and IFN-γ (Jung et al., 1993; Klein et al., 1997).
Intracellular A2AR Staining.
The characterization of mAbs to human A2AR using receptor chimera established that they recognize an antigenic epitope in the intracellular domain of A2AR. Competitive inhibition by peptides corresponding to different regions of the third intracellular loop localized the epitope to SQPLPGER (Rosin et al., 1998). The specificity of anti-A2AR mAb was tested using A2AR+ and A2AR− cells and by including either the blocking peptide derived form the antigenic epitope in A2AR or a nonspecific peptide (QQTQGHCAENPEGGI) derived from a rat muscle p2x1 receptor. No significant homology was found in the Swiss-Port database between these peptides. Cell antigens were detected on cells incubated on ice for 30 min in the dark and washed twice with 0.1% BSA-PBS. Cells were fixed in 4% paraformaldehyde (Electron Microscopy Sciences, Ft. Washington, PA) at 4°C for at least 30 min (typically overnight). After one wash with 1% BSA-PBS, cells were washed in PBS-saponin [PBS containing 0.1% (w/v) saponin, 0.1% BSA, 0.01 M HEPES, and 0.01% sodium azide] to permeabilize the cells. Cells were stained with 50 μl of anti-A2AR (clone 7F6) mAb in PBS-saponin (1:4000 dilution of 6 mg/ml stock) for 30 min on ice in the dark. Cells were washed once with PBS-saponin and then for 30 min on ice in the dark with a 1:100-diluted secondary FITC-conjugated goat anti-mouse IgG2a (Caltag; 100 mg/ml of stock solution). Cells were washed once in PBS-saponin, once in PBS, resuspended in 500 μl of 1% paraformaldehyde, and analyzed by flow cytometry. The isotype-matched control antibodies for mAbs to A2ARs or surface markers were evaluated by flow cytometric analyses until it was firmly established that there were no significant differences between samples with and without the irrelevant isotype-matched control antibody. This allowed us to facilitate the assay procedure by using only the secondary antibody for control “negative-stained” samples in some experiments.
Intracellular Cytokine Staining.
R-PE-conjugated anti-human cytokine antibodies (anti-IL-2 and anti-IFN-γ for TH1 and anti-IL-4 and anti-IL-10 for TH2) were used as previously described (Jung et al., 1993; Klein et al., 1997) except that the amount of each antibody was titrated for optimal staining (data not shown). The optimal incubation time (2 h for IL-10, 5 h for γ-IFN, and 8 h for IL-2 and -4) was chosen on the basis of preliminary experiments (data not shown). Incubations were performed in RPMI 1640 with 10% FCS at 37°C in a 7% CO2 incubator. Cells were fixed, permeabilized, and stained intracellularly with anti-A2A mAb and anti-mouse IgG2a-FITC and with anti-human cytokine mAbs. Human PBMCs were incubated in 25 ng/ml phorbol myristate acetate (PMA), 1 mg/ml ionomycin, and 1.33 mM monensin (GolgiStop, PharMingen) in 10% FCS-RPMI media (K-media) at 37°C, 5% CO2, at 2 × 10⁶ cells/ml concentration. After incubation, 0.5 × 10⁶ cells/tube (Falcon 2052, Becton Dickinson Labware, Lincoln Park, NJ) were washed twice in PBS, fixed, and permeabilized. Cells were then incubated with anti-A2AR antibody for 30 min on ice in the dark and then washed once with PBS-saponin. Cells were then treated with secondary antibody (anti-mouse IgG2a) with or without each anticytokine antibody for 30 min on ice and in the dark followed by washing with PBS-saponin and with PBS. Five hundred microliters of 1% paraformaldehyde was used for fixation.
Flow cytometric quantitation of live, apoptotic, and dead cells was performed according to a modified procedure (Apasov et al., 1997). Briefly, cells from the short-term culture were gently pipetted and transferred from 96-well plates (200 μl) directly into polystyrene tubes (12 × 75 mm; Falcon, Becton Dickinson Labware, Lincoln Park, NJ), and 200 ml of FACS buffer (PBS with 2% FCS and 0.05% sodium azide) was added to each sample. Each sample had equal volume and was analyzed at the same flow rate and for the standard time (20 s) in duplicate or triplicate. Propidium iodide solution (1 μg/ml final concentration) was added in some experiments to each tube for 10 s before FACS analysis. Live, dead, and apoptotic cells were estimated by counting cell numbers in appropriate gates using forward/side scatter dot plot in linear scale and propidium iodide (PI) staining in log scale. Statistical analysis of triplicate sample measurements was performed by using the StatView statistics program (Abacus Concepts, Inc.). Standard deviations of triplicate measurements within the same experiment usually were lower than 1%.
Flow cytometry data acquisition and analysis were done on FACScan using FACScan research software and CellQuest programs (Becton Dickinson). Flow cytometric estimation of live, apoptotic, and dead cells was performed using annexin-V and PI solution (Philippe et al., 1997) (Apoptosis Detection Kit, R & D Systems, Minneapolis, MN) according to manufacturer’s procedure. The gates on forward/side scatter dot plot were set by this staining, namely live (annexin-V negative and PI negative), dead (annexin-V positive and PI positive), and apoptotic (annexin-V positive and PI negative) cells. These gates were subsequently used for the estimation of live, dead, and apoptotic cells on intracellular A2AR and/or cytokine staining, because annexin-V and PI staining cannot be done on the cells with the fixation and permeabilization that procedures were necessary for intracellular staining.
cAMP Measurements.
The cAMP content of was determined by incubating 0.5 × 10⁶ cells alone or with compounds. Levels of cAMP were measured in triplicate using a cAMP EIA System (Amersham, Arlington Heights, IL) according to the manufacturer’s protocol.
Immunofluorescence of Human Adenosine A2ARs.
Cells (hA2A/HEK or T84) were stained in the same way as for the flow cytometry, except that the dilution of the primary anti-A2A antibody was adjusted to 1:250. Cells were resuspended in 0.1% BSA-PBS and examined with a Nikon ECLIPSE E800 fluorescence microscope equipped with a fluorescence B-2A filter (EX450–490, BA520). The microscopic image was captured by a Color Chilled 3CCD Camera (C5810, Hamamatsu Photonics K. K., Hamamatsu City, Shizuoka, Japan) and analyzed using MacSCOPE ver2.5 software (Mitani Corporation, Fukui, Japan).
Results
Demonstration of Functional A2ARs on Human Lymphocytes.
Our previous studies of Ado receptors on mouse lymphocytes indicate that the predominant functional receptor on murine T cells is the A2AR (Apasov et al., 1997; Huang et al., 1997; Koshiba et al., 1997). In initial experiments we found evidence of functional A2AR on human peripheral lymphocytes by demonstrating that the A2AR-selective agonist, CGS21680, and the nonselective agonist, 2-CA, both stimulate cAMP accumulation in human lymphocytes, and that the response to both compounds is blocked by the A2A-selective antagonist, ZM241385 (Poucher et al. 1995; Fig. 1). In addition, ZM241385 reduces cellular cAMP levels to below the control level, indicative of autocrine A2AR activation.

Ado analogs and selective A2AR agonist CGS21680 trigger cAMP accumulation, whereas A2AR antagonist ZM inhibits extracellular adenosine-triggered cAMP accumulation in human PBMCs. PBMCs were incubated with Ado receptor agonists and antagonist, and measurements were made after 30, 60, and 120 min as described under Materials and Methods. A, incubation with 10 μM 2-Cl Ado (CA) in the presence or absence of 1 μM selective A2AR antagonist ZM.B, same as in A but 50 μM 2-CL-adenosine were used; C, incubation with 10 μM selective A2AR agonist CGS21680 and 1 μM antagonist ZM.
Development of a Flow Cytometry Assay for Expression of A2AR.
The opportunity to study A2AR expression on different lymphocyte subsets was provided by the successful development of mAbs to recombinant A2AR. These mAbs were found to detect A2AR immunoreactivity in the striatum, where the density of A2A receptors is known to be high (Rosin et al., 1998). These mAbs are useful for Western blot analyses and immunohistochemistry in the brain, but these findings did not guarantee that the mAbs are suitable for other applications. Thus, experiments were performed to determine the suitability of two different mAb for flow cytometry. Because the epitope of anti-A2AR mAb is located inside cells (Rosin et al., 1998), a cell permeabilization procedure was developed by adapting the method for staining lymphocytes with antilymphokine mAbs (Klein et al., 1997). Cells were double-stained with mAbs to cell surface markers or to lymphokines coupled to fluorescein (red) and with anti-A2AR mAbs (green). Several different preparations of antireceptor mAbs were tested using this procedure, and we found in a control experiment that mAb 7F6 stains A2AR+ cells but not A2AR-negative cells (Fig.2). Other preparations of anti-A2AR mAb (data not shown) were not as efficient in staining and discriminating between A2AR+ and A2AR− cells (data not shown). Untransfected HEK cells were used to control for specificity of staining with anti-A2AR mAb, but these cells were not completely negative for A2AR transcript as assessed by RT-PCR (data not shown). T84 cells (Strohmeier et al., 1995) were identified as lacking A2AR transcript and were used in parallel with HEK/A2AR transfectants (Fig. 2A) to control for the specificity of the anti A2AR mAb during the development of the flow cytometry assay. Figure 2B shows that the staining of A2AR cDNA-transfected HEK cells with anti-A2AR 7F6 mAb. In parallel control experiments the A2AR−cells show no staining with the same dilution of the same mAb.
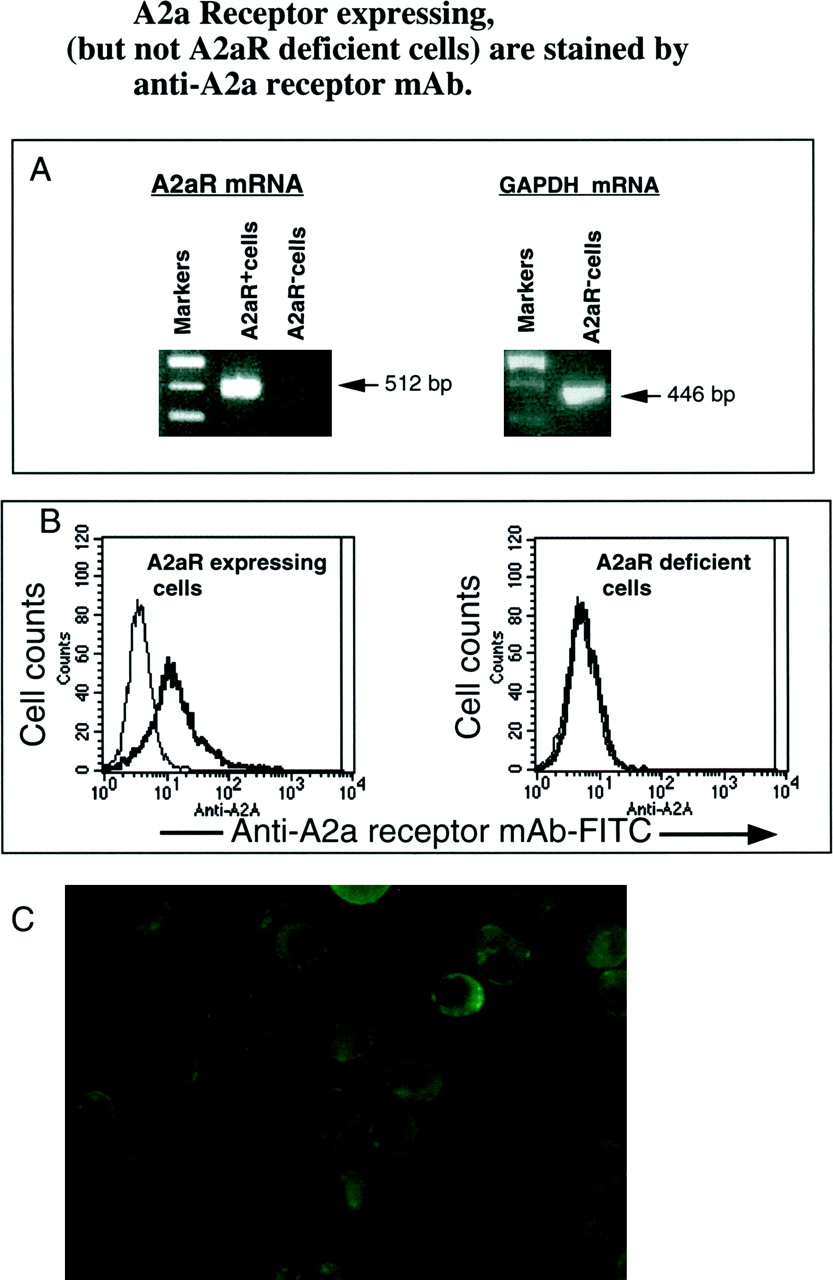
Anti-A2A mAbs detect A2AR mRNA-expressing cells but not A2A mRNA-negative cells in flow cytometry assay. A, control RT-PCR assays for A2AR mRNA expression in cells tested: HEK A2AR transfectants express A2AR mRNA, whereas control A2AR− T84 cells do not express A2AmRNA in parallel RT-PCR assays. Control RT-PCR showed that the same mRNA sample from T84 cells that had no traces of A2AR cDNA nevertheless expressed the PCR product for housekeeping gene GAPDH. B, mAb to rA2AR stain A2A mRNA-expressing cells but not A2AR-negative cells. A2AR cDNA transfected and functional A2AR+ HEK cells (Robeva et al., 1996) were tested in flow cytometry after staining of cells according to the procedure described in Materials and Methods and in A. Thin line of flow cytometry profile, control (mouse IgG2a, 1 μg/ml plus secondary goat anti-mouse IgG, F(ab)′2-FITC, 0.7 μg/sample at 1:50 dilution); thick line, antihuman A2AR mAb (clone 7F6, 1:4000 dilution = 1.5 μg/ml plus secondary goat anti-mouse IgG, F(ab)′2-FITC, 0.7 μg/sample at 1:50 dilution). T84 cells were used as control as A2AR− cells, because these cells do not express A2AR mRNA. C, cell surface staining (immunofluorescence) of HEK A2AR transfectants that were fixed with paraformaldehyde and permeabilized according to a procedure for staining of lymphocytes with anti-A2AR mAb as described in Materials and Methods.
Because it was necessary to permeabilize cells to provide access of the mAb to the intracellular facing receptor epitope, we sought to determine whether some immunoreactivity is located on intracellular compartments as opposed to being on the cell membrane. Immunofluorescense studies of HEK-A2A cells reveals that staining is predominantly on the cell surface and reveals cap formation of A2ARs (Fig. 2C). Cap formation suggests that A2AR can cluster in association with cytoskeletal elements. Predominant cell surface localization of anti-A2AR immunoreactivity is consistent with the immunohistochemistry of the receptor in the rat brain, which indicates that the primary loci of A2AR is on the cell surface (Rosin et al., 1998). It is notable also that Western blot studies with anti- A2AR mAb indicate that all receptors in the central nervous system or in HEK cells are full length and glycosylated, with no detectable evidence of immature receptors that might exist in intracellular organelles.
Figure 3 illustrates the selection of gates for analysis of live versus apoptotic or dead cells in untreated and treated cell populations (Fig. 3, top graph, and data not shown). To eliminate nonspecific staining, various dilutions of mAbs were tested using A2AR− cells to detect nonspecific binding (data not shown). At antibody dilutions of 1:1000 and 1:2000 there was minor but noticeable nonspecific staining of A2AR− cells, but at 1:4000 and 1:8000 dilutions, only A2AR+ cells were stained with mAb. Thus, the 1:4000 dilution of mAb preparation was used in all subsequent studies. Specificity of the mAb to A2AR+ cells was confirmed by using the specific antigenic peptide, which prevented staining by the anti-A2AR mAb, whereas the same concentration of nonspecific peptide was without effect (data not shown). In addition, the anti-A2AR mAb failed to stain unpermeabilized cells (data not shown). Taken together, these data established the specificity of mAbs for detection by flow cytometry of cell surface expressed A2ARs on human peripheral blood lymphocytes.

Peripheral T cells (CD3+) but not B cells (CD20+) express flow cytometry-detectable levels of A2AR in human peripheral blood cells. To determine whether both B and T cells express A2AR, human PBMCs were stained with either, Cy-Chrome fluorescein-coupled anti-CD3 mAb (T cell marker) (A) or PE-fluorescein-coupled anti-CD20 mAb (B cell surface marker) and with FITC-coupled anti-A2AR mAb (B). Top graphs (forward versus side scatter), selection of gate with live cells to be analyzed for expression of surface markers; middle graphs, setting of R2 gate for analysis of A2AR+ cells. Red contour, control, no A2A mAb included during incubation of cells; green contour, A2AR+ cells revealed by binding of anti-A2AR mAb; lower graphs, expression of A, CD3+ T cells and of B, CD20+ cells in A2AR+ cells.
Comparative Studies of A2AR Expression in Peripheral CD3+ T Cells and CD20+ B Cells.
To determine the relative levels of expression of A2AR in B and T cells, specific surface markers, CD20 (Himmelmann et al., 1997) and CD3 (Kappes et al., 1995), respectively, were used to identify these two major lymphocyte subsets. Double staining of human peripheral blood lymphocytes with anti-A2AR mAb (green fluorescence) and either anti-CD20 mAb-PE or anti-CD3 mAb allowed us to observe the expression of these molecules on individual cells. A representative experiment is shown in Fig. 3. Human PBMCs from individual 19 were stained with both anti-A2A mAb-FITC and either anti-CD3 mAb-Cy-Chrome (Fig. 3A) or anti-CD20 mAb-PE (Fig. 3B). The cells were then analyzed by flow cytometry and gated to analyze only live cells using side versus forward scatter (Fig. 3, top). Analysis of live cells for expression of A2AR permitted us to establish gating to detect A2AR+cells (Fig. 3, middle) and to further evaluate these for the coexpression of CD3 (Fig. 3A) or CD20 (Fig. 3B). Although the percentage of CD3+ cells was far higher than CD20+ cells, there were significant numbers of B cells in human PBMCs (data not shown). No B cell marker, CD20, was expressed in A2AR-positive cells, whereas the same A2AR-positive cells displayed intense staining with the T cell marker, CD3. Thus, virtually no immunoreactivity for A2AR was found among B cells (Fig. 3B), whereas CD3+ T cells expressed A2AR (Fig. 3A). These data do not exclude the possibility that B cells do express A2AR in numbers below the sensitivity of the mAb used here, but they clearly suggest that relative levels of A2AR are much higher in T cells than in B cells. Higher levels of A2AR in T cells than in B cells also were observed in the analysis of two other healthy individuals (20 and 89, data not shown).
Expression of A2AR in Different Human T Cell Subsets.
Because T cells express A2ARs, it was of interest to determine which T cell subsets express these receptors. The two major T cells subsets are distinguished by the expression of TCR coreceptor molecules CD8 (Ravichandran et al., 1995) and CD4 (Bowers et al., 1997), which are involved in cognate recognition of class I and class II major histocompatibility complex, respectively. In addition, CD8+cells are mostly cytotoxic effector cells, whereas CD4+ cells have been implicated in T helper cell activities (Bowers et al., 1997). The proportion of CD4+ and CD8+ cells in human PBMCs varied among individuals; e.g., individual 19 had fewer CD8+ cells (26%) than CD4+cells (58%), whereas individual 20 had more CD8+cells (41%) than CD4+ cells (35%). To compare the expression of A2AR among these subsets, the peripheral blood T cells from different human volunteers were double stained with FITC-labeled (green fluorescence) anti-A2A mAb and PE-labeled (red fluorescence) anti-CD4 or anti-CD8 mAb-PE. The proportion of A2AR+ cells ranged from 12% to 20% of total human PBMCs and was detected on both CD8+ and CD4+ cells. It is notable that in each individual tested, the proportion of A2AR+ cells was somewhat lower among CD8+ T cells than in CD4+ T cells (Table1). The PBMCs of each tested individuals displayed one sharp peak of CD4+ cells but clearly displayed two subsets of CD8+ cells (CD8low and CD8high). No significant differences were found in the expression of A2AR in these CD8 expressing subsets (Table1).
Studies of expression of A2AR in CD4+ and CD8+ T cells after 2 or 4 h activation with PMA/I
A2AR Expression in Activated T Cells.
We recently demonstrated that activation of T cells by cross-linking T cell receptors or by the addition of PMA and ionomycin (PMA/I)2 (Keenan et al., 1997) results in the up-regulation of p2y2 mRNA, and we concluded that the expression of purinergic receptors may follow the pattern of immediate early response genes (Koshiba et al., 1997). It was of interest, therefore, to determine whether the expression of the A2AR is changed during activation of T cells using anti-receptor mAb. To examine this possibility, human PBMCs were incubated in media alone or in the presence of activating stimuli and then stained with anti-A2AR mAb, anti-CD4, or anti-CD8 mAb. In control experiments (Fig.4), activated T cells were stained with anti-CD69 mAb to follow the fate of a CD69 activation marker (Werfel et al., 1997). The inclusion of the CD69 control ensured that the expression of the A2AR was tested in T cells that were indeed activated. T cells were activated with PMA/I (Berrebi et al., 1987; Keenan et al., 1997) after establishing the optimal concentrations of these compounds needed to activate T cells in samples from each individual (data not shown). In each sample, the T cells were judged to be activated after 2 h and/or 4 h of incubation with PMA/I, because the expression of CD69 was dramatically increased, as shown for samples 19 and 20 in Fig. 4. Of interest, T cells from patient 19 (but not T cells in sample 20; Fig. 4B) had an activated phenotype even after 2 h in media alone, but that increase was very minor in comparison with PMA/I-induced changes in CD69 expression in parallel samples (Fig. 4A). Similar data were obtained with cells from individual 89.

Flow cytometry controls for T cell activation using CD69 activation markers. As control for activation of T cells in studies of activation-related changes in expression of A2AR, cells were incubated with PMA (25 ng/ml) and ionomycin (1 μg/ml) and then analyzed for expression of CD69 after 2 and 4 h as indicated on the graphs. Control, filled contour, expression of CD69 in cells incubated 2 and 4 h in media alone.
In another control experiment, we tested for PMA/I-induced changes among T cells in the expression of levels of CD4 and CD8 and in proportions of CD4+ and CD8+ cells (data not shown). We found that although the level of expression of CD4 antigen (CD4 surface density) decreased after PMA/I activation (data not shown), the percentages of CD4+ and CD8+ cells did not change significantly (data not shown). These control experiments and the analysis of CD4+ and CD8low and CD8high cells allowed us to compare changes in expression of A2AR on different subsets of T cells: CD4+ versus CD8low versus CD8high (Table 1). The expression of A2AR in CD4+ human PBMCs from individuals 20 and 89 did not change upon T cell activation, while in patient 19, the expression of A2AR decreased after 4 h in the presence of PMA/I, as compared with control cells. In contrast, CD8+ T cells seem to consistently respond to activation by changes in A2AR expression. Thus, a higher proportion of A2AR+ cells was found among activated CD8+ cells from all three individuals (Table 1). The time course of the increase in A2AR expression varied among the individuals. For example, the increase in percentage of A2AR in patient 20 was observed only after 4 h, whereas in patients 19 and 89, the increase was observed after 2 h of incubation with PMA/I (Table 1).
A2AR Expression in CD3high and CD3low T Cells.
In previous studies, we established that signaling through A2AR antagonizes TCR-CD3 complex-mediated signaling to T cells and inhibits TCR-driven T cell expansion and effector functions (Apasov et al., 1997; Huang et al., 1997; Koshiba et al., 1997). This, in turn, suggested that the presence of functional A2AR may affect the final outcome of TCR-CD3-driven processes. It is well known that the intensity of signaling in T cells is dependent on and proportional to the number of cross-linked TCR/CD3 molecules (Takayama and Sitkovsky, 1987;Alberola-Ila et al., 1997; Qian and Weiss, 1997). Therefore, it was interesting to test whether the expression of A2AR is dependent on the density of TCR-CD3 molecules among TCR/CD3high and TCR/CD3low T cells. No reproducible differences in expression of A2AR in TCR/CD3high and TCR/CD3lowwere found in these experiments, e.g., in some samples (e.g., 19 and 20), the proportion of A2AR+ cells was higher in TCR/CD3high cells than in TCR/CD3low cells, whereas in sample 89, the opposite was seen (data not shown). It was also observed that the expression of A2AR was somewhat higher among CD3low cells.
A2AR Expression in TH1 and TH2 Cells.
T cells can be subdivided into functional TH1 and TH2 subsets according to their pattern of lymphokine secretion in response to activation stimuli (Jung et al., 1993; Mosmann and Sad, 1996; Klein et al., 1997). Human PBMCs were activated with PMA/I and then stained with both anti-A2AR mAb and either anti-IL-2, -IL-4, -IL-10, or -γ-IFN mAb (Figs. 5-7). In preliminary experiments, incubation times and antibody concentrations for the optimal detection of each cytokine were established. To prevent the depletion of lymphokines during these assays, monensin was included in the incubation media. Figure 5 demonstrates that 48.6% of activated human peripheral blood lymphocytes produce IL-2; but only 2.6% of these cells also expressed A2AR as detected by flow cytometry. The fraction of cytokine-producing cells that also express immunoreactive A2AR is approximately one in five of γ-IFN-producing cells, one of four of IL-4 producing cells and one in two of IL-10-producing cells.

Expression of A2AR in TH1 and TH2 subsets of lymphokine-producing cells. To evaluate whether expression of A2AR is associated with the phenotype of T cells (TH1 and TH2), cells were incubated with 25 ng/ml PMA + 1 μg/ml ionomycin for 2 h to detect IL-10 accumulation, for 5 h to detect γ-IFN accumulation, or for 8 h to detect IL-2 and IL-4 accumulation in 10% FCS-supplemented complete RPMI 1640 media. Half a million cells were then fixed, permeabilized, and double stained with anti-human A2AR mAb (clone 7F6, 1.5 μg/ml plus anti-mouse IgG2a-FITC) and with mAb to individual cytokines. To avoid underestimation of the proportion of lymphokine-secreting cells due to secretion-related loss of lymphokines during preparation of cells for assay, 1.3 μM monensin (GolgiStop, Pharmingen) were included in the media. Incubation was performed in 10% FCS-complete RPMI 1640 at 37°C in a 7% CO2incubator.
Because some cytokine-producing cells also express A2AR, we were interested in determining whether the presence of A2ARs correlates with the pattern of cytokine production. To determine how many lymphokine-producing cells could be detected among activated A2AR+ and A2AR− T cells, cells were first gated into A2AR+ and A2AR− subpopulations. Gated A2AR+ cells were then analyzed for the accumulation of individual cytokines (Figs.6 and 7). We were surprised to observe that many more lymphokine-producing cells are detected among A2AR+ cells than among A2AR− cells. IL-2 is produced by 84% of A2AR+cells but by only 28% of A2AR− cells (Fig. 6A). Similarly, γ-IFN is produced by 51% of A2AR+ cells but by only 11% of A2AR−nonexpressing cells (Fig. 6B). IL-4 is produced by 70% of A2AR+ and by only 3% of A2AR− cells (Fig.7).

Comparison of expression of lymphokines among A2AR+ and A2AR−TH1 cells. Cells were incubated and double stained as described in Fig. 5, and A2AR+ and A2AR− cells were gated for analysis of cytokine expression. To address how many lymphokine-producing cells could be detected among A2AR+ and A2AR−, cells were first gated for live cells by forward versus side scatter and then gated into A2AR+ and A2AR−subpopulations. Cells were then analyzed for accumulation of individual cytokine as reflected in proportional fluorescence of anticytokine mAb. Expression of IL-2 and of γ-IFN (TH1 cells) are presented in A and B, respectively.

Comparison of expression of lymphokines among A2AR+ and A2AR−TH2 cells. Cells were incubated and double stained as described in Fig. 5, and A2AR+ and A2AR− cells were gated for analysis of cytokine expression. To address how many lymphokine-producing cells could be detected among A2AR+ and A2AR−, cells were first gated for live cells by forward versus side scatter and then gated into A2AR+ and A2AR−subpopulations. Cells were then analyzed for the accumulation of individual cytokine as reflected in proportional fluorescence of anticytokine mAb. Expression of IL-2 and of IL10 (TH2 cells) are presented in A and B, respectively.
Discussion
In this report we show that it is possible to detect the expression of a G protein-coupled receptor, the A2AR, in human lymphocytes both on the basis of a functional assay (cAMP accumulation) and by flow cytometry using an antireceptor mAb. We were able to describe for the first time the distribution of A2AR among minor T cell subpopulations through the use of a combination of anti-A2AR mAb and mAbs that recognize T cell surface markers or cytokines. The principle findings of this study are that much higher levels of A2AR expression is found in T cells than in B cells (Fig. 3) and higher levels of cytokines are detected in activated T cells that express A2AR than in activated T cells that do not express these receptors (Figs. 6 and 7).
The detection of higher levels of cytokines among A2AR+ cells is surprising because A2AR-mediated signaling antagonizes the effects of T cell activation (Koshiba et al., 1997; Huang et al., 1997). Therefore, we expected that cytokine secretion would be the lowest in those T cells in which cytokine production can be inhibited by the activation of A2ARs. A determination of the significance of these observations in understanding the regulation of T cells will require further experimentation, but several testable possibilities exist. One possibility is that the levels of A2AR in T cells are insufficient to inhibit cytokine production by PMA/I. Another possibility is that inhibitory A2ARs are induced selectively in cells that produce cytokines, as a means of limiting cytokine release. It is possible that A2AR expression in the presence of low levels of adenosine leads to a low levels of protein kinase A activation in T cells that may be permissive for optimal lymphokine secretion (Sugiyama et al., 1997). Thus, when extracellular adenosine concentration is low, A2ARs may facilitate propagation of cytokine responses, while the same A2ARs could attenuate cytokine release when extracellular adenosine concentrations become high.
The results of this study establish for the first time the feasibility for using flow cytometry to determine the distribution on T cells of a G protein-coupled receptor. This methodology is dependent on the quality of antireceptor mAbs and on the method of preparing cell samples for mAb staining. Moreover, the detection of A2AR− cells is dependent on the sensitivity of a particular antibody and it is quite likely that some cells with no detectable immunoreactivity do have low levels of functional A2ARs. Although no immunoreactive A2ARs can be detected on B cells, it is possible that low levels of these receptors do exist and may even be functionally significant. Nevertheless, the approach employed in this study does allow us to conclude that B cells have far fewer A2ARs than T cells and that there are activation-dependent changes in A2AR expression in CD8+ T cells but not in CD4+ T cells.
The mAbs used for this study may be suboptimal due to the intracellular location of the antigen determinant. Moreover, the antigenic epitope on some receptors may be “hidden” due to interactions of the third intracellular loop of the receptors with other proteins. Thus, further development of mAbs that can recognize extracellular domains of A2AR in intact and nonfixed cells may be useful. The strategy to accomplish such a goal may include immunization not only with recombinant A2AR but also with intact cells that overexpress A2AR (Robeva et al., 1996). The screening of such mAbs will be facilitated by the availability of both naturally A2A− cells and A2AR-deficient cells from A2AR-deficient mice.
The use of flow cytometry to detect Gs-coupled A2ARs may be useful to detect A2ARs on cells derived from other tissues, including coronary arteries (Martin et al., 1997), neutrophils (Sullivan et al., 1995), mast cells (Holgate et al., 1980; Jin et al., 1997), and platelets (Varani et al., 1996). Future studies may also reveal changes in A2AR expression among different subsets of T cells in the pathogenesis of different diseases. The results of this study are in agreement with an earlier report byEppell et al., (1989) demonstrating that A2ARs increase dramatically during monocyte differentiation in vitro and suggest that regulation of A2AR expression may be a general phenomenon among cells of immune system. Finally, the adaptation of this methodology to other G protein-coupled receptors could provide a general procedure for analyzing G protein-coupled receptors and their regulation during cell differentiation and activation.
Acknowledgments
We thank Dr. Ken Jacobson (NIH) for the gift of A2AR antagonist and Dr. Sergey Apasov (NIH) for discussions. We thank Brenda Marshall for editorial assistance and Shirley Starnes for preparation of the manuscript.
Footnotes
-
Send reprint requests to: Dr. Michail V. Sitkovsky, Laboratory of Immunology, National Institute of Allergy and Infectious Diseases, National Institutes of Health, Bldg. 10, Rm. llN3ll, 10 Center Dr., MSC 1892, Bethesda, MD 20892-1892. E-mail:mvsitkovsky{at}helix.nih.gov
-
↵1 Present address: Department of Clinical Laboratory Medicine, Kobe University School of Medicine, 7–5-1 Kusunoki-cho, Chuo-ku, Kobe 650-0017, Japan.
-
↵2 In these experiments we used PMA and ionomycin instead of the anti-CD3 mAb to activate T cells to avoid inconsistencies due to the differences among batches of Ab in their ability to activate T cells and to avoid problems related with polymorphism of human monocyte Fc receptors for murine IgG1.
-
This work was partially supported by National Institutes of Health Grant R01HL37942 (to J.L).
- Abbreviations:
- A2AR
- A2A adenosine receptor
- A2AR+
- A2AR-expressing cells
- A2AR−
- A2AR-nonexpressing cells
- HEK/A2AR
- human embryonic kidney cells transfected with human A2A cDNA
- PBMCs
- peripheral blood mononuclear cells, ZM, A2AR antagonist ZM241385
- FCS
- fetal calf serum
- TCR
- T cell antigen receptor
- TCR-CD3high
- high levels of TCR-CD3 expression
- PKA
- cAMP-dependent protein kinase
- I
- calcium ionophore ionomycin
- PMA
- phorbol myristate acetate
- PE
- phycoerythrin
- Received June 3, 1998.
- Accepted December 11, 1998.
- U.S. Government


