


Abstract
A great deal of experimental evidence suggests that ligands can stabilize different receptor active states that go on to interact with cellular signaling proteins to form a range of different complexes in varying quantities. In pleiotropically linked receptor systems, this leads to selective activation of some signaling pathways at the expense of others (biased signaling). This article summarizes the current knowledge about the complex components of receptor systems, the evidence that biased signaling is used in natural physiology to fine-tune signaling, and the current thoughts on how this mechanism may be applied to the design of better drugs. Although this is a fairly newly discovered phenomenon, theoretical and experimental data suggest that it is a ubiquitous behavior of ligands and receptors and to be expected. Biased signaling is simple to detect in vitro and there are numerous methods to quantify the effect with scales that can be used to optimize this activity in structure-activity medicinal chemistry studies. At present, the major hurdle in the application of this mechanism to therapeutics is the translation of in vitro bias to in vivo effect; this is because of the numerous factors that can modify measures of bias in natural physiologic systems. In spite of this, biased signaling still has the potential to justify revisiting of receptor targets previously thought to be intractable and also furnishes the means to pursue targets previously thought to be forbidden due to deleterious physiology (as these may be eliminated through biased signaling).
I. Introduction
…[The] possibility is raised that selective agonists and antagonists might be developed which have specific effects on a particular receptor-linked effector system…
What is bias? As the word implies, bias suggests an inequality. When this term is applied to cellular signaling mediated by seven-transmembrane receptors (7TMRs), it refers to a pleiotropically linked receptor (one that is coupled to more than one signaling pathway) producing more of some of the signals at the expense of others. Bias can be observed at different levels in the receptor pathway, from the elemental interactions of the receptor with signaling proteins at the beginning of cellular cascades to the end-product whole cell signals themselves. This article will describe biased signaling from the point of view of considering it as a viable pharmacological mechanism that modifies 7TMR signaling to confer possibly better therapeutic profiles on receptor drugs, namely agonists, allosteric modulators, and antagonists.
It is important to differentiate system and measurement bias from true ligand-dependent bias, since it is only the latter effect that can result in an effective therapeutic advantage. System bias concerns the relative sensitivity of pathways connected to the receptor and this is hard-wired by the physiology of the system. Physiologic processes are linked to receptors by cells presumably for optimal signaling efficiency for the cells’ needs; that is, there is no a priori reason that pleiotropic signals should be linked to a 7TMR with equal efficiency. For example, cardiac cells react to elevation of cAMP by increasing calcium for inotropy (increased force of contraction) and also by increasing the rate of calcium uptake back into the sarcoplasmic reticulum for increased cardiac muscle relaxation (lusitropy). The cardiac cell is naturally biased toward lusitropy as a mechanism and lower concentrations of cAMP are required to elevate lusitropy than those required to elevate inotropy (Kenakin et al., 1991). As will be seen, these differential effects are readily seen in bias plots.
To further discuss system (and measurement) versus ligand bias, the most important tool to use is the bias plot; these simply express the response produced in one signaling pathway as a function of the response produced by the same concentrations of the activator in another pathway. Bias plots are a direct measure of the relative effectiveness of a receptor stimulator on two signaling pathways that do not involve mathematical modeling or assumptions about the origins of the signal, and they can be used to assess the uniformity of agonists in producing two signals emanating from the same receptor. Bias plots compare signaling pathways, most often driven by receptor activation. An example of a bias plot for the cAMP pathway is shown in Fig. 1B, which expresses the lusitropic response to forskolin and dibutyryl cAMP as a function of the inotropic response (Fig. 1A). The hyperbolic shape of this function indicates the direction of the system bias (in this case, toward lusitropy). The fact that the trajectories of the two bias plots for forskolin and dibutyryl cAMP are similar suggests that both agents are subject to a uniform system bias; that is, there is no evidence to suggest that forskolin and dibutyryl cAMP affect the two pathways in different ways. Note that a bias plot showing uniform system bias need not be linear but rather will reflect the relative sensitivity of the two signaling pathways as they are used in physiology. Elevations of cAMP through activation of β-adrenoceptors by agonists in rat atria leads to the same lusitropic bias as seen with forskolin and dibutyryl cAMP (see Fig. 1D). As with the previous example, the uniformity of the bias plot trajectories suggests no signaling bias with respect to these two signals produced by these two agonists. Agonists such as those shown in Fig. 1C have been termed “unbiased” or “balanced,” since their effects do not deviate from the normal physiology of the system. However, these are misnomers since they imply that these molecules will produce similar levels of signaling from the dual pathways, a fact that may or may not be true depending on the natural system bias of the tissue. True biased agonism (or antagonism) is relevant only when the agonists are compared with a defined agonist and is usually measured in contrast to a natural endogenous agonist effect (physiologic system bias). That being the case, natural agonists that are unbiased in comparison with true biased synthetic ligands should be referred to as having “natural” bias or at least qualified as naturally unbiased compared with a truly biased ligand.

System bias reflected in a comparison of the ability of elevated cAMP levels in the rat atrial cell, through activation of adenylate cyclase by forskolin and direct addition of cell-permeable cAMP (dibutyryl cAMP) to produce lusitropic (relaxation) and inotropic (force of contraction) responses. (A) Concentration-response curves for lusitropy (solid DR curve lines) and inotropy (dotted lines) for forskolin and dibutyryl cAMP. (B) Bias plot showing the lusitropic response (ordinates) expressed as a function of the inotropic response (abscissae) produced by common concentrations of forskolin and dibutyryl cAMP. Rat atrial cell system bias imposed on elevation of cAMP due to activation of β-adrenoceptors by the agonists isoproterenol (filled and open circles) and pirbuterol (filled and open squares). (C) Concentration-response curves to isoproterenol and pirbuterol for lusitropy (solid lines) and inotropy (dotted lines). (D) Bias plot showing lusitropic responses (ordinates) produced by the agonists as a function of inotropic responses (abscissae) produced by the same concentrations of agonist. DR, dose response. Data are from Kenakin et al. (1991).
Since bias plots compare sensitivities of responses, the efficiency of the assay system necessarily is involved in the measurement; that is, system bias as measured in vitro with two functional assays is also a measure of the physiologic relative sensitivity of the receptor coupling to the pathways and also the relative sensitivity of the functional assays used to make the measurements. System bias reflects any difference from the production and transduction of the receptor stimulus to the point of measurement. For example, if two functional assays have differential sensitivity, then this will be reflected in a curved bias plot. Second messenger assays such as the measurement of cAMP are often highly amplified and agonists have correspondingly high potency. In contrast, β-arrestin complementation assays are usually not highly amplified and agonists have a correspondingly low potency. Comparison of cAMP and β-arrestin assays through a bias plot therefore often shows a high bias toward cAMP simply because of the mechanics of the assay transduction of signals. It is the relative nonlinearity between ligands in a bias plot, not the magnitude of the nonlinearity, that is important in the detection and quantification of ligand-based signaling bias of possible value in therapy. In assessing biased signaling associated with particular ligands, it is essential that system (and measurement) bias be canceled and this is done by comparison with a common reference agonist in the two pathways (vide infra).
Selective ligand bias is manifest as a further bias of the signaling superimposed upon the system bias in the functional assays. An example of this for κ-opioid agonists is shown in Fig. 2. In this case, it is clear that dynorphin 1-11 (Dyn1-11) (solid line curve) is biased toward G protein signaling, whereas GR89696 [4-([3,4-dicholorophenyl]acetyl)-3-(1-pyrrolidinylmethyl)-1-piperazinecarboxylic acid methyl ester fumarate salt] (broken line curve) is biased toward β-arrestin; the other agonists follow a uniform system bias (White et al., 2014). The fact that the other agonists appear to have near linear relationships for the two signaling pathways in this case has no significance, since the relationship defined by system bias is a complex function of assay sensitivity and efficiency of receptor coupling to cellular signaling. As seen in Fig. 2, the ligand bias for Dyn1-11 and GR89696 can be detected through a bias plot and it is this specific property of these ligands that may be exploited for therapeutic advantage.

Bias plot for κ-opioid agonists activating G proteins and β-arrestin (in HEK cells). Ordinates show the fraction of maximal activation of G protein signaling. Abscissae show the fraction of maximal β-arrestin activation. Nalbuphine, β-NNTA, BRL52537, and salvinorin produce similar bias profiles, whereas Dyn1-11 is biased toward G protein signaling and GR89696 is biased toward β-arrestin signaling. β-NNTA, N-naphthoyl-β-naltrexamine; BRL52537, (6)-1-(3,4-dichlorophenyl)acetyl-2-(1-pyrrolidinyl)methylpiperidine hydrochloride. Data are redrawn from White et al. (2014).
When assessing bias with two separate functional assays in vitro, the system and measurement sensitivity can give an erroneous impression of nonconcomitant and sequential signaling from the same receptor. For example, Fig. 3A shows the activation of chemokine (C-C motif) receptor CCR5 by chemokine (C-C motif) ligand CCL3 (Kenakin et al., 2012); the shaded area appears to show a concentration range where CCL3 produces increased inositol phosphate (IP1) with no receptor internalization; moreover, these curves make it appear that internalization commences at concentrations >300 times those needed to elevate IP1; this type of nonsynchronous activation of signaling from the same receptor is not compatible with mass action kinetics. Expression of the same curves as bias plots in Fig. 3B resolves this apparent dichotomy, as it shows that both processes (IP1 and internalization) occur concomitantly with CCL3 receptor occupation but that the signals are of different strength; that is, the receptor reserve for IP1 and the sensitivity of the IP1 assay is greater than that for internalization. Therefore, a direct correspondence between in vitro biased estimates in terms of what will occur in vivo may not be expected.

Activation of the CCR5 receptor with the chemokine agonist CCL3. (A) Responses shown for IP1 production and receptor internalization. The shaded area represents concentrations of CCL3 with apparently no receptor internalizing activity. Data are redrawn from Kenakin et al. (2012). (B) Bias plot of the data shown in (A). It can be seen that both responses occur concomitantly with CCL3 binding but that the intensity of the IP1 response is much greater than the internalization response.
It is useful to consider expectations of biased ligands in physiology. The implication associated with biased signaling is that a reduction in the pleiotropy of natural signaling will occur; that is, the biased agonist will reduce the variety of signals that are not beneficial for therapy (i.e., reduce side effects) but this need not be the case. Natural physiology uses biased signaling to achieve fine control in normal healthy organ systems, and biased ligands basically interfere with this natural balance to yield an unnatural (or at least “unbalanced”) outcome (Luttrell and Gesty-Palmer, 2010; Luttrell et al., 2018). In fact, biased ligands have been seen to recruit signaling pathways that normally are not activated by a given receptor and natural agonist pair (Saulière et al., 2012; Santos et al., 2015). Finally, as with all agonists, the sensitivity of the system controls whether agonism is observed at all. That is, the receptor density and/or stoichiometry of the receptor/signaling elements of the cell may be inadequate to allow a low-efficacy agonist to manifest agonism; under these circumstances, such a molecule will be an antagonist. For orthosteric biased ligands, these occupy the receptor required by the endogenous agonist and this means that in vivo, an important component of biased agonism is antagonism of the natural signaling system (vide infra). In fact, as in the case of the biased angiotensin ligand TRV120027 (also TRV120; (2R)-2-{[(2S)-1-[(2S)-2-[(2S,3S)-2-[(2S)-2-[(2S)-2-[(2S)-5-carbamimidamido-2-[2-(methylamino)acetamido]pentanamido]-3-methylbutanamido]-3-(4-hydroxyphenyl)propanamido]-3-methylpentanamido]-3-(1H-imidazol-5-yl)propanoyl]pyrrolidin-2-yl]formamido}propanoic acid) for heart failure (Violin et al., 2010), the antagonist effect of the molecule may be the predominant therapeutic effect, not the agonism. In general, current studies in vivo indicate that biased ligands, through mixed selective agonism and antagonism, produce effects that are different from those seen with standard agonists and antagonists (Luttrell et al., 2018). As a preface to considering how this drug property may be applied in therapy, a discussion of cellular pleiotropic receptor-based signaling is useful to define the pharmacological systems interacting with drug molecules.
II. Pleiotropic Receptor Systems
7TMRs, also known as G protein–coupled receptors (GPCRs), are nature’s prototypical allosteric proteins and they are designed to bind multiple ligands and change their conformation accordingly to bind multiple intracellular bodies (e.g., signaling proteins) to transmit signals from the extracellular to the intracellular space. Early depictions of 7TMRs describe them as switches binding extracellular ligands (e.g., hormones, neurotransmitters) and subsequently activating signaling proteins in the cell cytosol; in this type of system, receptor signaling is uniform with the only variation with system parameters (e.g., ligand concentration, type) being strength of signal. A great deal of research over the past years has necessitated a revision of this model to an alternative model of receptors as microprocessors able to receive a range of incoming signals and produce a modified range of outgoing signals (Kenakin, 2015a). Receptors demonstrate a wealth of behaviors in the process of signal transduction, beginning with the range of forms they present to the cell as ensembles of microstates of different conformations that can differentially engage a wide array of signaling partners. As a preface to the discussion of how these receptor systems function in the cell, it is useful to consider the various components involved.
A. G Proteins
Canonical 7TMR signaling was first described as an interaction with heterotrimeric G proteins (G[α]/G[βγ]) leading to a ligand/GPCR-catalyzed GDP/GTP exchange on the G[α] subunit to induce structural rearrangement or dissociation of G[α]-GTP and G[βγ] (Denis et al., 2012). The numerous G[α] subunits are transducers of adenylyl cyclase (G[α]s stimulation, G[α]i inhibition), phospholipase C (PLC) (G[α]q), and RhoGEFs (G[α]12/13) (Neer, 1995; Luttrell, 2008; Walther and Ferguson, 2015) to produce a range of intracellular second messengers such as cAMP, inositol triphosphate (IP3), and diacylglycerol (Neves et al., 2002). Receptor G protein–induced production of second messengers such as cAMP also can be temporally and spatially separated from membrane events (Gidon et al., 2014; Luttrell, 2014). First reported in yeast (Slessareva et al., 2006), nonmembrane-based cAMP production has since been reported in mammalian cell systems for dopamine D1 receptors (Kotowski et al., 2011), β2-adrenergic receptors (Irannejad et al., 2013), glucagon-like peptide (GLP)-1 receptors (Kuna et al., 2013), pituitary adenylate cyclase-activating polypeptide (PACAP) type 1 receptors (Merriam et al., 2013), thyroid-stimulating hormone receptors (Calebiro et al., 2015), parathyroid hormone (PTH) receptors (Castro et al., 2005; Ferrandon et al., 2009), sphingosine-1-phosphate receptors (Mullershausen et al., 2009), melanocortin-4 receptors (Molden et al., 2015), and vasopressin type 2 receptors (Feinstein et al., 2013). In addition, G[βγ] variants (dissociated from Ga subunits) can function as independent sources of second messengers (Clapham and Neer, 1997; Dupré et al., 2009). It will be seen that this wide array of G protein subunits forms the basis for a diverse potential for biased signaling.
B. β-Arrestins
GPCR activation sequelae lead to phosphorylation of receptor cytoplasmic domains by second messenger–dependent protein kinases or the G protein–coupled receptor kinase (GRK) family (GRK 1–7), a class of seryl-threonyl kinases that phosphorylate the cytoplasmic tail of agonist-occupied receptors (Pitcher et al., 1998; Lefkowitz and Shenoy, 2005; Drake et al., 2006). The phosphorylated receptors then have a high affinity for a family of proteins called arrestins (four isoforms consisting of two “visual” arrestins, arrestin1 and arrestin4, and two ubiquitous cellular arrestins involved in 7TMR signaling, β-arrestin1 and β-arrestin2). The binding of arrestins to receptors, first reported for rhodopsin by Kühn et al. (1984), results in suppression of G protein activation through competition (Wilden et al., 1986; Wilden, 1995). First characterized for their role in receptor desensitization in mammalian systems (Ferguson, 2001), a variety of subsequent studies confirmed the role of β-arrestin in receptor desensitization to G protein signaling (i.e., receptor desensitization; Kohout and Lefkowitz, 2003; Lefkowitz and Whalen, 2004; Shenoy and Lefkowitz, 2005; Moore et al., 2007). These receptor interactions with β-arrestins also cause receptor internalization and vesicular trafficking, routing, and desensitization (Luttrell, 2008; Walther and Ferguson, 2013, 2015). As early as 1999, it was reported that β-arrestin2 bound nonreceptor tyrosine kinase and c-Src recruited β2-adrenoceptors (Luttrell et al., 1999); subsequent studies revealed that receptor–β-arrestin interactions can lead to the formation of signalsomes (receptorsomes) by functioning as scaffolding proteins for recruitment and further activation of cytoplasmic proteins (Shenoy et al., 2006; Noma et al., 2007; Irannejad et al., 2013). These receptor-bound β-arrestins can interact with extracellular signal-regulated kinase (ERK1/2), protein kinase B, mitogen-activated protein kinase kinase, Raf-1, ubiquitin kinase, and other cytoplasmic proteins (Luttrell et al., 2001; Shenoy et al., 2001; Beaulieu et al., 2005; Del’guidice et al., 2011; Urs et al., 2011; Kuhar et al., 2015), the Src family of kinases (Barlic et al., 2000; DeFea et al., 2000a), E3 ubiquitin ligase Mdm2 (Shenoy et al., 2001), c-Jun N-terminal kinase (JNK) 3 mitogen-activated protein kinase cascades (DeFea et al., 2000b; McDonald et al., 2000; Luttrell et al., 2001), cAMP phosphodiesterases 4D3/5 (Perry et al., 2002), the inhibitor of nuclear factor-κB IκBα (Gao et al., 2004; Witherow et al., 2004), the Ral-GDP dissociation stimulator (Bhattacharya et al., 2002), the actin filament-severing protein cofilin (Zoudilova et al., 2007), diacylglycerol kinase (Nelson et al., 2007), and serine/threonine protein phosphatase 2A (Beaulieu et al., 2004, 2005). In addition, β-arrestins have been shown to potentiate Gαs activity through a β-arrestin–G[βγ] complex that allows multiple rounds of Gαs association and dissociation (Wehbi et al., 2013). Receptors can interact with other signaling partners in addition to G protein and β-arrestins to produce cytoplasmic signaling (Ritter and Hall, 2009), including PDZ domains [multi-PDZ domain protein 1, synapse-associated protein 97, postsynaptic density protein 95, sorting nexin family member 27, Na+/H+ exchange regulatory factors (NHERFs), membrane-associated guanylate kinase] and non-PDZ domain [A-kinase-anchoring proteins, Jak2, 14-3-3]–containing scaffolds (Walther and Ferguson, 2015). Thus, structurally diverse receptorsomes created in different cells can influence pluridimensional efficacy profiles for 7TMR ligands (Maudsley et al., 2011, 2013).
III. Bias and Pluridimensional Efficacy and Affinity
Biased signaling results in a textured cellular response made up of individual elements of biochemical cascade reactions, and this ensures that the efficacy of a ligand has a quality composed of the summation of these various elements. The complexity of this overall efficacy depends on the vantage point taken to observe ligand response; the further toward the endpoint (cellular response), the more complex and textured will be the result. Ligand efficacy can be defined as the imposition of altered behavior of 7TMRs (toward the cell) induced by receptor-ligand interaction. These behaviors are initiated by biochemical reactions resulting from the initial ligand-receptor complex interaction with cellular signaling proteins. It is useful to consider the various starting points (i.e., immediate receptor behaviors) known for 7TMRs—in effect, the individual components of what makes up cellular efficacy.
A. Receptor/G Protein Interactions
As discussed, the first and most prominent interaction noted for 7TMRs is their interaction with G proteins. Mammalian genomes code for 16 different G protein Gα subunits capable of interacting with 7TMRs, and it has been suggested that choices between these constitute the largest source of functional selectivity (Hermans, 2003). These 16 types of Gα subunits associate with an equally diverse set of Gβγ subunits (Hermans, 2003; Oldham and Hamm, 2008) made up of six different β-subunits and 12 γ-subunits (Gautam et al., 1998; Vanderbeld and Kelly, 2000) that form a large network of possible signaling units. Whereas Gβγ subunits are thought to be functionally interchangeable (Smrcka, 2008), activated Gα subunits regulate distinct and nonredundant cellular effectors (Wettschureck and Offermanns, 2005; Hubbard and Hepler, 2006). In addition, restricted tissue expression of some of these elements prevents some combinations. Within this context, the potential compartmentalization and concentrations of some of these elements in cells may contribute to cell-based modifications of biased signaling. This diverse system of G proteins is generally classified into four main functional groupings according to the family of Gα subunits that are predominantly activated: namely Gi/o, Gq/11, Gs, and G12/13. 7TMRs generally can interact with members spanning across these general groupings despite the fact that the G protein functional outcomes can be very different (Michal et al., 2007; Inoue et al., 2012; Saulière et al., 2012). For instance, cannabinoid receptors interact with Gαz, Gαq/11, and Gα12/13 (Diez-Alarcia et al., 2016; Laprairie et al., 2017). Ligand-stabilized receptor conformations drive the selection of G protein interactions and these selections can be discerned within G protein subunit families; for instance, studies with bioluminescence resonance energy transfer (BRET) biosensors have shown that oxytocin analogs differentiate between individual Gi/o family members (Gαq, Gαi1, Gαi2, Gαi3, GαoA, GαoB; Busnelli et al., 2012). Ligand bias between subunit members of G protein families is increasingly observed with agonists for μ-opioid receptors (Gαi1, GαoA; Saidak et al., 2006), dopamine receptors (Gαi1, Gαi2, Gαi3, GαoA, GαoB; Möller et al., 2017), and PTH receptors (Gαs, Gαq/11, and Gαio; Appleton et al., 2013). Signaling also results from activation of Gβ subunits (activation or deactivation of adenylate cyclase, PLCs, phosphatidylinositol 3-kinase) and Gγ subunits (protein kinase D) (Morris and Malbon, 1999; Vanderbeld and Kelly, 2000). Bias between Gα and Gβγ subunit activation also has been observed. For example, the small molecule agonist GUE1654 [7-(methylthio)-2-[(2,2-diphenylacetyl)amino]benzo[1,2-d:4,3-d′]bisthiazole] for Gi/o-coupled oxoeicosanoid receptors produces inhibition of Gβγ otherwise allowing activation of Gα-dependent pathways (Blättermann et al., 2012). This type of bias may be important to drug therapy, as differential activation of specific combinations of Gα and Gβγ subunits is beginning to be recognized in terms of clinical benefits (Piñeyro, 2009; Lin and Smrcka, 2011).
B. Receptor–β-Arrestin Interactions
Another major set of 7TMR-signaling protein interactions occurs with arrestins. In fact, of 350 nonolfactory human 7TMRs, nearly all couple to β-arrestin (Roth and Marshall, 2012; Kroeze et al., 2015). The interaction of receptors with β-arrestins is promoted by receptor activation, phosphorylation of receptors by GRKs (Benovic et al., 1986), and, in certain instances, special interactions and post-translational processes such as palmitoylation (Charest and Bouvier, 2003). Receptor phosphorylation is particularly important to receptor-arrestin interactions (Tobin, 2008; Tobin et al., 2008; Reiter et al., 2012). This phosphorylation of serine/threonine residues produces a distinct pattern at the C terminus or intracellular loops of the receptor referred to as a “barcode” (Tobin et al., 2008; Nobles et al., 2011); different patterns for these have been shown through mass spectrometry proteomics for ligand interactions with β-adrenoceptors (Nobles et al., 2011). Mass spectrometry and receptor phosphorylation-specific antibodies also can be employed to elucidate these unique barcodes (Prihandoko et al., 2015).
In terms of signaling bias, the nature of the ligand-receptor complex has been shown to influence the phosphorylation barcode of the receptor to further influence the signaling outcome of the complex (i.e., signaling bias) (Kim et al., 2005; Tobin et al., 2008; Zidar et al., 2009; Butcher et al, 2011; Nobles et al., 2011; Zhou et al., 2017a). Agonist-specific phosphorylation barcodes have been reported for angiotensin II type I receptors (Xiao et al., 2007; Christensen et al., 2010), opioid receptors (Just et al., 2013), and serotonin 5-HT2A receptors (González-Maeso et al., 2007). For the β1-adrenoceptor, structural evidence that this occurs through unique binding modes for carvedilol and bucindolol has been given (Warne et al., 2012) to describe special conformations that go on to provide unique signaling effects (Reiter et al., 2012). Phosphorylation also has been shown to modify G protein interactions for 5-HT6 receptor changes from ligand-dependent Gαs coupling to a ligand-independent coupling to Cdc42 (Duhr et al., 2014).
There are at least three major possible outcomes of activated receptor–β-arrestin interaction: cessation of G protein signaling (Lohse et al., 1990), internalization of receptors (Lefkowitz, 1998; Ferguson, 2001; Luttrell, 2008; Ahn et al., 2009; Walther and Ferguson, 2013, 2015), and formation of an intracellular scaffold for internal cellular signaling (Luttrell et al., 1999; DeFea et al., 2000a; Lefkowitz and Shenoy, 2005). These mechanisms have been associated with a wealth of physiologic responses to pharmacological activity, including receptor desensitization (Deshpande et al., 2008; Wang et al., 2009; Whalen et al., 2011), receptor internalization (Ferguson et al., 1996; Goodman et al., 1996; Laporte et al., 1999; Hanyaloglu and von Zastrow, 2008), cell apoptosis (Chen et al., 2009), protein cell synthesis (DeWire et al., 2008; Ahn et al., 2009), central nervous system reward (Bohn et al., 2003), and learning and memory (Poulin et al., 2010).
The dependence of receptor internalization on β-arrestin has been demonstrated in numerous studies but there are a diverse number of mechanisms involved in this process. The most extensively characterized involves the receptor/β-arrestin complex binding to clathrin and its adapter protein AP2 (Wilden et al., 1986; Lohse et al., 1990; Ferguson et al., 1996; Goodman et al., 1996; Laporte et al., 1999), the clathrin heavy chain (Goodman et al., 1996), and E3 ligase Mdm2 (Shenoy et al., 2007) to form clathrin-coated vesicles that traffic to the endosome with subsequent possible transfer to lysosomes for degradation or recycling back to the plasma membrane (Cao et al., 1998). The introduction of green fluorescent protein–tagged receptors has moved these types of experiments forward (Barak et al., 1997). A classification system, based on differential affinity of the receptor for arrestin, has evolved from these studies, with class A 7TMRs (e.g., β2-adrenoceptors, μ-opioid receptors, dopamine D1) preferentially binding β-arrestin1 (also known as arrestin2) to be rapidly dephosphorylated and recycled. In contrast, class B 7TMRs (e.g., angiotensin II type A, vasopressin V2, substance P) bind β-arrestin1 and β-arrestin2 (also known as arrestin3) and have equal affinity to form stable complexes that can be retained in the cytosol, recycled, or degraded (Walther and Ferguson, 2013).
Biased signaling involving β-arrestins can be extremely complex due to the fact that arrestins have so many consequential actions in the cell with respect to receptor disposition and signaling and also because there are a number of alternative activities that can be exploited therapeutically. For instance, biased signaling toward β-arrestin–receptor interaction has alternately been suggested to be beneficial for some receptors, such as promotion of antipsychotic dopamine D2 receptor activity (Lawler et al., 1999; Mailman and Murthy, 2010; Allen et al., 2011) and angiotensin-mediated cardioprotection (Violin et al., 2010), or detrimental in conditions such as κ-opioid receptor–mediated dysphoria (White et al., 2014). In terms of internal signaling, receptor-arrestin complexes have been reported to interact with the Src family of tyrosine kinases (Luttrell et al., 1999), a number of mitogen-activated protein kinases (Chavkin et al., 2014), ERK1/2 and JNK3, and p38 (Seo et al., 2011). These effectors can use β-arrestin/receptor complexes as scaffolds to form different signalsomes (Peterson and Luttrell, 2017) to produce long-lasting signals in the cytosol (Luttrell et al., 1999; McDonald et al., 2000; Gong et al., 2008; Song et al., 2009). For some specific receptors, β-arrestin has been shown to scaffold AKT (Schmid and Bohn, 2010; Schmid et al., 2013), PI3K, and phosphodiesterase 4 (DeWire et al., 2007) and also to produce mediation of nuclear signaling such as microRNA processing after β1-adrenoceptor activation (Kim et al., 2014). In addition, β-arrestin complexes have been implicated in ubiquitination (Shenoy et al., 2001) of receptors. Finally, although β-arrestin2 has received the most attention in the literature for these activities, increasing studies with β-arrestin1 have revealed a further variety of cellular effects (Srivastava et al., 2015). For example, GLP-1 receptors interact with β-arrestin1 to promote insulin release in the pancreatic β cell (with application to the treatment of diabetes; Sonoda et al., 2008). Biased signaling through selective arrestin coupling has also been observed for δ-opioid receptors. Specifically, whereas the highly internalizing δ-opioid agonist SNC80 [(+)-4-[(αR)-α-((2S,5R)-4-allyl-2,5-dimethyl-1-piperazinyl)-3-methoxybenzyl]-N,N-diethylbenzamide] initiates receptor interaction with β-arrestin1, the lower internalizing agonists ARM930 and JNJ2078860 preferentially recruit β-arrestin2 (Pradhan et al., 2016).
In terms of receptor internalization, the ligand-receptor conformational complex may or may not code for internalization; for instance, although agonists such as quinpirole promote dopamine D2 receptor internalization, the biased ligand aripiprazole does not (Allen et al., 2011). Receptor internalization can occur with subsequent rapid recycling or with receptor degradation (Tsao et al., 2001; Whistler et al., 2002). For instance, for GLP-1 receptors, the agonist GLP-1 mediates a faster recycling rate than do the synthetic agonists exendin-4 and liraglutide, leading to temporal differences in levels of activation (Roed et al., 2014). There can be even more diverse trafficking ligand effects as in the case of CCR5. This receptor mediates human immunodeficiency virus (HIV)-1 infection, and one therapeutic approach to limiting HIV-1 infection is to internalize the receptor so that the gp120 protein on the HIV viral coat cannot bind. Two chemokines have very different effects: RANTES (regulated on activation normal T cell expressed and secreted; CCL5) promotes rapid internalization of receptor with rapid recycling, whereas the analog AOP-RANTES promotes rapid internalization but with much less and slower recycling of the receptor to the cell surface (Mack et al., 1998).
C. Other Receptor Signaling Partners and Receptor Behaviors
Some 7TMRs express an endogenous PDZ domain at their distal carboxyl termini (Bockaert et al., 2003), allowing them to interact with PDZ domain proteins (Bockaert et al., 2004). These domains generally consist of 80 to 100 residues forming six β-strands and two α-helices. The carboxyl-terminal tail of the receptor can then interact with an elongated surface groove that is situated between the second β-strand and the second α-helix. Three classes of PDZ ligands have been described: class I (-E-S/T-xV/I), class II (-ϕ-ϕ-), and class III (ψ -x-ϕ-), in which ψ represents an acidic residue and ϕ represents a hydrophobic residue (Sheng and Sala, 2001). Many such partners have been proposed (C kinase 1 protein, Golgi reassembly stacking protein, glutamate receptor-interacting protein, and nebulin molecules) but the most extensively characterized interaction is with NHERF1 and NHERF2. For instance, PTH receptor 1 facilitates PLC signaling while inhibiting Gαs/cAMP signaling (Mahon et al., 2002; Mahon and Segre, 2004) through interactions with NHERF1 and NHERF2. In general, these interactions result in effects on transcriptional regulation, intracellular trafficking, and cell growth.
With increasing assay technology has come an appreciation of the wealth of receptor behaviors practiced by 7TMRs during cell signaling and function. In addition to receptor phosphorylation, coupling of receptors to G proteins, β-arrestins and other cytosolic proteins, and ligands may change other behaviors as well. For instance, the μ-opioid receptor agonists DAMGO ([d-Ala2,Nme-Phe4,Gly-ol5]-enkephalin) and morphine increase (whereas endomorphin-2 decreases) lateral mobility of μ-opioid receptors in the cell membrane; the interaction of these effects with membrane cholesterol content produces variable signaling and this suggests a possible mechanism of bias variation with cell type (Melkes et al., 2016).
In addition, 7TMRs are known to oligomerize with other receptors to form homodimers and heterodimers (Gomes et al., 2016). Through such activity, receptor signaling can be increased (dopamine D1-D3 heteromer; Fiorentini et al., 2008), diminished (adenosine A2A-dopamine D2 heteromer; Strömberg et al., 2000), or completely changed (dopamine D1-D2 heteromer; Rashid et al., 2007). In some systems (notably chemokine receptors), receptor dimerization has been proposed as a natural mechanism required for activation (Rodríguez-Frade et al., 1999; Vila-Coro et al., 1999; Trettel et al., 2003; Hernanz-Falcón et al., 2004). In fact, some receptors such as C-X-C chemokine receptor CXCR4 are proposed to function constitutively as dimers (Babcock et al., 2003). Given that oligomerization theoretically offers a new ligand target and/or choices for ligand efficacy, the possibility of bias in such systems would be predicted (Zhou and Giraldo, 2018). Although there are currently little data to definitively suggest that dimerization is involved in biased signaling, a recent study with melanocortin receptors suggests that this may be a fruitful line of research for selective receptor activation (Lensing et al., 2019).
D. Internal Signaling
Finally, a relatively new receptor behavior has been described, whereby receptor–G protein signaling complexes translocate to the endoplasmic reticulum, Golgi apparatus, and nucleus (Revankar et al., 2005; Re et al., 2010) and continue to signal (Castro et al., 2005; Hein et al., 2006; Boivin et al., 2008). In fact, such intracellular signaling has been described in unique terms therapeutically in treatments for multiple sclerosis (Mullershausen et al., 2009), pain (Geppetti et al., 2015; Cahill et al., 2017), and nociception (Jensen et al., 2017). The vast array of interactions possible within receptor systems offers the opportunity for natural fine-tuning of cell signaling.
IV. Naturally Biased Signaling in Physiology
The stabilization of select multiple conformations of the receptor with a wide range of signaling effector molecules is theoretically optimal for fine-tuning cellular response, and this opens the question of whether these mechanisms are used by natural physiology. There are three lines of thought that would suggest this to be the case; the first two are theoretical. If it is accepted that receptors form ensembles of multiple conformations (in varying quantities) and that ligands form unique ensembles according to the differential affinity they have for each of the ensemble members (Burgen, 1981; Bosshard, 2001; Vogt and Di Cera, 2013), then for two agonists to have an identical pattern of bias they would need to have identical affinities for each of the natural ensemble members (and thus produce identical ligand-bound ensembles), an unlikely scenario. Conformational selection by a ligand binding to an ensemble of n members differing in relative quantity by an allosteric constant Li (Li = [Ri]/[Rref], [Rref] being a common reference conformation) and where the affinity of ligand for each member differs by a value αi is given by (Kenakin, 2013) as shown in eq. 1: (1)where ρ0 represents the ensemble configuration in the absence of the ligand and ρ∞ is the configuration in the presence of a saturating concentration of ligand. It can be seen from this equation that ligand binding will not change the configuration of the ensemble only if α = 1 for each and every conformation (i.e., the ligand has identical affinity for every conformation). If the ligand has a different affinity for any conformation, the relative amounts of the conformations will change upon ligand binding. This would suggest that different ligands would naturally be at least slightly biased, in terms of signaling, with respect to each other. This leads to the notion that natural multiple ligands for given receptors would be internally biased and thus produce different qualities of efficacy in natural physiologic systems. In fact, it has been seen that with complex downstream signaling patterns through analysis of gene arrays, synthetic ligands invariably produce biased signaling fingerprints compared with natural endogenous agonists (Luttrell and Kenakin, 2011; Maudsley et al., 2012).
The second theoretical idea comes from the known behavior of allosteric proteins. Specifically, the effect of a ligand on an allosteric protein is probe specific, such that the influence of a ligand on the subsequent interaction of the ligand-protein complex with proteins and ligands will be unique to that particular ternary complex of ligand/receptor/signaling protein (Edelstein and Changeux, 2016); this is the essence of agonist efficacy. This being the case, each ligand-bound receptor would have a different propensity to interact with the array of signaling proteins available for subsequent binding. To infer that two ligands will have identical bias would further imply that they would have identical probe dependence.
A third line of thought supporting a general acceptance of natural signaling bias comes from emerging experimental data showing that multiple natural ligands for common receptors, when subjected to scrutiny, actually do demonstrate signaling bias. The first documented case of natural signaling bias was for the PACAP receptor expressed in Lilly Laboratories cell-porcine kidney 1 cells, where it was shown that two natural peptides for this receptor (PACAP1-27 and PACAP1-38) produce differential activation of cAMP and IP3 signaling. Specifically, PACAP1-38 produces a rank order of activity of cAMP > IP3, whereas PACAP1-27 produces a reverse rank order of IP3 > cAMP through the same receptor (Spengler et al., 1993). In fact, systems with multiple natural endogenous agonists and/or antagonists are clear targets for investigating the notion that natural physiology employs biased signaling to fine-tune signaling. For example, the melanocortin receptor system, which has the natural peptide agonist α-melanocyte–stimulating hormone and the natural antagonist agouti-related peptide, has been reported to show signaling bias within these molecules (Yang and Tao, 2016). Similarly, the protease-activated receptor 2 (PAR2) has multiple natural agonists associated with the variety of proteases that cleave the receptor at different sites; these different resultant agonists have been shown to differentially signal through the multiple pathways linked to PAR2 (Suen et al., 2014; Jiang et al., 2017). Similarly, whereas trypsin and tryptase neutrophil elastase cleave the receptor to generate an agonist that activates all known PAR2 receptor signaling, neutrophil elastase cleaves the receptor to form an agonist that activates ERK but not calcium signaling (Zhao et al., 2014b).
A prominent system for possible biased signaling is the chemokine receptor system for the control of leukocyte migration in homeostatic and inflammatory physiologic processes. In this system, 19 receptors are activated by 47 chemokines and redundancy apparently abounds. For example, the CCR5 receptor interacts with seven natural chemokines, two of which also interact with CCR2 and three of which also interact with CCR1 (Wells et al., 2006). Reported biased signaling within this natural system has been found for the CCR7 chemokine receptor. Specifically, the endogenous agonists CCL19 and CCL21 are biased, in terms of signaling, with respect to each other. Although both produce G protein activation, only CCL19 (not CCL21) causes receptor agonist-dependent phosphorylation and recruitment of β-arrestin to terminate the G protein stimulus (Kohout et al., 2004). Later studies on this receptor confirmed and extended this finding (Byers et al., 2008; Hauser and Legler, 2016). Another example of natural biased signaling is found in the expression of splice variants of CXCR3 (the CXCR3 primary transcript has three natural alternative splice variants). Specifically, four natural agonists for this receptor (CXCL4, CXCL9, CXCL10, and CXCL11) demonstrate very different biased signaling (with respect to G protein vs. β-arrestin) on these variants to affect cell-based signaling selectivity (Berchiche and Sakmar, 2016). The chemokine system is currently an active target for drug discovery and strategies employing biased signaling are under investigation (Amarandi et al., 2016; Anderson et al., 2016; Roy et al., 2017). Another multiple natural agonist system involves the Class Frizzled (FZD1–10) receptors activated by the WNT family of lipoglycoproteins; these endogenous ligands are shown to have natural bias toward different downstream signaling pathways producing functional selectivity within a complex network of signaling pathways (Dijksterhuis et al., 2015) Finally, although there is evidence for biased signaling within collections of natural multiple endogenous agonists, this mechanism also is operable for metabolites of natural agonists to produce modified signaling after agonist metabolism. For example, the catabolism of adenosine to inosine produces a biased new agonist with altered signaling properties (Welihinda et al., 2016). As will be seen in later sections of this article, the production of unique active-state receptor conformations to produce biased signaling is a mechanism that can produce cell-based biased effects due to the relative stoichiometry of receptors and signaling proteins. Thus, natural signaling can further be diversified at the level of the cell. Table 1 shows other natural pleiotropic receptor systems demonstrating natural signaling bias within the array of endogenous agonists known for those receptors.
Naturally biased signaling
The acceptance of natural signaling bias also opens the question of alteration in natural signaling with changes in physiology (i.e., through protein mutation). It might be expected that changes in receptors and/or signaling proteins would lead to changes in natural biased signaling and, in fact, this has been observed. Thus, mutations of critical amino acid residues have been seen to produce alterations in bias between G proteins and β-arrestin for the muscarinic M2 receptor (Gregory et al., 2010) and between Gq and Gs proteins for the NK1 receptor (Valentin-Hansen et al., 2015). Differences in bias also have seen documented for receptor isoforms such as the histamine H2 receptor (Riddy et al., 2017). These effects extend to mutations found in disease such as the alterations in signaling bias seen for the prokineticin receptor 2 in Kallman syndrome (Sbai et al., 2014).
V. Therapeutic Application of Biased Signaling
From the very first discussions of receptor signaling bias, the concept has been proposed as a means to make more selective and effective drugs. The first application of this idea was toward the design of better antipsychotic drugs by Mailman and colleagues (Lawler et al., 1994, 1999), studies which led to the identification of the atypical antipsychotic drug aripiprazole (Urban et al., 2007). Based on early studies showing that the angiotensin analog SII ([Sar,Ile4,Ile8]-angiotensin II) does not activate Gq protein but does trigger β-arrestin recruitment to the receptor (with subsequent ERK1/2 activation) (Azzi et al., 2003; Wei et al., 2003), an early biased ligand to be taken into the clinic was the analog TRV027 for heart failure (Violin et al., 2010; Felker et al., 2015); this molecule was developed as an improvement on existing angiotensin receptor blockers such as losartan. Specifically, although blockade of angiotensin receptor-mediated pressor effects is beneficial in heart failure (reduction in cardiac afterload), the added β-arrestin signaling properties of TRV027 are proposed to offer an advantage through cardioprotective effects (Violin et al., 2010; Monasky et al., 2013). Thus, TRV027 enhances cardiac contractility and output (Violin et al., 2010) and is distinguishable from angiotensin-converting enzyme inhibitors and angiotensin receptor blockers by controlling vascular effects to prevent prolonged hypotension (Violin et al., 2014). This line of research for heart failure is being continued with another biased angiotensin ligand TRV067, which blocks Gq protein signaling while producing sensitization of myofilament calcium-responsiveness in a genetic mouse model of dilated cardiomyopathy (Ryba et al., 2017).
A second biased drug, TRV130 (N-[(3-methoxythiophen-2-yl)methyl]-2-(9-pyridin-2-yll-6-oxaspiro[4,5]decan-9-yl)ethanamine), a μ-opioid receptor agonist for postoperative pain, is also currently in clinical trials (Chen et al., 2013a; Violin et al., 2014). The rationale for advancing this molecule is the preclinical data showing that analgesia is associated with Gαi activation, whereas gastrointestinal dysfunction, respiratory depression, and tolerance may be linked to β-arrestin2 recruitment (Bohn et al., 1999, 2000; Ikeda et al., 2002; Raehal et al., 2005; Li et al., 2009; Yang et al., 2011; DeWire et al., 2013). Although the treatment of moderate to severe acute pain has been confirmed for TRV130 (Soergel et al., 2014; Viscusi et al., 2016), typical opioid agonist side effects were still found to occur (Viscusi et al., 2016). This is consistent with effects seen in mice, in which TRV130 produced antinociception but concomitant inhibition of gastrointestinal function and weak abuse-related effects. However, repeated treatment failed to produce tolerance seen with morphine (Altarifi et al., 2017). Subsequent studies in this area have advanced a similar analgesic in TRV734 (White et al., 2015). In addition, medicinal chemical strategies to direct μ-opioid receptor stimulus toward G protein activation versus β-arrestin2 in scaffolds such as PZM21 (1-[(2S)-2-(dimethylamino)-3-(4-hydroxyphenyl)propyl]-3-[(2S)-1-(thiophen-3-yl)propan-2-yl]urea) (Manglik et al., 2016; Hill et al., 2018) have resulted in a profile of analgesia with minimal constipation and respiratory depression (Soergel et al., 2014; Viscusi et al., 2016).
The translation of biased signaling to in vivo systems involves assessments of the impact of the unique signaling profiles of molecules. An important aspect of this question is the determination of the effects of biased signaling on natural physiology; this furnishes data to guide the rational design of new biased molecules for therapeutic advantage. Genetically modified systems have been instrumental in this process.
A. Assessing the Impact of Biased Signaling on Natural Physiology
One of the main tools available to pharmacologists in the interpretation of in vitro bias in terms of what it may mean in vivo is the genetic knockout system (i.e., a frequent approach is to produce genetic knockouts for β-arrestin to assess the importance of this signaling system). Although deletion of both nonvisual arrestin isoforms is lethal, individual deletion of β-arrestin1 or β-arrestin2 can be studied (Kohout et al., 2001). Thus, it can be seen that opioid analgesics such as morphine produce less respiratory depression in β-arrestin knockout mice (compared with wild-type mice) (Raehal et al., 2005), leading to the hypothesis that μ-opioid agonists with less propensity to induce receptor–β-arrestin interaction might offer a better margin of analgesia (over respiratory depression; e.g., see data with TRV027; Violin et al., 2014). Mice devoid of β-arrestin2 (but not β-arrestin1) have demonstrated altered behavioral responses to addicting drugs such as morphine (Bohn et al., 2003; Urs and Caron, 2014), amphetamine (Urs and Caron, 2014), and alcohol (Li et al., 2013). In general, the use of transgenic mice has identified β-arrestin2 as a clear mediator of unwanted μ-opioid receptor agonism (Raehal et al., 2005). Similarly, the fact that PTH analogs do not effectively produce bone in β-arrestin knockout mice leads to the hypothesis that G protein–biased PTH agonists could offer better profiles for therapy in osteoporosis (Ferrari et al., 2005). There are cases in which genetic modification of systems can be linked to actual therapeutically relevant drug profiles. For instance, the biased ligand UNC9975 (7-[4-[4-(2,3-dichlorophenyl)-1,4-diazepan-1-yl]butoxy]-1,2,3,4-tetrahydro-1,8-naphthyridin-2-one) displays potent antipsychotic-like activity without induction of motoric side effects in inbred C57BBL/6 mice. Furthermore, genetic deletion of β-arrestin2 attenuates antipsychotic activity, thus transforming UNC9975 from an atypical to a typical antipsychotic (Allen et al., 2011).
Technological advances have enabled genetic knockout systems to be made (e.g., Rohrer and Kobilka, 1998) and these have enabled the study of physiologic systems without selected components in studies to determine the importance of those components to the physiology. In general, knockout animals have been instrumental in identifying physiologically relevant pathways for drug candidates for dopamine D1 receptors (Xu et al., 1994a,b), metabotropic glutamate 1 receptors (Aiba et al., 1994), 5-HT2B receptors (Saudou et al., 1994), angiotensin 1A receptors (Ito et al., 1995; Coffman, 1997), μ-opioid receptors (Sora et al., 1997), α2b-adrencoceptors, (Link et al., 1996; MacMillan et al., 1996), α1b-adrenoceptors (Cavalli et al., 1997), β1/β2-adrenoceptors (Rohrer et al., 1999), β3-adrenoceptors (Susulic et al., 1995), and muscarinic M3 receptors (Duttaroy et al., 2004). Similar outcomes have been observed through ablation of receptor effects through application of RNA-guided CRISPR/Cas9 endonucleases (Naylor et al., 2016).
Complimentary data are obtained from knock-in studies whereby the endogenous GPCR gene is replaced with a gene for a mutant receptor and the expression of that mutant is driven by the wild-type promoter; the aim of this approach is to express the mutant receptor in the same tissue types and at the same receptor levels as the wild-type receptor. An example of the application of this technology is found in the elucidation of the relative contributions of δ- and μ-opioid receptors in the sensation of mechanical and heat pain with enhanced green fluorescent protein δ-opioid receptors (Scherrer et al., 2006, 2009; Pradhan et al., 2009; Shenoy and Lefkowitz, 2011; Faget et al., 2012). Similarly, the impact of muscarinic M3 receptor phosphorylation on learning, glucose tolerance, and insulin release has been studied with phosphorylation-deficient M3 receptors (Kong et al., 2010; Poulin et al., 2010). These phosphorylation-deficient muscarinic M3 receptors do not internalize but couple normally to G protein–dependent signaling such as PLC/calcium mobilization mechanisms (Budd et al., 2001; Urban and Roth, 2015).
Inserting a coding sequence of a mutant receptor that is only activated by a synthetic ligand [to code for a designer receptor exclusively activated by designer drugs (DREAD); Conklin et al., 2008; Urban and Roth, 2015] is a powerful technology whereby the relevance of certain signaling to cognate physiology can be assessed (Peng et al., 2008). The first application of this approach was made with the κ-opioid receptor modified to contain the second extracellular loop of the δ-opioid receptor (Coward et al., 1998) to yield a receptor with a 200-fold reduction in the binding of the endogenous opioid agonist dynorphin (and reductions in the binding of 21 other opioid peptides) but maintained binding and activation for the synthetic agonist spiradoline. This receptor was given the name RASSL for “receptor activated solely by a synthetic ligand.” A problem with early studies with RASSLs was that the retention of activity of the synthetic ligand for native receptors caused concomitant activation of native receptors in the transgenically modified animals in addition to the RASSLs (Redfern et al., 1999). In addition, RASSLs often have a high level of constitutive activity, further complicating interpretation of experimental data (Hsiao et al., 2008). These drawbacks led to the development of second-generation RASSLs named DREADs, in which the agonist (clozapine-N-oxide) has no other activating properties for native receptors (Armbruster et al., 2007; Conklin et al., 2008; Giguere et al., 2014; Urban and Roth, 2015). Using this technology, the role of M3 receptor signaling (Armbruster et al., 2007; Dong et al., 2010) and free fatty acid receptor-2 signaling (Hudson et al., 2012) has been explored. DREADs have been used to evaluate the importance of biased signaling in different cell types as in studies on the cell type–specific expression of a muscarinic M3 receptor DREAD mutationally modified to not interact with β-arrestin but rather only Gq/11 proteins (Hu et al., 2016). A related approach allows the activation of the mutant receptor optically through light (Levitz et al., 2013), a new technology as yet to be applied to the study of signaling bias.
Finally, there are obvious caveats to the interpretation of these studies to human therapeutics. Differences in animal versus human signaling can confuse conclusions from the data. For instance, it has been suggested that cannabinoid CB1 receptor signaling differs between humans and rodents (Straiker et al., 2012). In addition, the known changes in signaling preferences of receptors with receptor mutation (vide infra), as well as the expectation of signaling signatures different from natural ones with synthetic agonists such as clozapine-N-oxide, raises the specter that DREADDs will give misleading signaling profiles in natural physiology. At present, studies to assess this are consistent with this not being a tangible problem (Alvarez-Curto et al., 2011).
B. Assessing the Impact of Biased Signaling from Known Ligands
Retrospective analyses have provided insights into how some uniquely beneficial currently used therapeutic drugs achieve their favorable profiles through biased signaling. Thus, the beneficial effects of carvedilol, a nonselective β-adrenoceptor inverse agonist for Gαs-mediated cAMP production in congestive heart failure, have been attributed to its β-arrestin–mediated partial agonist activity for activation of ERK1/2 (Wisler et al., 2007; Kim et al., 2008). Similar signaling profiles have been associated with nebivolol (Erickson et al., 2013), alprenolol (Kim et al., 2008), and propranolol (Azzi et al., 2003; Baker et al., 2003). The diminished respiratory depression potential of the opioid analgesic levorphanol (over morphine) has been attributed to its biased signaling profile (lack of β-arrestin2 recruitment) (Le Rouzic et al., 2019). In fact, the dependence liability of oxycodone, hydrocodone/paracetamol, and hydromorphone has been attributed to biased signaling (toward G protein vs. β-arrestin) (Johnson et al., 2017). The cardioprotective and cardiac fibrosis–modulating properties of the adenosine agonist capadenoson (currently in clinical trials) have been attributed to its biased cAMP activity through adenosine 2b receptor activity (Baltos et al., 2017). The biased activation of Gs protein (over nonspecific dual Gs and Gi activation) for fenoterol has been proposed as a favorable property for this bronchodilator (Jozwiak et al., 2010). Similarly, the tolerance seen with morphine, as opposed to other μ-opioid receptor agonists, has been attributed to this agonist’s selective signaling through β-arrestin2 as opposed to β-arrestin1 (Raehal and Bohn, 2011).
Irrespective of novel therapeutics, biased ligands can be valuable probes of physiologic processes and disease states. For example, PAR2, which is highly expressed in HT-29 colorectal carcinoma cells, is implicated in cancer (Elste and Petersen, 2010). Through observation of the effects of newly developed PAR2 biased agonists, the relative importance of ERK1/2 versus calcium signaling in human cancer through this receptor has been studied (Jiang et al., 2017). Similarly, comparison of nonpeptide biased agonists of the nociception/orphanin FQ receptor has been applied to study the pharmacology of nociceptin orphanin activation in disease states (Ferrari et al., 2017). Elegant studies with a range of biased PTH analogs have been valuable in elucidating the complicating bone-building and bone resorption effects of PTH for therapy of osteoporosis (Luttrell et al., 2018). The study of the biased κ-opioid receptor antagonist norbinaltorphimine has enabled linkage of JNK signaling to long-term blockade of antinociception (with no ERK activity) and selective long-term effects on regulation of κ-opioid receptors (Jamshidi et al., 2016). A novel application of bias in the delineation of the role of β-arrestin signaling in cardiac β-adrenoceptor function has been suggested in the use of a biased pepducin, (ICL)-1-9 [TAIAKFERLLQTVTNYFIT], to decouple β-arrestin signaling from occupation of the receptor (Carr et al., 2016). Biased ligands have been especially valuable in the study of systems where there appears to be duplication and crossover between ligands and receptors such as the chemokine receptor system (Amarandi et al., 2016; Milanos et al., 2016a).
For peptide receptors, truncation of the natural peptide can lead to biased analogs of value in the delineation of physiologic pathways. For example, a biased analog of human neuropeptide S, hNPS-(1-10) lacks 10 residues from the C terminus of the natural peptide and preferentially activates Gαq-mediated calcium mobilization with less activity at Gαs (compared with the natural peptide); this analog produces no physiologic effect in vivo, providing a unique probe of the physiology and therapeutic potential of hNPS-directed signaling (Liao et al., 2016). Biased agonists can dissect complex signaling patterns of endogenous agonists to determine dominant signaling. For instance, the dependence on various physiologic endpoints of free fatty acid receptor-2 stimulation on different signaling was determined through studies with the biased agonist AZ1729 (N-[3-(2-carbamimidamido-4-methyl-1,3-thiazol-5-yl)phenyl]-4-fluoro benzamide), which predominantly activates only Gi (not Gq/G11) signaling (Bolognini et al., 2016).
Beyond using biased ligands to probe natural physiology, this idea has been advanced as a strategy for the design of better (i.e., more selective) drug therapy with fewer side effects. There are basically four rationales for this approach: 1) emphasis of a therapeutically favorable signal (i.e., PTH in osteoporosis; Gesty-Palmer and Luttrell, 2011; Gesty-Palmer et al., 2013), 2) de-emphasis of an unfavorable signal (respiratory depression for opioid agonists; Raehal et al., 2005; Kelly, 2013; Koblish et al., 2017), 3) production of limited signaling to allow prosecution of otherwise forbidden drug targets (i.e., κ-opioid receptors; White et al., 2014; Brust et al., 2016), and 4) emphasis of a favorable signal and prevention of the natural system production of an unfavorable signal (i.e., angiotensin in heart failure; Violin et al., 2006, 2010). Based on these general ideas, Table 2 shows a sampling of receptors and therapeutic applications of biased signaling that have been proposed in the literature as possible avenues toward better drug therapy.
Preconceived strategies for applying biased signaling to therapeutic advantage
One important consideration in the evaluation of biased signaling in therapeutics is the difference between natural nondiseased systems that are used for ligand characterization and pathologically modified systems in therapy (Insel et al., 2015). In disease states, the relative stoichiometry or components and sensitivities of cells are known to vary. For example, GRK2 is upregulated in heart failure, leading to an increased phosphorylation of β-adrenoceptors and downregulation of receptors (Casey et al., 2010). In hypertrophic myocytes from mice with heart failure, levels of G protein were found to be upregulated (i.e., Gαo, 7.5-fold; and Gα11, 12.5-fold) leading to differences in β-adrenoceptor agonist biased signaling (Onfroy et al., 2017). Similarly, the apelin pathway is known to be downregulated in heart failure (Yang et al., 2015). The natural signaling bias of the calcium-sensing receptor is also altered in disease states (for review, see Leach et al., 2015). Models of dystonia (a common movement disorder) involving mutation of the protein torsinA demonstrate a pathologic increase in cholinergic tone to affect dopamine interneurons, and there is a change in dopamine signaling polarity and a bias introduced into dopamine signaling from primarily Gi/o to noncanonical β-arrestin signaling (Scarduzio et al., 2017). In general, biased signaling is an obvious mechanism to exploit for drug therapy and the existing data with characterized biased ligands certainly show different phenotypical signaling profiles in vivo. What is lacking at this time is a systematic linkage between in vitro profiles of biased signaling and the translation to in vivo systems.
VI. Molecular Mechanism(s) of Ligand Bias
The first proposed and still most commonly cited mechanism of agonist-induced biased signaling is the selective stabilization of unique receptor conformational “active” states (from the point of view of interacting in a fruitful way with a signaling protein to induce a cellular signal) (Kenakin and Morgan, 1989; Kenakin, 1995); subsequent literature supports this hypothesis (Nickolls et al., 2005). It is worth examining this idea in light of our present understanding of receptor systems. 7TMRs are pleiotropic with respect to the proteins with which they interact. The coding for these interactions is embodied in the tertiary conformation of the receptor either through a spontaneous isomerization (i.e., constitutive activity) or due to the interaction with another body such as a ligand or accessory protein. The simplest model for such activation is the formation of a single uniform receptor active state that triggers activation of all signaling bodies interacting with the receptor. Ostensibly, this idea appears to be contained in the simple extended ternary complex model for 7TMRs published in 1993 (Samama et al., 1993):
where an equilibrium exists between the inactive ([Ri]) and active ([Ra]) state of the receptor and is controlled by an allosteric constant L. The equilibrium association constants for ligand [A] and G protein [G] for the receptor are Ka and Kg, respectively. α represents the difference in the affinity of the ligand for the active state over the inactive state, and γ is the difference in the affinity of the agonist-bound receptor when the active-state receptor ([Ra]) is and is not bound by agonist. However, such a simplistic interpretation of a single receptor active state within this model is an illusion, since it can be seen that variation in the γ term describing the affinity of the agonist-bound receptor and G protein is a variable that can change with agonist type (i.e., this model basically describes an infinite number of receptor active states contained in the value of γ with each agonist binding to the receptor). This is in accordance with standard allosteric theory, which dictates that allosterically interacting bodies (in this case, the ligand and G protein both interacting with the receptor) practice probe dependence; that is, the effect of different probes on the receptor conformation with respect to the interaction with other probes will differ with the nature of that probe. Since allosteric energy is reciprocal, there is another probe dependence that becomes operative as the ligand-bound receptor interacts with a signaling protein (namely a dependence relating to the type of signaling protein). Thus, as the agonist-bound receptor binds to different G proteins, there will be a unique γ value for every G protein (or indeed any other signaling protein in the membrane). It can be seen that this can theoretically lead to a very large number of unique possibilities. As a preface to the discussion of these types of systems, consideration of the nature of agonist efficacy is useful (i.e., how does a ligand participate in the transformation from Ri to Ra?).
Thermodynamic considerations for the scheme shown in Fig. 4 strongly suggest that conformational selection would be the only feasible mechanism to yield production of ARa by a ligand within the timeframe required to sustain life in cells (Burgen, 1981; Bosshard, 2001; Vaidehi and Kenakin, 2010; Vogt and Di Cera, 2013). This being the case, the first consideration for agonist-induced biased signaling is the number of choices the ligand has to select from. The scheme shown in above suggests only two, but the allosteric nature of functional receptor systems (Tucek, 1997), as well as the natural flexible nature of 7TMRs (Liapakis et al., 2012), argues against a simple two-state selection. In fact, the inherent flexibility of proteins possessing marginal conformational stability under physiologic conditions (ΔGfolding = −5 to −10 kcal/mol; Privalov and Khechinashvili, 1974; Williams et al., 2007) ensures a high degree of function-related conformational flexibility (Frauenfelder et al., 1979; Tang and Dill, 1998; Williams et al., 2007). In addition, a great deal of experimental evidence since the proposal of the extended ternary complex model and the introduction of molecular dynamics into pharmacology has provided an alternative view, namely the selection of receptor conformations from a preexisting ensemble of similar but different conformations (Boehr et al., 2009; Dror et al., 2010, 2011; Park, 2012; Nygaard et al., 2013; Motlagh et al., 2014). This ensemble of receptor conformations forms a dynamic system (Vardy and Roth, 2013; Manglik and Kobilka, 2014; Manglik et al., 2015), which then interacts with signaling systems through a full range of allosteric linkages (Monod et al., 1965; Changeux and Edelstein, 2005); these ideas have been discussed in terms of oscillating dynamic systems of multiple conformations (Cui and Karplus, 2008; Changeux and Edelstein, 2011) that produce “fluctuating networks” operating on a real-time scale of microseconds (Ichikawa et al., 2016).

Receptor system whereby the receptor can exist in an active (Ra) and inactive (Ri) state. A ligand (A) binds to both with varying affinity. Conformational selection is where the ligand preferentially binds to a preexisting Ra state, and conformational induction is where the ligand binds to the Ri state to convert it to the Ra state.
Many techniques have demonstrated that receptors can be stabilized by ligands into a range of different conformations (Luttrell and Kenakin, 2011). For instance, in studies with β-adrenoceptors, multiple conformations have been demonstrated through the use of a monobromobimane-labeled receptor (Yao et al., 2006), whereas hydrogen/deuterium exchange coupled with mass spectrometry reveals a range of changes in the kinetic behavior of the β-adrenoceptor in different regions (West et al., 2011). Fluorescence spectroscopy has also been used to study conformational heterogeneity for vasopressin receptors (Rahmeh et al., 2012), whereas differential ligand modulation of the β2-adrenoceptor energy landscape has been shown through dynamic single-molecule force spectroscopy (Zocher et al., 2012). More recently, NMR studies have shown that different ligands stabilize different conformations within these ensembles (Kofuku et al., 2012; Liu et al., 2012; Nygaard et al., 2013). This idea has been extended to the stabilization of unique receptor conformations by nanobodies for β-adrenoceptors (Rasmussen et al., 2011), which show a variety of effects on cAMP signaling and β-arrestin recruitment (Staus et al., 2016).
Theoretical computational methods can be used to rationally design ligand-receptor active-state complexes. These active-state conformations have higher energy than inactive states and are thus more unstable. For this reason, computational methods are biased toward lower energy structures. However, recent advances in computational techniques have made inroads into the prediction of ligand-receptor active-state conformations of higher energy (Milanos et al., 2016b; Dong et al., 2017). In allosteric systems, it is important to consider all of the interactants, as each will have an influence on the behavior of the others. Therefore, it is important to consider the variety of signaling proteins and their conformations (specifically, the fact that these too form ensembles). Arrestins are known to exist in at least three distinct conformations (free, receptor bound, and microtubule bound; Gurevich et al., 2018) and within these categories, further heterogeneity exists. For instance, fluorescent arsenical hairpin BRET probes reveal that β-arrestin2 exists as a dynamic conformational ensemble (Lee et al., 2016). In fact, there is considerable evidence that structural disorder of arrestin elements appears to be important to their functionality (Gurevich et al., 2018). In terms of arrestin ensembles, the complexation of arrestins with receptors initiates signaling that free arrestins do not (Peterson and Luttrell, 2017), as shown by the enhancement of the affinity of ERK1/2 to arrestin by receptor recruitment (Luttrell et al., 2001) with activation occurring only after receptor stimulation (Luttrell et al., 2001; Coffa et al., 2011). Active-state β-arrestin2 conformations that lead to cellular signaling, promoted by the angiotensin ligands SII and angiotensin II and distinct from other conformations in the ensemble, have been described (Shukla et al., 2008). In fact, it has been shown through biophysical (Nobles et al., 2007), mutation (Gurevich and Gurevich, 2006), and crystallographic (Shukla et al., 2013) experiments that β-arrestins undergo extensive conformational changes upon binding to phosphorylated receptors. Furthermore, it has been shown that different β-arrestin2 active-state conformations lead to different downstream signaling outcomes in the cell (Shukla et al., 2008; Zimmerman et al., 2012). In fact, it has been shown that different ligands binding to the same receptor can change the “population average conformational signature of arrestins” (Luttrell et al., 2018) to produce variable signaling outcomes (Lee et al., 2016; Nuber et al., 2016). For example, the application of fluorescence resonance energy transfer–based β-arrestin2 biosensors in real time in living human cells indicates that β-arrestins remain active after dissociation from receptors to signal independently at the cell surface (Nuber et al., 2016).
Evidence of heterogeneous agonist-receptor complexes with different signaling proteins has been generated with biosensors on receptor proteins that measure the probe environment with conformational change; an early study on β-adrenoceptors with this technique was published by Ghanouni et al. (2001). More recent studies with biosensors can discriminate between different ternary complexes (agonist/receptor/signaling protein). An example of this technique is seen with the angiotensin II type 1 receptor (Devost et al., 2017). Specifically, bioluminescence signals reporting energy transfer from the interaction of a Renilla luciferase as an energy donor placed at the distal end of the receptor C-tail and a small fluorescent arsenical hairpin molecule as an energy acceptor placed at various positions in the intracellular loops of the receptor were used to measure conformations changes (see Fig. 5A; Devost et al., 2017). With this system, it was observed that a range of angiotensin II type 1 receptor agonists produce unique receptor–G protein complexes from the point of view of conformation. Specifically, probes placed in three different regions of the receptor reflect differing BRET signals indicating varying distances and thus differing conformations (see Fig. 5B). BRET experiments have been used to identify δ-opioid receptor agonist-selective receptor conformations as well (Audet et al., 2008).

(A) Ligand-selective conformational states of the angiotensin II type 1 receptor revealed with biosensors. A Renilla luciferase energy donor interacts with a small fluorescent molecule FlAsH as an energy acceptor placed at different positions on the intracellular loops of the receptor. (B) Unique ligand-selective complexes are indicated by the varying BRET signals (indicative of varying distances between the elements) produced by the sensors. ANG, angiotensin; CTL, C tail; DVG, (Asp1,Val5,Gly8)-AngII; FLAG, FlAsHwalk-tagged epitope; FlAsH, fluorescent arsenical hairpin; ICL, intracellular loop; SBpA, (Sar1,Bpa8)-AngII; SI, (Sar1,Ile8)-AngII; SII, (Sar1,Ile4,Ile8)-AngII. Redrawn from Devost et al. (2017).
Finally, it is not yet clear how some subtle trafficking of stimulus is achieved further down into the cell cytosol. Two possible mechanisms for this are 1) a persistent binding of the agonist to the receptor to code for cytosolic control of effector interaction and 2) agonist-dependent stabilization of conformations that then are phosphorylated with different barcodes to determine subsequent interactions in the cytosol (Yang et al., 2015). A variant of the first mechanism is the idea that the receptor may have a “memory” of the conformational stabilization produced at the cell surface, which then lasts as the receptor continues interacting with effectors in the cytosol after the ligand has dissociated from the receptor. Some evidence for this has been reported for receptor-arrestin3 complexes where specific conformations of the receptor are maintained after dissociation of arrestin3 (Nuber et al., 2016). Recently, a striking variation on the theme of subcellular compartmentalization of signaling was reported for muscarinic M3 receptors and β2-adrenoceptors in the form of preassembled GPCR signaling complexes at the cell membrane that mediate responses to extremely low (as low as attomolar) concentrations of agonist (Civciristov et al., 2018).
More detailed insights into bias mechanisms have been gained by linking structure-activity relationship (SAR) experiments to receptor structural data (Shukla et al., 2014; Ranjan et al., 2017; Wacker et al., 2017; Zhou et al., 2017; Lee et al., 2018; McCorvy et al., 2018). Such structural studies have been targeted toward β2-adrenoceptors (Reiter et al., 2012), κ-opioid receptors (Zheng et al., 2017; Che et al., 2018), 5-HT1B and 5-HT2B receptors (Wacker et al., 2013; Wang et al., 2013), muscarinic M1 acetylcholine receptors (Kruse et al., 2013; Abdul-Ridha et al., 2014), and muscarinic M2 receptors (Dror et al., 2013). Receptor structures of ligand complexes with the β1-adrenoceptor have been particularly useful in the study of biased signaling. Specifically, crystal structures of the receptor complexed with the differentially biased ligands bucindolol, dobutamine, and carvedilol suggest that varying interactions of the ligands at extracellular loop 2 of the receptor through direct or water-mediated effects are critical to biased signaling at this receptor (Warne et al., 2012). Similarly, for the β2-adrenoceptor, NMR studies have shown that “balanced” agonists for β2-adrenoceptors shift the ensemble equilibrium toward the G protein–specific active state of helix 6 of the receptor, whereas β-arrestin–biased ligands regulate the conformational states in helix 7 (Liu et al., 2012). Similarly, bias SAR information regarding regions of receptors that are involved in biased signaling has also been obtained through site-directed mutagenesis as seen, for example, with G protein receptor 183 (Daugvilaite et al., 2017) and μ-opioid receptors (Hothersall et al., 2017).
VII. Detection and Quantification of Biased Signaling
A. Deviations from Monotonic Signaling
Biased signaling is detected by measuring deviations from a pattern and they are quantified by measuring the degree of that deviation. As discussed in section I, all systems are biased by physiology in terms of the needs of the organ system. Thus, receptor levels, relative stoichiometry of receptors to signaling proteins, and efficiency of stimulus-response coupling are unique in every organ system and dictate the sensitivity of those organ systems to endogenous agonism. Much of the challenge of translating in vitro effects to in vivo systems is due to this customization of organ sensitivity in the body.
The molecular mechanisms involved in the production of biased receptor signals were suggested from the early work describing deviations from predictions of monotonic (unbiased) receptor signaling. As first presented, agonist efficacy was a monotonic signal emanating from the receptor upon binding of the agonist to the receptor (Ariens, 1954; Stephenson, 1956; Furchgott, 1972; Mackay and Van Rossum, 1977). This signal was assumed to be homogeneous in nature, varying only in signal strength; the assumption for this was rooted in the lack of knowledge of the nature of cellular receptor signals and the fact that only a single readout of drug response was normally available in the assays used for characterizing agonism. For example, Stephenson (1956) characterized ligands with efficacy as those producing contraction of guinea pig ileum in functional in vitro experiments. This concept led to the derivation of one of the most useful tools in quantitative pharmacology for the classification of therapeutic agonists, namely the agonist potency ratio (PR). Through application of null experiments and the assumption that agonists produce a homogeneous signal of activation from the receptor termed “stimulus” (Stephenson, 1956), the idea emerged that equiactive concentrations of agonists could be used to derive a ratio of potency that would be receptor agonist specific and thus transcend the test system in which it was measured. This would be the case since the cellular system translating the receptor stimulus would serve only as an amplifier that does not change the nature of the signal. Under these circumstances, PRs of agonists could be derived in test systems and used to predict relative agonist potency in all systems including the therapeutic one; this is an enormously useful idea since agonists are usually developed in test systems, not the therapeutic one. The system independence of PR values can be illustrated through examination of agonist response through the Black/Leff operational model (Black and Leff, 1983) (eq. 2): (2)where τ is efficacy and KA is the equilibrium dissociation constant of the agonist-receptor complex. Equation 2 predicts that potency as quantified by the EC50 of the agonist (concentration producing the half-maximal effect), which is given by eq. 3:
 (3)For full agonists where τ > >1, the EC50 becomes KA/τ, an expression derived from the ratio of the affinity and efficacy of the agonist. It follows that the PR of two agonists (A1 and A2) measured in the same functional system is calculated as shown in eq. 4:
 (4)As defined by Black and Leff (1983), τ is a term formally identical to Stephenson’s efficacy term, in that it contains elements related strictly to the agonist and also the test system in which it measured. However, ratios of τ cancel the tissue-related elements and leave a ratio of strictly agonist-related efficacy. Therefore, ratios of τ/KA values for two agonists become tissue-independent measures of the relative power of the two agonists to induce response in any system.
Although PR values were and are important quantitative parameters for the measurement of agonist in pharmacology, their intrinsic value is predicated on the assumption that the nature of the signal produced by the two agonists at the level of the receptor is identical and that the processing of that signal is a monotonic function (one y for every x in a Cartesian system of stimulus to response) by the cell. It follows that deviations of PR values seen experimentally, presuming they are not due to experimental error, furnish evidence negating the monotonic assumption of signal processing. The key to determining such heterogeneity in signaling is the availability of multiple measures of agonist response (i.e., the delineation of the nature of agonist response into its elements at the level of the receptor-signaling protein interface). If independent observation of two signals from the same agonist-receptor interaction can be obtained, then a direct test of the monotonic nature of stimulus-response coupling can be made. This was predicted in theoretical terms for a system of receptor interaction with two G proteins (Kenakin and Morgan, 1989). In this study, the effect of the production of different active states of the receptor with two agonists on the resulting affinity of interaction of that receptor with two G proteins on the observed potency of the agonists was simulated. Assuming that different active states (i.e., different tertiary conformations of the receptor) will have correspondingly different affinities for the two G proteins in the system, it is predicted that differences in the relative potency of the agonists will be observed. Thus, variation in PR values would constitute evidence of the production of different receptor active states by the agonists (i.e., biased agonism would be predicted) (Kenakin and Morgan, 1989).
As agonists were tested in more and different functional systems, reports increasingly cited instances where the simple relationship between occupancy and response predicted by monotonic efficacy systems were not verified (for example, see Roth and Chuang, 1987; Mottola et al., 1991; Roerig et al., 1992; Fisher et al., 1993; Gurwitz et al., 1994; Lawler et al., 1994, 1999; Ward et al., 1995; Heldman et al., 1996; Mailman et al., 1998). Incontrovertible evidence of deviation from monotonic signaling was furnished for the PACAP receptor in a system whereby cAMP and IP signaling could be monitored from the same receptor as a function of activation by two agonists, PACAP1-27 and PACAP1-38 (Spengler et al., 1993). These experiments showed a reversal of relative potency of PACAP1-27 and PACAP1-38 for these two pathways, indicating undisputable variation in affinity and/or efficacy of the agonists as the receptor interacted with different signaling pathways. Specifically, as shown by eq. 4, reversed PR values can only occur through different values of KA and τ and this most likely is the result of different receptor conformations stabilized by PACAP1-27 and PACAP1-38. These and other data led to a formal declaration of the stabilization of different receptor active states by different agonists as the source of observed biased agonism (Kenakin, 1995).
As a preface to discussion of the various methods available to detect and quantify biased signaling, it is important to consider an important mechanism of apparent deviation from signaling pattern that is not due to bias. Specifically, where the strength of agonist signal is not adequate to produce response but rather converts the ligand from an agonist to partial agonist or antagonist; this is due to the interaction of the strength of the magnitude of efficacy and the sensitivity of the system.
B. Biased Agonism, Antagonism, and Strength of Signal
Historically, ligands that block responses to agonists and produce no further direct effect have been termed antagonists with the assumption that these molecules simply occupy the agonist binding site to prevent activation and thus block functional response. A well known phenomenon in pharmacology is the observed range of behaviors of low-efficacy ligands from showing agonism in sensitive functional systems to antagonism in systems of low sensitivity. For example, the low-efficacy β-adrenoceptor ligand prenalterol is nearly a full agonist in the thyroxine-treated guinea pig right atria to a complete antagonist in the guinea pig extensor digitorum longus muscle (Kenakin, 1985). This indicates that prenalterol produces a change in receptor conformation even though low-sensitivity systems cannot reveal positive efficacy. Low-efficacy ligands can be classified as partial agonists or antagonists depending on the sensitivity of the functional assay used to measure effects. This has been shown in studies with some classic antipsychotic drugs for dopamine D2/β receptors that are reported to be partial agonists in some functional assays (Allen et al., 2011) and silent antagonists in other cell systems (Masri et al., 2008). Similarly, the chemokine ligands (CCR2 and CCR5) J113863 [1,4-cis-1-(1-cycloocten-1-ylmethyl)-4-[[(2,7-dichloro-9H-xanthen-9-yl)carbonyl]amino]-1-ethylpiperidinium iodide] and UCB35625 [1,4-trans-1-(1-cycloocten-1-ylmethyl)-4-[[(2,7-dichloro-9H-xanthen-9-yl)carbonyl]amino]-1-ethylpiperidinium iodide] can function as antagonists, partial agonists, or full agonists depending on the receptor and signaling pathway being observed (Corbisier et al., 2017). When such changes in system sensitivity occur with different signaling from the same receptor, it can take on the profile of biased signaling.
With the ability to measure multiple signaling from receptors has come the realization that ligands can have multiple efficacies (i.e., “pluridimensional efficacy”; Galandrin and Bouvier, 2006). In addition, the stabilization of unique receptor conformations by antagonists opens possibilities that these conformations may confer signaling under some conditions. For example, the PTH receptor ligand [d-Trp12,Tyr34]-bPTH(7-34) is a neutral antagonist of calcium signaling and an inverse agonist for cAMP production but a positive partial agonist for ERK1/2 (Luttrell et al., 2018); the simple labels of “antagonist” and “agonist” fail to capture the pharmacology of ligands in a biased conformational world (Kenakin, 2008).
The sensitivity of the functional assay used to identify signaling can have profound effects on the determination of bias and/or efficacy. A great deal of research on signaling bias involves G protein versus β-arrestin signaling. However, it is very important to consider that well coupled sensitive assays such as second messenger assays are generally more sensitive than β-arrestin assays (which are not normally amplified), leading to apparent bias toward weak agonists producing second messenger responses without concomitant β-arrestin responses. This gives the illusion of “perfect bias” in that no response in one of the pathways is observed, further implying no interaction of the receptor with that signaling protein. However, experiments in which the “perfectly biased” ligand is used as an antagonist indicate that an interaction between the receptor and β-arrestin actually is taking place but no overt agonism can be displayed (Kenakin, 2015b; Stahl et al., 2015). A classic example of this is shown with the angiotensin biased ligand TRV120027, where the lack of Gq protein response is further shown to be a competitive antagonism of angiotensin Gq-mediated responses through Schild analysis (Violin et al., 2010). Similarly, the dopamine D2 biased ligand MLS1547 [5-chloro-7-[[4-(2-pyridinyl)-1-piperazinyl]methyl]-8-quinolinol] activates cAMP but does not promote receptor β-arrestin BRET signaling at any concentrations ranging from 1 pM to 100 μM, thereby giving the illusion of perfect bias. However, further experimentation reveals that MLS1547 is an antagonist of dopamine/β-arrestin effects, with an IC50 of 1 μM (Free et al., 2014). This dependence on assay sensitivity can be demonstrated within G proteins as well. For example, a lack of Gq protein activation and β-arrestin activation for the biased angiotensin agonist SII was reported in early studies (Wei et al., 2003), but subsequent work with more sensitive G protein assays in fact did demonstrate the G protein activation by SII (Saulière et al., 2012). Thus, the observation of “perfect bias” (i.e., where no signaling is observed in one signaling pathway) is not necessarily evidence of bias until the second pathway response can be observed and quantified in another assay.
A major way in which cells control their signaling is through variation of the relative stoichiometry of signaling elements, both receptors and signaling proteins. Experimentally, it can be shown that changes in cell surface receptor levels result in concomitant changes in sensitivity to agonists. For example, the β3-adrenoceptor ligand SR592230A [3-(2-ethylphenoxy)-1-[(1,S)-1,2,3,4-tetrahydronaph-1-ylamkino]-2S-2-propanol oxalate] is normally an antagonist but it produces agonism for cAMP formation in high-density β3-adrenoceptor cells (Sato et al., 2007). Moreover, for pleiotropically coupled receptors, receptor levels are linked to the actual quality of signal through recruitment of signaling pathways with increasing receptor levels. Thus, it has been shown that increased expression of α2-C10-adrenoceptor levels in transfected Chinese hamster ovary (CHO) cells show a pattern of initial coupling to Gi protein (the most sensitively linked pathway), followed by a recruitment of Gs signaling at higher receptor levels (Eason et al., 1992). Similar effects have been shown with the human calcitonin receptor, with initial Gs coupling evolving into mixed Gs and Gq coupling with increasing receptor expression (Kenakin, 1997). These types of effects can produce fine-tuning of response to low-efficacy agonists in vivo and can also lead to discontinuities in the translation of biased effects from simple in vitro assays to in vivo systems. These effects also can confound predictions of in vivo effects from in vitro profiles in pathologic systems, as changes in sensitivity in these latter tissues can occur due to altered stoichiometry between receptors and signaling elements. For example, downregulation of β-adrenoceptors and Gαi proteins (Eschenhagen et al., 1992), Gαs proteins (Longabaugh et al., 1988), and even adenylyl cyclases V/VI (Ishikawa et al., 1994) has been seen in congestive heart failure and these effects are known to change receptor signaling (Bristow et al., 1982). Altered G protein levels also have been noted in Parkinson disease (Corvol et al., 2004). In cancer, huge overexpression of receptors (notably of vasoactive intestinal peptide receptors) has been noted (for review, see Kenakin, 2001). The fact that very low-efficacy ligands can primarily function as antagonists raises the possibility that, like biased agonists, the same mechanisms may lead to biased antagonism. At this point, it is worth considering the evidence available to suggest that receptor conformational states can contribute to differential affinity for different ligands and signaling pathways.
C. Biased Antagonism
Since affinity and efficacy are both components of biased signaling, it is logical to consider that the same mechanisms may cause biased antagonism as well. There are a number of biased agonists that are of very low efficacy and thus function as antagonists of some signaling pathways. The mechanism of stabilization of unique receptor conformations can lead to differences in receptor affinity as well as efficacy, an effect shown in the observed affinity of weak partial agonists. Specifically, the EC50 of a partial agonist is a good approximation of the affinity (KA, equilibrium dissociation constant of the partial agonist-receptor complex) through the relationship EC50 = KA/(1 + τ) (Black et al., 1985), where τ is efficacy. When efficacy is low (τ → 0), the EC50 → KA (Bdioui et al., 2018). There are systems in which a weak partial agonist produces submaximal concentration-response curves for both pathways and where it is clear that a single estimate of affinity of the partial agonist for the receptor cannot be used to fit the curves (Kenakin, 2014). For example, extremely divergent EC50 values indicate variation in ligand affinity for different signaling pathways for adenosine A2B receptors where it is impossible to fit the curves for the partial agonist BAY 60-6583 (2-[(6-amino-3,5-dicynao-4-[4-(cyclopropulmethoxy)phenyl]-2-pyridinyl]thio]-acetamide) with a single value for receptor affinity (see Fig. 6). In fact, a 19-fold difference in the affinity of BAY 60-6583 is required to fit BAY 60-6583 curves in IP1 versus ERK assays (Baltos et al., 2017). A similar effect is seen with dopamine D2 receptors. Specifically, the partial agonist 16c is 700-fold biased toward GαoA over Gαi2 (compared with the agonist quinpirole) but this effect cannot be accounted for completely by selective efficacy. This is because the concentration-response curves to 16c cannot be fit to the operational model assuming the same affinity differing only in efficacy. The fact that there are divergent EC50 values for 16c for these two G protein pathways indicates a 158-fold difference in the affinity of an agonist for the dopamine D2 receptor when the receptor binds to GαoA versus Gαi2 protein (Möller et al., 2017).

Concentration-response curves for adenosine A2B receptor agonists NECA and BAY 60-6583 for IP1 metabolism and ERK1/2 activation. (A) BAY 60-6583 is a partial agonist for IP1 metabolism (filled circles) and for ERK1/2 activation (open circles) with significantly different EC50 values for each pathway. (B) DR curves for IP1 metabolism for NECA (filled circles) and BAY 60-6583 (open circles). Fitting the Black/Leff operational model yields values for affinity (KA) and relative efficacy (τBAY/τNECA) for these agonists activating this pathway. (C) DR curves for NECA (filled circles) and BAY 60-6583 (open circles) with values for relative affinity and efficacy as in (B) but for the ERK1/2 pathway. Fitting the Black/Leff operational model yields estimates of the affinity of BAY 60-6583 for the adenosine A2B receptor differing by a factor of 19 (KA-IP1 = 15 μM, KA-ERK= 0.8 μM). DR, dose response. Data are redrawn from Baltos et al. (2017).
Divergent pathway-selective affinity is consistent with the allosteric nature of receptor systems. Specifically, receptors alter their properties when a second body is bound to them and among those properties is the affinity for ligands through a cooperativity factor imposed on the receptor by the cobinding protein (denoted with the parameter α) (Ehlert, 2005; Kenakin, 2005; Price et al., 2005). Allosteric modulators can have varying effects on different molecules interacting with the receptor proteins to either increase or decrease the affinity of the receptor for ligands. As shown by Staus et al. (2016), the nanobody Nb80 enhances affinity 1000-fold, whereas the nanobody Nb60 reduces the affinity of noradrenaline for β2-adrenoceptors by a factor of 100.
The power of allosteric mechanisms to alter receptor antagonist activity is demonstrated in natural physiology. Thus, cellular coexpression of receptor activity-modifying proteins (RAMPs) produces a wealth of different phenotypes for the calcitonin/calcitonin gene-related peptide (CGRP) family of peptides that include calcitonin, α- and β-CGRP, amylin, adrenomedullin, and adrenomedullin 2/intermedin (Hay et al., 2018). For example, coexpression of calcitonin receptors and RAMP3 yields a receptor with a selectively high affinity for amylin. In cells containing RAMP3, the calcitonin receptor forms a complex that has completely different pharmacology compared with cells not containing RAMP3 and this leads to a selective change in antagonist potency of peptide antagonists such as AC66 (Armour et al., 1999). Without RAMP3, AC66 has a KB of 0.25 nM for blockade of responses to amylin and calcitonin; with coexpressed RAMP3, there is a selective 7-fold decrease in potency of AC66 for blockade of amylin responses (potency = 1.8 nM) and no concomitant change in potency for calcitonin responses. In this regard, the presence or absence of RAMPs in various cell types produces induced bias for ligands (i.e., amylin and human calcitonin) much like what is seen with synthetic positive allosteric modulators (PAMs) (vide infra).
Biased agonists stabilize different receptor active-state conformations and telegraph their selective conformations through distinct signaling patterns. Stabilization of unique receptor conformations by biased antagonists may not be as evident if an assay is not available to detect the conformational change. For example, the Gq protein assay denoting the competitive angiotensin antagonism by TRV120027 belies any production of a new receptor conformation until it is revealed through the β-arrestin assay (Violin et al., 2010). This type of dissimulation has been demonstrated for inverse agonists as well; for a selection of 380 apparently silent simple competitive antagonists for 73 receptors, 322 (85%) were found to actually be inverse agonists when tested in a constitutively active system (Kenakin, 2004). Thus, the stabilization of an inactive state receptor was not evident until the appropriate assay (constitutive receptor activity) was in place to detect it.
The profile of Gq protein blockade and β-arrestin agonism seen with TRV120027 highlights the essentially semantic issues with the nomenclature. From the point of view of β-arrestin effect, TRV120027 is a biased agonist; in terms of Gq protein signaling, it is an antagonist. It should be stressed that this is not because of differences in signal strength, as the bias is calculated with respect to a reference agonist and strength of signal is canceled. In the case of TRV120027, the antagonism is not selective (i.e., the EC50 for β-arrestin effect is equal to the pKB for Gq protein blockade). However, there are cases of ligand-directed selective antagonism whereby stabilization of unique receptor conformations results in differences of affinity. For example, the PACAP receptor antagonist PACAP1-6 has varying potency when blocking different PACAP agonists. Specifically, PACAP1-27 and PACAP1-38 produce elevation of cAMP but PACAP1-6 is significantly more potent in blocking the effects of PACAP1-27 than the effects of PACAP1-38 (Walker et al., 2014). A similar effect is seen with the β-blocking drug propranolol, which produces blockade of conventional agonists such as isoproterenol but less antagonism of the β-adrenoceptor agonist CGP-12177 (4-[3-[(1,1-dimethylethyl)amino]-2-hydroxypropoxy]-1,3-dihydro-2H-benzimidazol-2-one hydrochloride) (Konkar et al., 2000; Baker and Hill, 2007).
Similar arguments to those proposing therapeutic advantage for biased agonism can be put forward for biased antagonism as well. In terms of therapeutics, biased antagonism would differ from biased agonism, in that selective signaling would emerge through blockade of endogenous agonists and the quality of endogenous efficacy would change with the biased antagonist. In this case, the nature of the agonist would dictate the degree of blockade by the antagonist (true agonist-mediated biased antagonism), and this would allow for preferential blockade of some endogenous agonists and not others or selective blockade of some signaling pathways but not others. Historical data suggest that biased antagonism can be of therapeutic benefit. Thus, the β1-adrenoceptor–mediated β-arrestin signaling effects leading to cardioprotective transactivation of epidermal growth factor receptors have been proposed as the reason carvedilol and alprenolol provide a survival advantage over 18 other drugs in heart failure (Wisler et al., 2007). Specific cases can be made for biased antagonism as well for future work. For example, the natural agonist endothelin 1 activates endothelin A receptors to cause oncogenic (Gαq-coupled and/or β-arrestin signaling; Spinella et al., 2004; Rosanò et al., 2013; Teoh et al., 2014) and tumor-suppressive (Gαs-signaling; Takahashi et al., 2009; Follin-Arbelet et al., 2013; Teoh et al., 2014) effects. On balance, patients with ovarian cancer and high levels of endothelin A receptors were shown to have a low survival rate (Follin-Arbelet et al., 2013), yet endothelin receptor antagonists appeared to be ineffective as a cancer treatment (Cognetti et al., 2013). This has led researchers to postulate that nonspecific endothelin A receptor blockade appears to inhibit both the oncogenic and tumor-suppressive effects to negate a beneficial effect. This further suggests that a biased antagonist of the Gαq and/or β-arrestin effects of endothelin 1 would be beneficial (Bologna et al., 2017).
D. Assay Effects in Biased Signaling Measurement
Pharmacological assays are the “eyes to see” the physiologic effects of ligands and having optimal assays is crucial to the successful detection and quantification of signaling bias. Historically, the paucity of pharmacological assays made drug response a simple dependent variable, usually the physiologic effect from an isolated tissue. In some cases, texture for these responses could be obtained as in the measurement of cardiac inotropy (force of contraction) and lusitropy (myocardial relaxation) from a single cardiac preparation (Kenakin et al., 1991) but in general, a single output for response (and therefore efficacy) was used to quantify and classify drug effect. In this type of environment, signaling bias was moot since there were few choices for signal measurement. Beginning in the 1980s, increasing technology made evident through different functional assays showed that agonists have many efficacies. More than any single factor, the availability of multiple measures of agonist response from a single receptor led to the discovery of signaling bias. It is worth considering the characteristics of these assays and how these characteristics affect the measurement of signaling.
One well known factor contributing to heterogeneity in observed agonist effect is variation in levels of receptor expression (Zhu et al., 1994; Nasman et al., 2001). Thus, low sensitivity resulting from low receptor expression leads to an absence of measured response for weak agonists and differential sensitivity of different assays (i.e., second messenger assays vs. β-arrestin complementation; Rajagopal et al., 2010) contributes to system bias. The effects of assay sensitivity are illustrated with the determination of receptor G protein signaling. The most widely applied method to determine G protein activation has been stimulation of 5′-O-(3-[35S]thio)triphosphate ([35S]GTPγS) binding, a method that is relatively insensitive to weak stimulation and is restricted mainly to the Gαi/o family (cannot readily distinguish Gαi/o isoforms) (Denis et al., 2012). Vast improvements in G protein signaling detection have been made with new BRET-based biosensors, which can directly measure activation of all G proteins in living cells (Lohse et al., 2012). There are indirect methods available as well (e.g., for Gq protein activation, via IP1 metabolism or calcium release) (Trinquet et al., 2006, 2011). In fact, changes in assay sensitivity have led to the observation of more subtle variation in signaling for the angiotensin ligand SII. As noted earlier, the lack of G protein signaling effect for this molecule with GTPγS or IP3 radioactive assays led to its classification as a β-arrestin agonist and Gq protein antagonist (Wei et al., 2003). Application of a more sensitive IP1-homogeneous time-resolved fluorescence-based assay by the same group (Strachan et al., 2014) confirmed a different classification for SII (Saulière et al., 2012), namely one suggesting that SII does couple to some G proteins. BRET- and fluorescence resonance energy transfer–based biosensors have been used to monitor rearrangement of Gαβγ subunits (Galés et al., 2005; Nikolaev et al., 2006; Audet et al., 2008; Masuho et al., 2015), receptors and G protein (Galés et al., 2005; Audet et al., 2008), receptors and β-arrestin (Zimmerman et al., 2012), and G proteins and downstream effectors (Riven et al., 2006; Richard-Lalonde et al., 2013). Single platform optical formats utilizing BRET signals generated by dissociated βγ G protein subunits and GRK further increase the power of these assays to differentiate G protein receptor interactions (Masuho et al., 2015). In fact, the development of genetically encoded fluorescence-based biosensors has led to an explosion in terms of the observation of signaling events in living cells (Oldach and Zhang, 2014; Miyawaki and Niino, 2015; Galandrin et al., 2016b). This strategy has been extended to probe ligand-induced changes in β-arrestin conformation through intramolecular BRET-based biosensors (Charest et al., 2005). BRET-based biosensors have been used to study complex signaling for neurotensin type 1 receptors (Besserer-Offroy et al., 2017), angiotensin AT1 receptors (Saulière et al., 2012; Devost et al., 2017), κ-opioid receptors (Rives et al., 2012), a mutant somatostatin 5 receptor (Peverelli et al., 2013), and oxytocin receptors (Busnelli et al., 2012).
Assay sensitivity can affect observed system bias as seen in the highly amplified second messenger versus nonamplified β-arrestin signals, but more subtle effects can also change the magnitude of in vitro bias. As shown in Fig. 7, in some cases reversals in the relative potency of agonists are observed with varying assay format assessment of a single pathway, namely β-arrestin activity. Thus, a BRET method versus an enzyme complementation assay for dopamine D2 receptor/β-arrestin2 interactions (Path-Hunter) indicates differences in the bias of some agonists when comparing Gi protein versus β-arrestin interactions (relative to the reference quinpirole) due to the nature of the assay format (Möller et al., 2017). Finally, one experimental strategy that can be employed to expand detection capability is to manipulate assay sensitivity. For example, the usually low sensitivity of β-arrestin assays can be increased through coexpression of GRKs (phosphorylation of receptors increases their sensitivity to β-arrestin) (Urs et al., 2016).
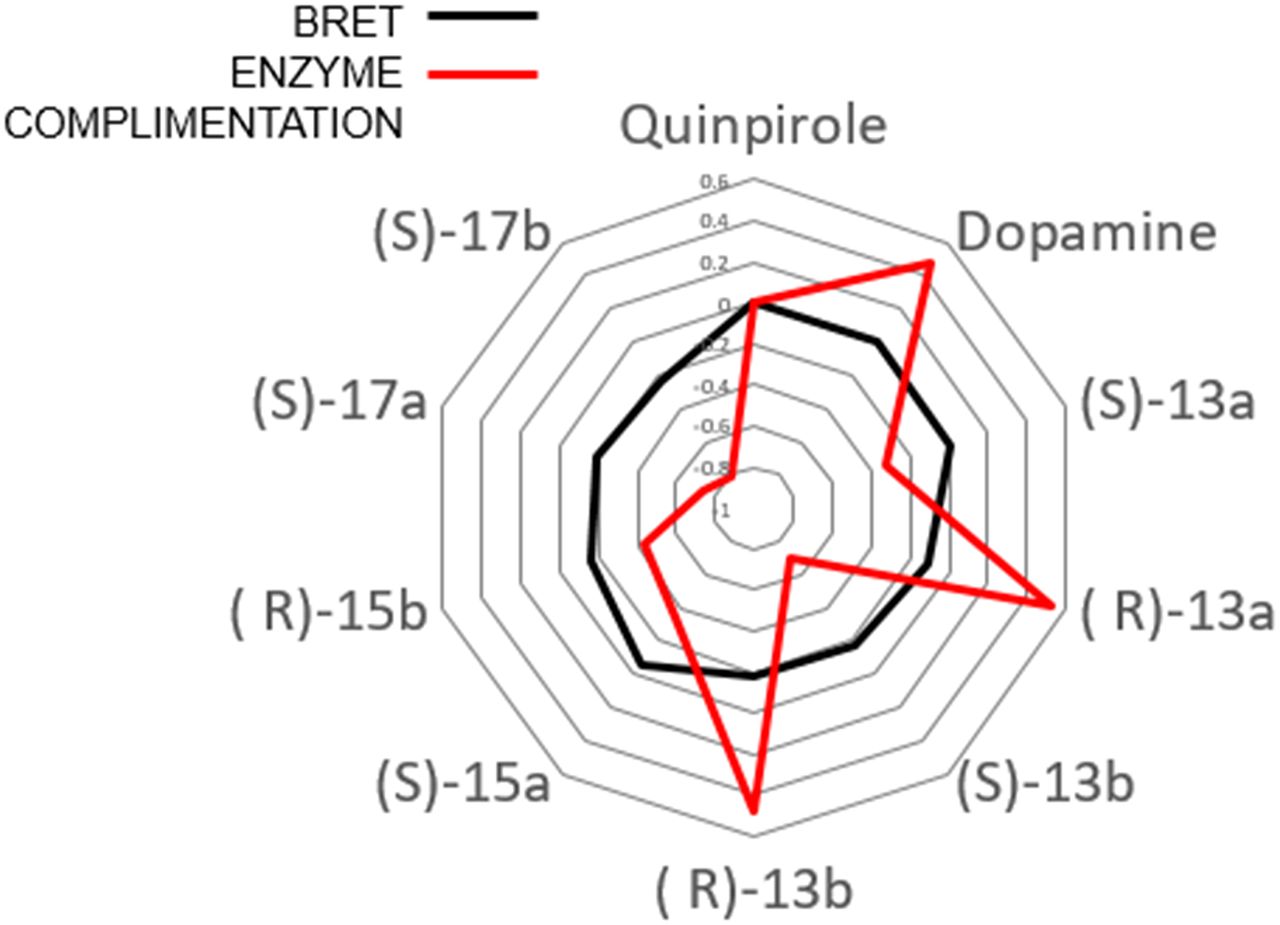
Bias activity for dopamine D2 receptor Gαi1 activation/β-arrestin interaction for 10 agonists measured either by BRET or enzyme complementation. Data are redrawn from Möller et al. (2017).
It is important to note that the assay used to quantify biased effects must accurately reflect the agonist activity; this is illustrated by the dissimulation of Gq protein-activating effects of the muscarinic PAM-agonist BQCA [1-(4-methoxybenzyl)-4-oxo-1,4-dihydroquinoline-3-carboxylic acid]. Specifically, agonism determined with calcium transient responses (a hemi-equilibrium assay) indicates an apparent 253-fold bias toward IP1 metabolism over calcium (compared with acetylcholine). However, the known inability of calcium assays to accurately reflect the response to slow-acting agonists (Unett et al., 2013), coupled with the fact that the agonism for BQCA cannot be reconciled with its allosteric receptor occupancy with the calcium assay (Bdioui et al., 2018), indicates that the agonism observed with the hemi-equilibrium calcium assay yields an erroneous location parameter for the agonist concentration-response curve and a concomitant erroneous estimate of bias. These effects illustrate the importance of the assay in bias measurements.
A valuable addition to the study of biased signaling has been made with label-free assays. In these experiments, the cellular responses to agonists are measured either as changes in dynamic mass redistribution (Fang and Ferrie, 2008; Kebig et al., 2009; Deng et al., 2013) or cellular impedance (Peters and Scott, 2009). These assays are highly sensitive and yield textured nuances in drug effect due to the fact that the complex signaling components of the cell (i.e., Gαs-, Gαi- and Gβγ-dependent signaling events, including activation canonical cAMP and ERK1/2 pathways) contribute to the final magnitude of response. In addition, virtually any cell type may be used, thereby allowing the testing of biased signaling in a variety of cell backgrounds and contexts (Ferrie et al., 2011; Stallaert et al., 2012; Deng et al., 2013; Morse et al., 2013).
E. Methods to Quantify Biased Signaling
If biased signaling is considered to be a valuable therapeutic property of drug candidate molecules, then a continuous scale of bias is required to allow medicinal chemists to optimize it. In general, a quantitative method for quantifying biased signaling should have the following properties:
Sensitive/system independent: The method must provide an index of activity that is scaled to a reference within the series of measurements made and becomes an independent inner scale that can then be compared across assays to gauge differential signaling (bias).
Quantifiable (have a scale): The method must provide a continuous numerical scale reflecting the degree of differential signaling (i.e., rank order is insufficient).
Theoretically sound (relevant pharmacological parameters): The method must be grounded in mass action receptor models to relate the biased measurements to a molecular interaction between the ligand and the receptor.
High throughput (or at least suitable for multiple molecules): For active SAR medicinal chemistry programs aimed at optimizing biased effects, the method should be amenable to rapid comparison of multiple molecules (null methods comparing two agonists in a single functional experiment are rigorous but not amenable to multiple-molecule SARs).
Statistically verifiable/bounded: The method should ideally furnish statistical estimates of variability leading to assessment of significant difference (i.e., 95% confidence limits).
There are a number of methods proposed for the quantification of bias in the literature; an excellent discussion of these is given by Onaran et al. (2017).
1. Transducer Coefficients: Log(Ratio of Agonist Efficacy/Functional Affinity) Values
A method based on the Black/Leff operational model of agonism (Black and Leff, 1983) characterizes agonism as a single number, specifically the ratio of the agonist efficacy (τ) and functional affinity (KA) (Kenakin et al., 2012). In this process, agonist concentration-response curves are fit to the Black/Leff operational model to furnish these estimates in the form of Log(τ/KA) values for responses in a signaling pathway and then scaled to a common reference agonist (usually the natural endogenous agonist) to yield relative values in the form of ΔLog(τ/KA) values. In the case of multiple endogenous agonists, a choice must be made to one reference agonist and all calculations referenced to that agonist. It should be noted that the actual choice of agonist does not make a difference in the relative bias of a series of agonists, only to the absolute magnitude of the values. This scales the relative power of the agonists to activate a given signaling system relative to the reference agonist. This is then done for another signaling pathway (the same reference agonist must be used) and then these relative values for each pathway are further compared with yield ΔΔLog(τ/KA) values between pathways. The fact that this method reduces agonism to a single value allows for statistical analysis of significance. Statistical formulae allow calculation of 95% confidence limits on all estimates of bias without regard to number of replications (Kenakin et al., 2012; see Table 3). In general, transducer coefficients, specifically Log(τ/KA) values, provide a quantifiable and scalable method to characterize ligand bias due to selective efficacy and/or affinity that can be used to analyze multiple agonists.
Statistical formulae to assess significance of bias through Log(τ/KA)
2. Log(Maximal Response/Concentration of Agonist Producing 50% of the Agonist Maximal Response)
A method related to the transducer coefficient method that is simpler utilizes a ratio of the maximal response and EC50 (concentration of agonist producing 50% of the agonist maximal response); this method avoids some of the difficulties encountered with fitting the Black/Leff operational equation (Kenakin, 2017). Developed through allosteric equations depicting agonists as PAMs of receptor-signaling protein interaction (Kenakin, 2017), this yields a theoretically sound scale comparable to transducer coefficients for all agonists except those with very low efficacy (i.e., producing <30% maximal response) and/or having shallow concentration-response curves with Hill coefficients <0.5. This scale can be used for multiple agonists, is amenable to statistical estimation of variability and significance, and also considers both efficacy and affinity.
3. Relative Efficacy: Log(Agonist Efficacy) Values
A method that relates the relative efficacy of agonists for production of signaling pathway activation has been proposed, which assumes that biased interactions produce no change in the affinity of the receptor for the ligand but only changes in the efficacy of the agonist (Rajagopal et al., 2011; Onaran et al., 2014). If this assumption is accepted, then this method is theoretically sound but any changes in the affinity of the receptor due to differential signal protein interaction will not be considered and the bias estimated on the basis of only efficacy may differ from estimates with transduction coefficients and/or Log(max/EC50) values. There are systems where affinity is not altered and only efficacy accounts for biased signaling. For example, TRV120027 shows an EC50 for β-arrestin activation of 12 μM (for partial agonism, this is an acceptable estimate of affinity) and the affinity for blockade of Gq protein effects through Schild analysis is 15 μM (Violin et al., 2010). Therefore, in this case, there is no difference in affinity associated with the two signaling pathways and the bias is due totally to differences in efficacy. However, affinity differences for agonists with a signaling pathway have been noted in other studies (Kenakin, 2014), leading to clear examples of systems in which a single estimate of affinity is not able to fit concentration-response curves to a biased ligand for two signaling pathways. For example, data for the adenosine A2B receptor partial agonist BAY-6583 shown in Fig. 6 illustrate how pathway differences in affinity cannot be ignored (Baltos et al., 2017). In general, the lack of consideration of possible differences in functional affinity can be a major problem with this method. On the other hand, there are examples in which affinity does not change with the signaling pathway and bias mechanisms based on efficacy (as opposed to affinity) are more robust and predicted to better translate in vivo (vide infra).
4. Relative Activity Ratios
A method described by Ehlert (2008) compares responses to two agonists in the same functional assay to determine a “relative activity” (RA) value gauging the relative power of those agonists to induce the response being measured. This method is theoretically sound and does not require prior knowledge of the affinities or efficacies of the agonists involved in the analysis. This is because the approach obtains RA values through null comparison of the agonist concentration-response curves. Formally, for concentration-response curves of unit Hill coefficients, the ratio of RA values can also be a ratio of (max/EC50) values, although RA should not be equated with max/EC50 because it is derived from a null comparison of two curves and not a single estimate of curve parameters. This is a powerfully rigorous and complete method that is excellent for detailed analysis of agonists of interest but lacks the high-throughput characteristics needed for simultaneous analyses of multiple candidate ligands.
5. Double-Reciprocal Null Comparison of Agonism
Barlow et al. (1967) published a method to compare agonism of full and partial agonists, which (like the RA method) does not require prior knowledge of the affinity and/or efficacy of the agonists. Rather, reciprocals of equiactive concentrations of the agonists are used to construct a double-reciprocal plot, the slope of which is an estimate of the logarithm of the efficacy/affinity ratio [i.e., Log(τ/KA)] according to eq. 5: (5)where agonists A1 and A2 have respective efficacies of τA1 and τA2 and respective affinities KA-1 and KA-2. An example of this procedure is shown in Fig. 8, where the relative power of the chemokines CCL3-like 1 and CCL5 are compared in an assay measuring CCR5 receptor internalization (data redrawn from Kenakin et al., 2012). Although this method is theoretically sound, there are some practical issues with applying it—namely that the concentration-response curves must diverge (see Fig. 8A) to allow convergence of the plot. There are also serious statistical limitations with the use of double-reciprocal plots, which can skew errors and emphasize certain regions of the data set over others (see Fig. 8B). In addition, like RA, this is a null method requiring the comparison of two agonists in the same assays, thereby limiting analyses of large data sets for SARs.

Determination of the relative Log(τ/KA) values for CCL3-like 1 (CCL3L1) and CCL5 mediation of internalization of the CCR5 receptor. (A and B) Reciprocals of equiactive concentrations of agonist (a–d) (A) are used to construct a linear regression (B) according to eq. 4. Data are redrawn from Kenakin et al. (2012).
6. Reference Intrinsic Activity Trajectory and Rank Order Method
A model-free method of assessing possible signaling bias with two variations was presented by Onaran et al. (2017). This method is based on the fact that system bias tightly links the maximal responses of agonists of different efficacy into a regular pattern, usually a hyperbolic relationship. It should be noted that there are no assumptions about a model determining these effects; rather, the method is based on what is found in experimental pharmacology. A plot of the maximal responses to a range of agonists obtained in one pathway as a function of the maximal response found in another will be a singular continuous function if the activation of the two pathways by the agonists has the same mechanism; in essence, a trajectory of intrinsic activities (relative maximal responses) will be defined by a ratio of the maximal responses to the agonists (see Fig. 9). This defines the system bias for the two pathways and will be referred to as a “reference I.A. trajectory.” In addition, another method of depicting such a relationship is to plot the rank order of the magnitude of the maximal effects for both pathways. If the rank order in each pathway is the same (this will yield a straight-line correlation of unit slope), this would reflect system bias but suggest no ligand bias (see inset in Fig. 9). If a given agonist departs from this trajectory (i.e., the ratio of maximal responses deviates from the pattern), this would suggest ligand bias for that agonist. A classic example and one that furnished among the first pieces of evidence to support ligand bias was published by Berg et al. (1998) for 5-HT2A receptor agonists. Specifically, these studies revealed agonists that actually reverse their efficacy for different signaling pathways (IP1 metabolism vs. arachidonate release) upon receptor activation. This is clear evidence of a reversal of efficacy for these pathways by these agonists that is shown in departures from the reference I.A. trajectory for these two signaling pathways (Fig. 10) and also rank order of intrinsic activities (inset in Fig. 10). The I.A. trajectory and rank order methods are essentially identical to the Log(τ) method; as such, they are solely based on differences in efficacy and ignore any effects on affinity. One of the main disadvantages of the I.A. trajectory (and rank order) method(s) is that a series of agonists with a wide range of intrinsic efficacies is needed to define the trajectory; if this is not available in a synthetic program, then the control (system) bias cannot be determined.
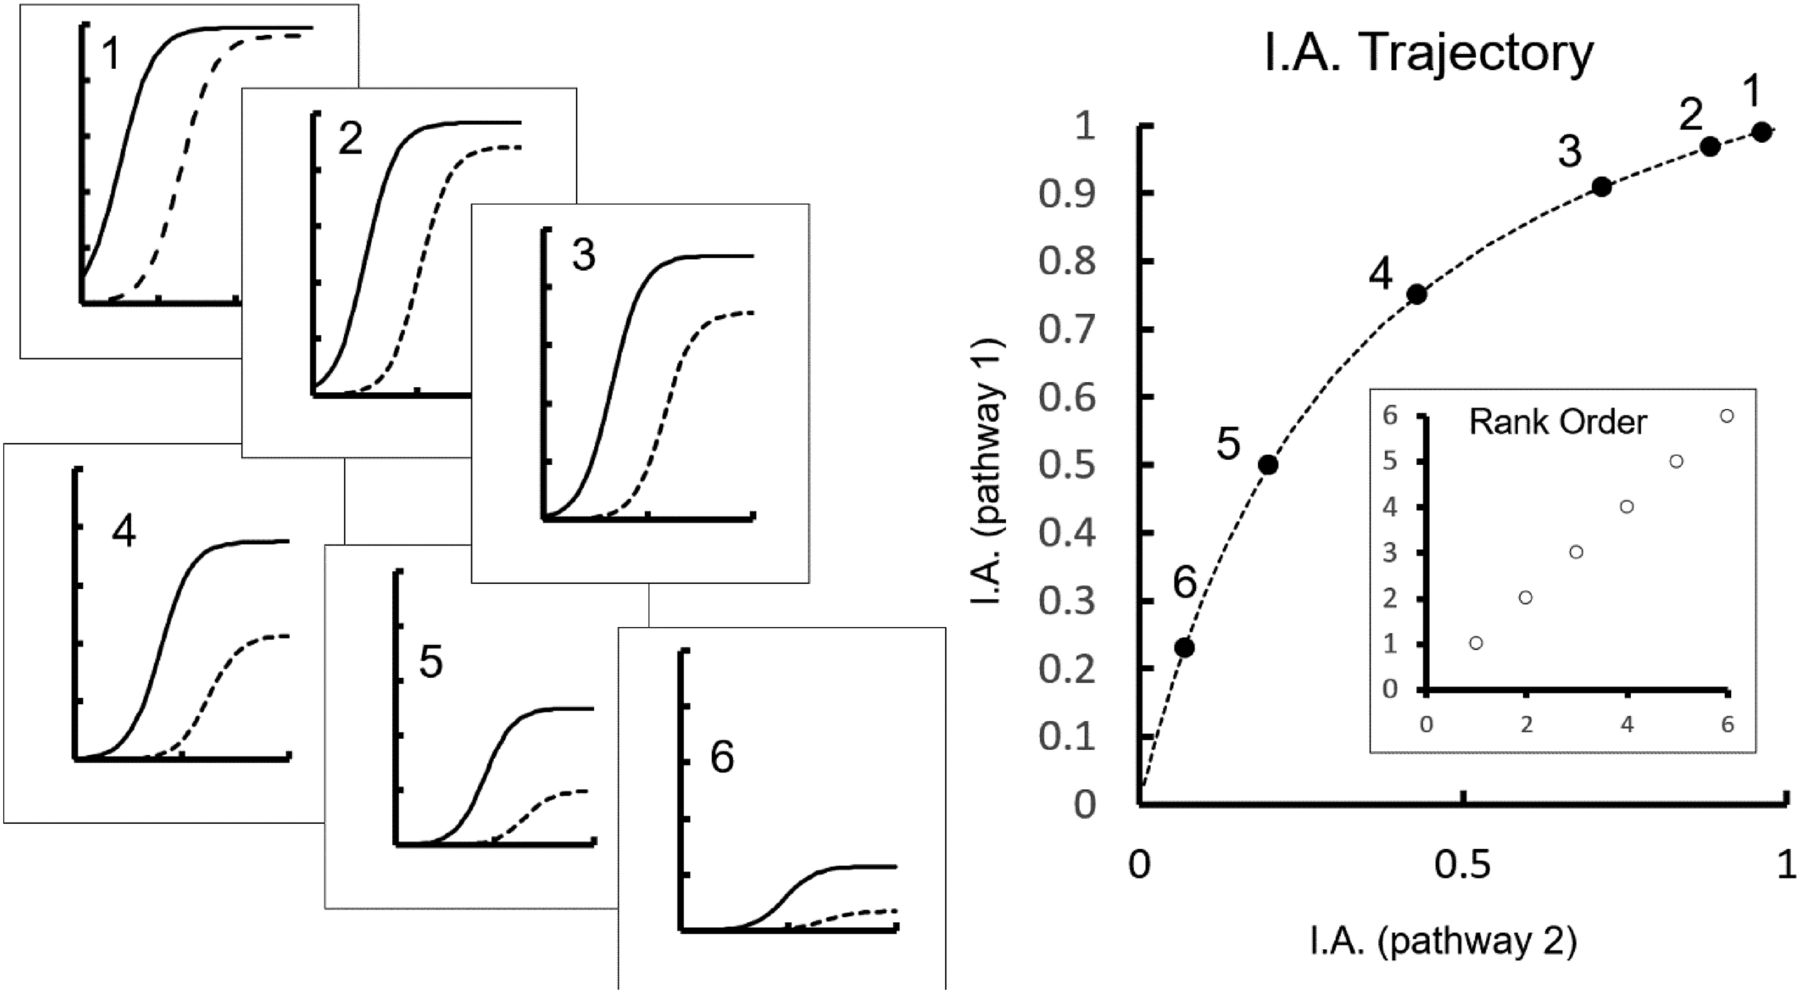
Concentration-response curves for agonists with a constant ratio of efficacies for two signaling pathways (denoted by solid and dotted curves in 1–6). The panels are shown for agonists of descending efficacies from highest (1) to lowest (6). The ratios of the intrinsic activities (maximal responses) for each pathway are plotted to produce a trajectory depicting the system bias for the two assays with no ligand-based bias operative. Ratios of intrinsic efficacies that lie on this trajectory would simply indicate system bias and not ligand bias. The inset ranks the intrinsic activities of the agonists from highest to lowest for each pathway. A linear regression with no deviations indicates no ligand bias.

Relative intrinsic activities for 5-HT2A receptor agonists for two responses linked to the 5-HT2A receptor: arachidonate release and IP1 accumulation. Whereas LSD, DOI, bufotenin, and 5-HT2A lie on a single I.A. trajectory (system bias), TFMPP and quipazine clearly deviate, indicating biased signaling. This is due to a difference in efficacy for these pathways as the intrinsic activities actually reverse. This bias is also reflected in the rank order inset plot. AA, arachidonic acid; DOI, (6)-1-(2,5-dimethoxy-4iodophenyl)-2-aminopropane; LSD, lysergic acid diethylamide; TFMPP, 3-trifluoromethylphenyl-piperazine. Data redrawn from Berg et al. (1998).
In general, it can be seen that there are numerous methods proposed to detect and, in some cases, quantify signaling bias. These methods, along with their advantages and disadvantages, are summarized in Table 4. Analysis of bias estimates with these different methods unveils systematic and nonsystematic deviation of actual bias values (Onaran et al., 2017), which is a problem for exact application of the bias scale numbers. However, it will be seen that these in vitro assays essentially identify bias and rank compounds in terms of magnitude of bias, with less emphasis on the expectation that these actual numbers will accurately translate to in vivo therapy. This is due to the fact that there are a number of factors that can change these in vitro bias numbers as the ligands activate receptors in vivo (vide infra). This being the case, the in vitro assays should be considered only in terms of how serviceable they are to yield scales for the sorting of compounds (and optimize SARs) for further testing and not sources of immutable numbers. Thus, features such as high-throughput capability, continuity of the scale, and amenability to statistical analysis become the most important features of an in vitro method to quantify signaling bias.
Methods to quantify biased signaling
F. Temporal Effects on Measured Biased Signaling
The real-time kinetics of the development and maintenance of cellular signaling can affect the estimation of biased signaling of ligands when snapshots in time are taken to make the measurements. As shown in Fig. 11, the relative potency of three agonists that have different real-time kinetics of response production varies with the actual time that the response is measured (“snapshot” format of response measurement). An obvious dichotomy exists between the kinetics of G protein activation (rapid and transient) and β-arrestin signaling (slow and sustained). Kinetic differences can occur due to differences in on and off rates of agonists with the receptor (differences in drug-target residence time; Strasser et al., 2017). For instance, while PTH(1-34) and parathyroid hormone–related peptide PTHrP(1-36) both elevate cAMP, PTH(1-34) has a rapid onset and slow offset compared with PTHrP(1-36), leading to a selectively prolonged activation for the latter. Similarly, the kinetics of cAMP production differs depending on whether the bulk of the signal comes from membrane or endosomal (intracellular) sources. Although PTH and PTHrP both elevate cAMP, only PTH produces sustained cAMP elevation due to production from early endosomes (Ferrandon et al., 2009; Feinstein et al., 2011). In general, agonist-dependent sensitivity of disruption of the G protein complex by GTP (resulting in divergent agonist-dependent receptor-residency times for the G protein heterotrimer complex and effectors) has been correlated with agonist bias (Furness et al., 2016).

Time course for production of response by three agonists (denoted by different solid and broken lines); measurement of response at three time points (T1, T2, T3) yields three concentration-response curves for the agonists with varying relative potencies.
Since biased signaling is basically a comparison of relative potency for different signaling pathways, temporal differences can translate to differences in bias estimates (Klein Herenbrink et al., 2016). In many cases, this results in modification of actual indices of bias but usually not in general gross direction of bias. However, there are cases in which temporal effects can be critical to the determination of signaling bias. For instance, norepinephrine and oxymetazoline both induce α1A-adrenoceptor phosphorylation and internalization. Whereas the effects of oxymetazoline are rapid, the effect of norepinephrine requires long time periods; therefore, when measurements of internalization are made at 30 minutes, oxymetazoline produces full agonism, whereas norepinephrine is inactive (apparently perfect bias) (Akinaga et al., 2013).
G. Representations of Biased Signaling Profiles
Depending on the number of pathways, ligands, and systems involved in biased signaling measurement, there are various methods employed to display the results. The main aim of these representations is to view a totality of data to draw general conclusions regarding the structure of ligands and physiologic selectivity. As a general rule, the farther the vantage point for measurement from the ligand-receptor interaction, the more complex (and textured) the pattern of biased signaling will be. There are a number of systems that have been employed to depict these patterns. As discussed earlier, the most straightforward method is to construct a bias plot where the responses to an agonist for one pathway are plotted as a function of the responses to the same agonist concentration in another pathway (see Fig. 1). While bias plots make evident signaling bias in agonists, they do not furnish a quantitative scale to judge the degree to which ligand bias exceeds system bias.
If a quantitative scale of bias is employed then a simple correlation of ΔΔLog(τ/KA) values can be useful. Figure 12 shows ΔΔLog(τ/KA) values for a series of bitopic adenosine A1 receptor agonists (referenced to NECA [1-(6-amino-9H-purin-9-yl)-1-deoxy-N-ethyl-β-d-ribofuranuronamide]) for calcium and cAMP responses; it can be seen that while eight compounds correlate fairly well [uniform ΔΔLog(τ/KA) values], the eight compounds in red are biased toward cAMP over calcium (Aurelio et al., 2018). Other methods are used if more than one signaling pathway is involved. A common method of representing multiple activities (i.e., efficacies) in molecules is with radar plots; for example, the efficacy of β-adrenoceptor ligands is displayed on multiple intersecting axes to yield a “web of efficacy” (Evans et al., 2010). Radar plots can be used to depict actual differences in agonist potency [i.e., Log(τ/KA) or Log(max/EC50) values; see Figs. 17, A and C, 18, and 19], or relative agonist activity compared with a reference agonist [ΔLog(τ/KA) or ΔLog(max/EC50) values; e.g., see Figs. 13, 15, 16, 17, B and D, and 20–22]. Finally, actual differences in bias can be depicted with radar plots of ΔΔLog(τ/KA) or ΔΔLog(max/EC50) (i.e., “webs of bias”; Baltos et al., 2016a,b). In general, radar plots are used as representations of departures from system and measurement bias.

Measurements of bias [as ΔΔLog(τ/KA) values] for biotopic adenosine A1 receptor agonists (referenced to NECA) for calcium (abscissae) and cAMP (ordinates) responses. Agonists denoted with black solid circles show uniform activation of both pathways (no bias), whereas circles in red indicate bias toward cAMP signaling over calcium. Data redrawn from Aurelio et al. (2018).

Relative agonist activity of three ghrelin agonists for the ghrelin receptor mediating various signaling pathways in HEK293T cells. (A) Radar plot based on agonist type for G protein and β-arrestin signaling [ΔLog(τ/KA) values] shown relative to ghrelin as the reference agonist. (B) More textured depiction of G protein selectivity. Radar plot based on G protein type showing ΔLog(τ/KA) values (with ghrelin as the reference agonist); the filled pentagon shows activity equal to ghrelin. Data are shown for agonists MK0677 and JMV1843. Redrawn from M’Kadmi et al. (2015). JMV1843, 2-methylalanyl-N-[(1R)-1-(formylamino)-2-(1H-indol-3-yl)ethyl]-D-tryptophanamide; MK0677, 2-amino-2-methyl-N-[(2R)-1-(1-methylsulfonylspiro[2H-indole-3,4′-piperidine]-1′-yl)-1-oxo-3-phenylmethoxypropan-2-yl]propanamide.
Although a great deal of literature is available to report receptor biased signaling between the G protein and β-arrestin pathways, the largest source of functional selectivity, in light of the G protein diversity available in the genome, may well be selective activation of G protein subunits (Hermans, 2003). Despite the technical challenge of measuring low-level G protein activation through GTPγS measurements, G protein selectivity has been determined with this method for some receptors. For example, dopamine receptor selectivity between Gαi1, Gαi2, Gαi3, Gαo, plus Gβ1 and Gγ2 has been reported using GTPγS assays (Gazi et al., 2003). Similarly, selectivity within Gαi1, Gαi2, Gαi3, Gαo, Gαz, Gαq/11, and Gα12/13 has been reported with cannabinoid receptor agonism (Diez-Alarcia et al., 2016). Recently, the application of sensitive BRET probes to directly measure G protein activation in living cells has been applied to the measurement of G protein subunit selectivity (Lohse et al., 2012; Saulière et al., 2012). These new methods allow delineation of particularly difficult to distinguish G protein subunit isoforms within the Gi/o family (Saulière et al., 2012; Bellot et al., 2015). BRET technology has been applied to the study of multiple Gα subunit interactions (Soto et al., 2015) with receptors. Specifically, multiple G protein subunit interactions with oxytocin receptors (Busnelli et al., 2012), κ-opioid receptors (Rives et al., 2012), and ghrelin receptors (M’Kadmi et al., 2015) have been described. This latter study shows how a simple profile for ghrelin receptor agonists indicating G protein bias (over β-arrestin 2) can be further expanded to show a diverse texture of bias among G protein subunits (see Fig. 13). Recently, an all-inclusive single platform optical method to directly monitor G protein activation in live cells, to yield signal magnitude, activation rates, and varying efficacy and kinetics of ligand activator in real time to provide efficacy fingerprints, has been reported (Masuho et al., 2015).
More complex texture in signaling data can be presented as heat maps in which multiple responses are compared (i.e., Soethoudt et al., 2017). Added value to such heatmaps can be gained if the resulting arrays are statistically clustered; this can yield useful similarity data for SARs (Huang et al., 2009; Stallaert et al., 2012; Kenakin, 2015c). An example of this technique is shown in Fig. 14, where Log(max/EC50) values for 15 opioid agonists in six signaling assays are clustered for similarity to produce nine groups linked by their unique signaling pattern in these assays (Kenakin, 2015c). The clusters obtained from signaling profiles often link structurally diverse molecules (i.e., see dynorphin A and morphine in Fig. 14).

Cluster analysis of 15 μ-opioid agonists in six different functional assays (data from Thompson et al., 2015). The gene cluster program GENE-E groups the agonists according to their Log(max/EC50) values in each assay. Shown is a grouping of two agonists (morphine and dynorphin A) of very different chemical structure. Analysis and data are redrawn from Kenakin (2015c).
The idea that receptor signaling becomes more complex and textured as measurements are made further from the ligand-receptor interaction leads to the demonstration that ligands produce differences in these patterns not evident at the cell membrane. One window into such patterns is receptor-mediated global changes in protein phosphorylation. For example, it has been shown that a 5-minute exposure of osteoblastic cells in vitro to PTH(1-34) leads to changes in the phosphorylation of 224 distinct proteins in the cell (Williams et al., 2016). One of the most complex “fingerprints” of biased signaling involving both ligand bias and cell background is obtained through transcriptome analysis, namely the comparison of differential mRNA expression from tissue cDNA (Maudsley et al., 2011, 2013; Chen et al., 2013b). In vitro studies from mouse calvarial bone cells indicate that bPTH(7-34) regulates 192 genes (47 upregulated and 145 downregulated) to yield a unique fingerprint for PTH receptor activation (Gesty-Palmer et al., 2013). Similarly, in bone tissue from wild-type and congenic β-arrestin2−/− mice, dramatic differences in the fingerprints are seen with hPTH(1-34) and [d-Trp12,Tyr34]-bPTH(7-34) (Maudsley et al., 2015).
H. Biased Signaling in Screening and Lead Optimization
Since pharmacological assays can be used to detect, measure, and quantify ligand-directed biased signaling, it follows that medicinal chemistry can be used to optimize desirable biased profiles. In fact, the detection of chemical scaffolds that demonstrate biased signaling can be achieved at the screening step in the drug discovery process. Thus, once molecules have been screened in one signaling format, a broad selection of the “hits” can then be cross-screened in another signaling format to produce a range of activity; that is, it is nearly guaranteed that a lack of uniformity in activity in the two assays will be seen. At this stage, an informed decision can be made to progress molecules known to be different (i.e., known to stabilize different receptor active states) to a secondary assay rather than only the most potent hits from the initial screening assay. This should, in turn, ensure the optimal opportunity for the discovery of unique therapeutic phenotypes in secondary assays (Kenakin, 2011). Application of such parallel primary screening has been applied to the detection of apelin receptor hits for cardioprotection (McAnally et al., 2017). The utilization of whole cell response assays for such screening optimizes for detection of activity (most sensitive) and biased signaling diversity (differences in pathway activation) (Kenakin, 2012). In this regard, label-free assays can be used for effective screening of biased molecules (Peters and Scott, 2009; Hou et al., 2016). Newer technologies such as those employing sensor surface-immobilized receptors also have been described as systems for the detection of biased ligands (Kumari et al., 2015). In addition, virtual screening techniques have been applied to the detection of biased molecules (Li et al., 2015; Manglik et al., 2016).
The ability to quantify biased signaling to a scale also powers SARs and enables a rational alteration of the effect through medicinal chemistry. Modifications of ligand-receptor function lead to changes in allosteric interaction and these can lead to precipitous changes in activity with small changes in ligand structure; this has been noted in the SAR for negative allosteric modulators (NAMs) and PAMs. For example, very subtle changes in chemical structures are known to radically convert a PAM to a NAM in a 5-(phenylethynyl)pyrimidine scaffold (Sharma et al., 2008); this phenomenon has been given the term “activity switching.” Since biased signaling is no more than the imposition of selective PAM effects for different signaling proteins, this suggests that changes in bias could be equally sensitive to changes in ligand structure. Alteration of biased signaling has been aided in many cases by linking effects with the structure of the receptor. For instance, the 5-HT2A and β-adrenoceptor crystal structures have identified transmembrane domains specifically linked to biased ligand interaction (Warne et al., 2012; Wacker et al., 2013). Similarly, protein mutation has been employed to generate SAR data for biased signaling (G protein receptor 183, Daugvilaite et al., 2017; GLP-1, Wootten et al., 2016). Chemical scaffolds yielding biased molecules range from modification of natural endogenous agonists to natural products (Gupta et al., 2016). In general, there has been a steady increase in the number of studies on the structural features of molecules required for biased signaling (Tan et al., 2018; and see Table 5).
Structure-activity studies for alteration of biased signaling
I. Applications of Biased Scales in Pharmacology
Quantitative scales for biased signaling, such as ΔΔLog(τ/KA) and ΔΔLog(max/EC50), can be used for a variety of purposes in pharmacology to gauge ligand selectivity and their impact on physiologic changes in systems. Just as these scales quantify agonist intracellular selectivity (biased signaling), they also can be used to quantify extracellular (receptor) selectivity. The inherent advantage of this is the ability to compare full and partial agonism, something that is not possible with simple potency ratios (Kenakin, 2017). By comparing ΔLog(τ/KA) or ΔLog(max/EC50) values, the sensitivity of each test system for the receptor type can be accounted for (by comparison with a reference agonist) to reveal the selectivity of test agonists. Figure 15A shows ΔLog(max/EC50) values for eight agonists for three 5-HT receptor subtypes illustrating the application of this method (lorcaserin is 5-HT2C selective) (Zhang et al., 2017).

Agonist selectivities depicted with radar plots. (A) Receptor selectivity [as ΔLog(max/EC50) values] compared with 5-HT for agonists activating three 5-HT receptor subtypes. Data are redrawn from Zhang et al. (2017). (B) Selectivity of dopamine agonists [as ΔLog(max/EC50) values] from label-free activation of dopamine D2 receptor in two different cell lines. Data indicate a cell-type specificity for A-77636. DHX, dihydrexidine; SKF38393, (±)-1-phenyl-2,3,4,5-tetrahydro-(1H)-3-benzazepine-7,8-diol hydrobromide. Data are redrawn from Peters and Scott (2009).
Basically, any type of selectivity can be quantified with the same techniques used to quantify biased signaling. For example, cell type can confer selectivity on agonists (actually it can modify pathway-selective effects seen in in vitro assays; vide infra). This can readily be seen with label-free assays in which the agonist activity can be measured and compared as ΔLog(τ/KA) or ΔLog(max/EC50) values. Figure 15B shows ΔLog(max/EC50) values for five agonists on dopamine D2 receptors measured in two cell types with a label-free assay (Peters and Scott, 2009). It can be seen that A-77636 [(1)-(1R,3S)-3-adamantyl-1-(aminomethyl)-3,4-dihydro-5,6-dihydroxy-1H-2-benzopyran hydrochloride hydrate] is selectively 11-fold more potent in U-2 cells (over SK-N-MC cells), thereby identifying this agonist as cell type specific. This type of analysis could be applied to identifying selectivity for pathologic systems over normal physiologic systems (i.e., cancer vs. healthy host, normal cardiac vs. cells from heart failure models, etc.) to identify disease-selective therapeutic molecules (Kenakin, 2015b).
Finally, biased signaling scales can be used to characterize and quantify physiology in a system-dependent manner as in the characterization of the effect of mutation on receptor function. Figure 16 shows ΔLog(max/EC50) values for ghrelin activity on wild-type and mutated analogs of the ghrelin receptor (Mokrosiński et al., 2012). Ideally, ΔLog(τ/KA) or ΔLog(max/EC50) values should be calculated for two agonists to account for differences in receptor expression (Tschammer et al., 2011; Kenakin, 2017). While conventional analyses of biased signaling for new agonists compares the synthetic agonist profile to the endogenous agonist (to gain an insight into the new signaling that might be expected with the synthetic agonist), in mutational studies the question more often relates to what effect a receptor mutation will have on the endogenous signaling in a pathologic condition. Therefore, the analysis usually uses a synthetic agonist as the reference to control for differences in receptor expression and centers on the impact of the mutation on the endogenous agonist. Ideally, specific residues may be identified in such studies to guide medicinal chemists to regions of the receptor that can change ligand selectivity (e.g., see Daugvilaite et al., 2017).
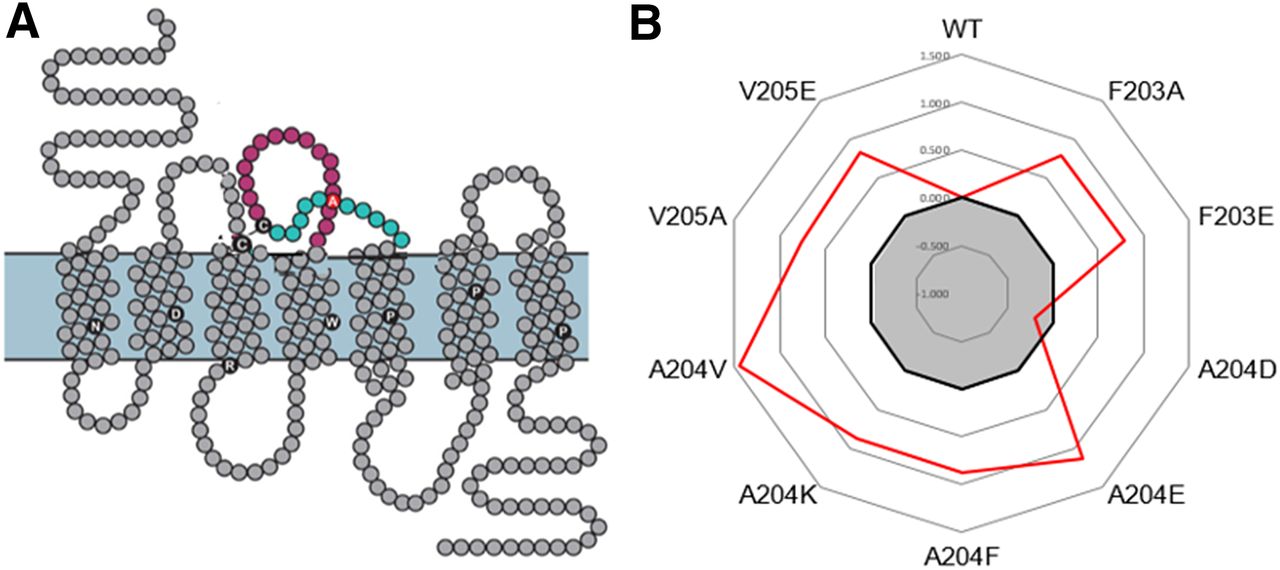
Effect of ghrelin receptor mutation on ΔLog(max/EC50) values for ghrelin. (A) Mutations made in the second extracellular loop of the receptor. (B) The shaded area represents normal wild-type receptor activity for ghrelin, and the red line indicates departure of activity made by mutation. No large differences in receptor expression were seen in these experiments. WT, wild type. Data are redrawn from Mokrosiński et al. (2012).
J. Allosterically Induced Bias
In view of the fact that allosteric modulators can completely change the receptor through stabilization of different global conformations, there is no a priori reason to believe that the allosterically modified receptor should retain its preallosteric modified signaling bias after binding the allosteric ligand. This being the case, the modulator can induce a new bias to the agonist-receptor system; this will be referred to as allosterically induced bias. With the activation of multiple signaling pathways by an agonist will come a change in the efficacy fingerprint of that agonist. Induced bias in normal physiology has been documented. For instance, the accessory protein RAMP2 binds to the vasoactive intestinal polypeptide-pituitary adenylyl cyclase-activating peptide 1 receptor to selectively enhance Gq/11 signaling (receptor-mediated phosphoinositide turnover) without altering Gs-coupled cAMP production (Christopoulos et al., 2003). Similarly, neurochondrin interaction with the melanin-concentrating hormone receptor 1 leads to inhibition of agonist-induced Gi/o and Gq/11 signaling with no concomitant internalization (Francke et al., 2006).
Induced bias is increasingly seen with synthetic drug-like allosteric modulators. For example, the agonist for the metabotropic glutamate receptor 5(S)-3,5-dihydroxyphenylglycine produces activation of calcium, IP1, and phosphor-ERK1/2 signaling in mouse cortical neurons (Sengmany et al., 2017). Values of Log(τ/KA) for activation of these pathways in the absence and presence of a high concentration of PAM agonists for this receptor indicate that the pattern of activation of these three pathways changes significantly after allosteric modification (see Fig. 17). Thus, the PAM-agonist VU0360172 [N-cyclobutyl-6-((3-flurophenyl)ethynyl) picolinamide] produces a 12-fold bias toward calcium, while the PAM-agonist DPFE [1-(4-(2,4-difluorophenyl) piperazin-1-yl)-2-((4-fluorobenzyl)oxy)ethanone] produces a 10-fold bias toward calcium. Induced bias has been observed for NAMs of NK2 receptors (Maillet et al., 2007), prostaglandin D2 receptors (Mathiesen et al., 2005), lysophosphatidic acid receptors (Shimizu and Nakayama, 2017), and calcium-sensing receptors (Davey et al., 2012; Cook et al., 2015). The effect has also been reported for PAMs for GLP-1 receptors (Koole et al., 2010), adenosine A1 receptors (Aurelio et al., 2009), muscarinic M1 receptors (Davoren et al., 2016), and metabotropic glutamic acid 5 receptors (Bradley et al., 2011). In addition, induced bias has also been seen with other types of allosteric modulators such as PAM antagonists (Kenakin and Strachan, 2018); for example, this has been documented for the cannabinoid CB1 molecule Org27569 (5-Chloro-3-ethyl-N-[2-[4-(1-piperidinyl)phenyl]ethyl-1H-indole-2-carboxamide), which blocks cAMP production but not ERK1/2 phosphorylation for some cannabinoid orthosteric agonists (Khajehali et al., 2015). In keeping with the cell-dependent modification of measured biased signaling, cell-dependent modulator-induced bias also has been reported for the follicle-stimulating hormone receptor, where differential effects on follicle-stimulating hormone receptor–stimulated steroidogenesis and ovulation in murine Leydig tumor cell line-1 and rat primary Leydig cells are observed (Ayoub et al., 2016).

Allosterically induced bias. (A) Log(τ/KA) values for the metabotropic glutamate receptor 5 agonist DHPG for the signaling pathways in mouse cortical neurons. (B) The solid line represents control values; dotted line values in presence of the PAM-agonist VU0360172. Data in (A) are presented as ratios of control Log(τ/KA) values [ΔLog(τ/KA) values] and values after allosteric modulation. The shaded triangle indicates the native receptor signaling before allosteric modification, and the solid line indicates the change in this signaling in the presence of VU0360172. Values extending beyond the shaded triangle indicate increased signaling in the presence of the allosteric modulator and inside the triangle a reduced signaling. (C) Log(τ/KA) control values are indicated as a solid line; values in the presence of the PAM-agonist DPFE are shown as a dotted line. (D) Data in (C) are presented as ratios of control Log(τ/KA) values [ΔLog(τ/KA) values]. The shaded triangle indicates the native receptor signaling before allosteric modification, and the solid line indicates the change in this signaling in the presence of DPFE. Values extending beyond the shaded triangle indicate increased signaling in the presence of the allosteric modulator and inside the triangle a reduced signaling. DHPG, 5-(S)-3,5-dihydroxyphenylglycine; VU0360172, N-cyclobutyl-6-((3-flurophenyl)ethynyl) picolinamide. Figure drawn from data recalculated from Sengmany et al. (2017).
VIII. Translation of In Vitro Bias to In Vivo Physiology
A. Translation from Pathways to Whole Cells
Although measurements of signaling bias can be made with simplified in vitro assay systems (e.g., biosensor interactions of receptors and effectors), ultimately the relevant outcome is the in vivo overall cellular effect of the biased agonist. There are a number of factors that contribute to the modification of simple dual pathway estimates of bias by the cell. Convergence of signaling pathways occurring in cells can change the overall outcome of signals initiated with different relative strengths of signal (Alvarez et al., 2002; Ostrom et al., 2012; Charfi et al., 2014). Initial events at the cell membrane may also have differential consequences for the whole cell. For example, while the cannabinoid CB2 agonists CP55,940 [(−)-cis-3-[2-hydroxy-4-(1,1-dimethylheptyl)phenyl]-trans-4-(3-hydroxypropyl)cyclohexanol] and WIN55,212-2 both promote β-arrestin2 recruitment at the cell membrane, only CP55,940 induces receptor internalization (Atwood et al., 2012). Similarly, seemingly identical cellular outcomes may result from different intracellular signaling pathway activation. For example, in microphysiometry studies (measurement of extracellular acidification, a whole cell response), it was observed that two β3-adrenoceptor agonists, CL316,243 and SR59,230A produce full agonism. However, when studied further, it was seen that whereas CL316,243 produces response through dual activation of cAMP and p38, SR59,230A produces the same end organ response through sole activation of p38 (Sato et al., 2007). Similarly, a range of PTH receptor agonists activate cAMP and ERK1/2 signaling and also produce anabolic bone response in vivo; paradoxically, the ligand (d-Trp12,Tyr34)-bPTH(7-34) has a dramatically different in vitro signaling profile (inverse agonism for cAMP and ERK1/2) but still produces positive anabolic bone responses (Appleton et al., 2013).
Possible further complication may result from different agonist-stabilized receptor active conformations interacting with different conformations of effector; for example, two angiotensin β-arrestin–biased agonists produce two different and distinct patterns of downstream signaling in cells by stabilization of different conformations of β-arrestin (Santos et al., 2015). As conformationally coded receptors interact with various components of the cell cytosol, the relative stoichiometry of those components becomes a factor in the overall impact of any given pathway. Data from intramolecular-bioluminescence resonance energy experiments indicate that different ligands binding to the same receptor can produce unique population average conformational signatures for arrestins (Lee et al., 2016; Nuber et al., 2016). These signatures become instrumental in the assembly of distinct signaling β-arrestin “signalsomes” (Peterson and Luttrell, 2017).
The stoichiometry of interacting components, namely receptors and signaling proteins, is known to vary between different cell types (Kenakin, 1997; Newman-Tancredi et al., 1997, 2000). Proteomic techniques using mass spectrometry show marked differences in the expression level of proteins in 11 different human cell lines (Geiger et al., 2012) and quantification of mRNA showed large differences in receptors and signaling proteins in cell lines often used in pharmacologic experiments, specifically human embryonic kidney 293 (HEK293), AtT20, BV2, and N18 cells (Atwood et al., 2011). Differences in receptor/G protein stoichiometry have been shown to directly influence estimates of signaling bias (for review, see Gurevich and Gurevich, 2018). Figure 18A shows the variation in bias measured for β-adrenoceptor agonists under conditions of varying Gα protein subunit expression (Onfroy et al., 2017). Similarly, the relative stoichiometry of Gαs protein and calcitonin receptors has been shown to reverse the relative order of potency for calcitonin agonists (see Fig. 18B) (Watson et al., 2000). Theoretical modeling confirms that variation in the relative quantity of different signaling proteins in cells can lead to variation in the whole cell estimate of biased signaling for biased agonists (Kenakin, 2016). In fact, experimentally demonstrated effects have been shown to translate to whole cell differences in experimental cell systems (Masuho et al., 2015). In addition, cell background context (HEK293 vs. rat vascular smooth muscle cells) has been seen to affect basal angiotensin AT1 receptor conformation as detected by receptor conformationally sensitive biosensors (Devost et al., 2017), consistent with the reciprocal allosteric effects of receptors and G proteins. These data show that signaling partners such as G proteins influence the agonist-induced conformational changes and modify them when they are present in the membrane (or deleted with CRISPR). For instance, the absence of Gq/11 confers sensitivity onto the biosensor at intracellular loop 2P2, which then becomes sensitive to angiotensin II and III. Additionally, the nature of the host cell can modify both the basal conformation of the receptor and the changes induced by agonists. This latter effect is demonstrated by the different conformations (as sensed through ΔBRET changes in the second and third intracellular loops of the receptor) produced by two agonists, namely angiotensin II and the biased agonist SI. The effects of these agonists are of different magnitude and, notably, vary in the direction of conformation change when measured in HEK cells versus vascular smooth muscle cells (Devost et al., 2017). These data indicate that the cell type can change the conformational ensemble of the receptor and the nature and magnitude of agonist-induced signaling bias. Similarly, the lipid environment of the receptor has long been postulated to affect receptor function; a recent report utilizing mass spectrometry on preferential binding of phosphatidylinositol-4,5-bisphosphate to adenosine A2A receptor– and β1-adrenoceptor–G protein complexes shows variation in receptor–G protein coupling efficiency, thereby illustrating the influence of lipids (and therefore cell type) on receptor function (Yen et al., 2018). Variation in the stoichiometry of intracellular signaling modulators also can have profound effects on responses to agonists in terms of G protein selectivity. For example, Fig. 19 shows measurements of the maximal muscarinic M3 receptor and selective G protein response produced by acetylcholine in control HEK293T/17 cells and in the presence of a cotransfected regulator of G protein signaling (RGS8) and presence of a cotransfected activator of G protein signaling (AGS1); it can be seen that the interaction of the receptor with individual G protein subtypes changes considerably (Masuho et al., 2015).

Variation in receptor/G protein stoichiometry can change bias estimates. (A) Log(max/EC50) values for three β-adrenoceptor agonists in HEK293 cells varying in levels of G protein expression, drawn from Onfroy et al. (2017). (B) Effect of coexpression of Gαs protein into HEK cells on calcitonin receptor agonist Log(max/EC50) values, drawn from Watson et al. (2000). EPI, epinephrine; ISO, isoproterenol; NE, norepinephrine.

Maximal effect of muscarinic M3 receptor activation with different Gα subunits in HEK293T/17 cells (control) and cells cotransfected with regulator of G protein signaling RGS8 protein (blue) and activator of G protein signaling AGS1 (red). Data redrawn from Masuho et al. (2015).
Yet another whole cell variable may involve the phosphorylation of receptors (Tobin, 2008; Tobin et al., 2008) referred to as receptor “barcoding” (Tobin et al., 2008; Zidar et al., 2009; Nobles et al., 2011). It has been established that different receptor ligands can induce different phosphorylation barcodes (Butcher et al., 2011; Just et al., 2013) to induce different signaling outcomes (Tobin et al., 2008). This may be the result of specific phosphorylation-dependent interactions of receptors with β-arrestins (DeWire et al., 2007) that change from an inactive to active form upon interaction with the phosphorylated receptor (Xiao et al., 2004; Nobles et al., 2007; Shukla et al., 2013). Whole cell modification of signaling bias can be affected, as phosphorylation has been shown to be tissue specific (Torrecilla et al., 2007).
Finally, other points of cellular control that can influence agonist whole cell response have been described. For example, the β2-adrenoceptor agonists clenbuterol, cimaterol, procaterol, and terbutaline were shown to be biased toward cAMP production (with weak activity on ERK phosphorylation) in HEK293 cells only in adherent cells with 100% confluence; reduction in cell-cell contact by either decreasing the cell density or bringing the cells into suspension abolished this bias (Kaya et al., 2012). Temporal encoding, in which each of these components brings with it a real-time kinetic element, can change the emphasis of various pathways in whole cell response in cell-dependent ways (Grundmann and Kostenis, 2017). In addition, cell-dependent expression of receptor splice variants (as in the case of CXCR3 receptors) also has been shown to produce cell-dependent differences in biased signaling (Berchiche and Sakmar, 2016).
In view of the various points of possible variation in biased signaling measurements to be found in different cell types, it is not surprising that bias measurements have been seen to vary with cell host. For example, variation in cAMP production and receptor internalization has been seen for opioid receptor ligands when measured in CHO versus AtT20 cells (Thompson et al., 2015, 2016). Similarly, the array of signaling pathways activated by relaxin has been shown to markedly differ in seven different cell types, an effect possibly related to varying levels of Gαi3 and Gαo (Halls et al., 2009). The fact that label-free assays use total cellular response as the output for agonism makes this format ideal to detect cell type variation (Peters and Scott, 2009). For example, seven muscarinic M3 receptor agonists have been shown to produce diverse signaling profiles in six different cell lines through label-free assay technology (Deng et al., 2013). In keeping with the idea that more complex outputs of agonist response increase the capability to detect diversity in signaling, mRNA microarrays also offer a useful technology to detect cell type variation in agonist signaling (Atwood et al., 2011).
Cell type differences also extend to comparisons of recombinant versus natural cell systems and even between different recombinant systems utilizing different host cells (Christmanson et al., 1994). In this case, the expression of human calcitonin receptors into COS and CHO cells yields strikingly different relative potency ratios, indicating a clear cellular control of biased signaling for these agonists. When comparing recombinant versus natural cell lines, it has been shown that opioid and cannabinoid receptors access the same pool of G proteins in recombinant cell systems but mediate signals through distinctly different pools in endogenous natural cell systems (Shapira et al., 2000). Similarly, while protein kinase C and GRK2 are important for δ-opioid receptor internalization in cortical neurons, they are less so in HEK293 cells (Charfi et al., 2014). Different pharmacology of PACAP agonists PACAP-27 and PACAP-38 has been reported between transfected PACln cells and natural trigeminal neurons and glia (Walker et al., 2014). In general, beyond variation in the relative stoichiometry of signaling components in recombinant systems, variation in the integration of the transgene in stable transfection systems can permanently alter the cell genotype/phenotype (Lin et al., 2014). However, it should not be assumed that all recombinant versus natural cell systems show divergence. For instance, the G protein bias of the κ-opioid receptor agonist 6′-guanidinonaltrindole originally detected in HEK cells (Rives et al., 2012) retains this profile in primary neuronal cultures where κ-opioid receptors are expressed endogenously (Schmid et al., 2013).
In view of the fact that bias measurements made in recombinant systems often differ from those seen in natural systems and also that cell type can change estimates of bias, it is useful to quantitatively compare different functional systems and measurements of bias. Figure 20 shows data for allosteric agonists of the metabotropic glutamate receptor 5 for functional responses (calcium, IP1, ERK) when the receptor is transfected into HEK cells versus that endogenously found in cultured cortical neurons (Sengmany et al., 2017). These data show a trend of greater agonist activity and increased bias [ΔΔLog(max/EC50) values] in HEK cells versus cortical neurons. This shows that these agonists appear to be more biased in the recombinant system over the natural system.

Bias measured in HEK cells and cultured cortical neurons. The left panel shows ΔLog(max/EC50) values for allosteric agonist activation of metabotropic glutamate receptor 5 (DHPG as the reference agonist) for VU0409551, DFPE, and CDPPB for calcium, IP1, and ERK responses in HEK293A cells. The right panel shows the same responses in cultured cortical neurons. These radar plots indicate that bias is more pronounced in HEK cells than natural cultured cortical neurons. CDPPB, 3-cyano-N-(1,3-diphenyl-1H-pyrazol-5-yl)benzamide; DFPE, 1-(4-(2,4-difluorophenyl)piperazin-1-yl)-2-((4fluorobenzyl)oxy)ethanone; DHPG, 5-(S)-3,5-dihydroxyphenylglycine; VU0409551, ((4-fluorophenyl) (2-(phenoxymethyl)-6,7dihydrooxazolo[5,4-c]pyridin-5(4H)-yl) methanone); VU29, N-(1,3-diphenyl-1H-pyrazolo-5-yl)-4-nitrobenzamide. Figure drawn from data recalculated from Sengmany et al. (2017).
It is interesting to see how the vantage point for observing response can change the magnitude of measured bias. Figure 21 shows how increases in cAMP mediated by dopamine D2 receptor agonism translate to label-free whole cell response with the resulting changes in quantitative biased signaling (Peters et al., 2007). A more extensive analysis of the changes occurring throughout the stimulus-response cascades controlling whole cell response are shown in Fig. 22 (Klein Herenbrink et al., 2016). Specifically, it can be seen that the part of the overall pathway chosen to make the bias measurements produces different estimates of the relative bias of the agonists.

Concentration-response curves from dopamine D2 receptor agonists showing relative potency at the point of receptor/G protein interaction (cAMP) and whole cell end-organ response (cellular impedance in label-free format). The center radar plot shows ΔLog(max/EC50) values from both vantage points, indicating differences in bias estimates. Data calculated from Peters et al. (2007).

Different relative agonist activity measurements [ΔLog(max/EC50) vs. dopamine] for seven dopamine D2 receptor agonists with estimates made at various points along the stimulus-response pathway in Flp-In-CHO cells. The left panel shows ΔLog(max/EC50) values for the agonists measured at six points along the stimulus-response cascade (beginning with receptor/G protein and β-arrestin interaction to whole cell impedance response). Of note are the different patterns of agonism, indicating that bias estimates at each of these points are different, as shown in the right panel. S-3PPP, [3-(3-hydroxyphenyl)-N-propylpiperidine]. Data calculated from Klein Herenbrink et al. (2016).
B. Translation to In Vivo Therapeutic Systems
1. Translational Gaps in the Conversion of In Vitro to In Vivo Bias
When a biased ligand is introduced to an in vivo system, it will interact with a vast array of tissues with varying sensitivities, relative stoichiometries of receptor to signaling proteins, variable coexpression of receptors and interconnections between codependent systems (especially in the brain), and varying endogenous physiologic chemical contexts. These variations have created a serious translational gap between in vitro and in vivo coordination of bias ligand properties (Appleton et al., 2013; Kenakin, 2018). Much of this unpredictability results from the complex nature of in vivo systems and the fact that biased ligands do not uniformly produce “edited” versions of natural receptors but rather will produce completely different receptors with the concomitant ability to increase, reduce, or not change a broad range of physiologic processes (Luttrell et al., 2018). For example, in bone remodeling studies in mice, the biased PTH receptor agonist [D-Trp12, Tyr34]-bPTH(7-34) produces a transcriptome with remarkably little similarity to the one produced by the natural agonist PTH, leading to the conclusion that in vivo bone mass effects of the biased agonist could not have been predicted by its in vitro bias profile (Appleton et al., 2013; Gesty-Palmer et al., 2013; Luttrell et al., 2018).
2. Affinity-Dominant versus Efficacy-Dominant Biased Signaling
In cases where in vivo agonism may be relevant to therapeutic effect, it is important to note that ligand efficacy and not bias is the important factor. While bias determines the relative concentrations at which two responses will appear (in relation to each other) when the responses actually do appear, whether any response occurs at all remains in the realm of the ligand efficacies for that pathway and the sensitivity of the tissue involved. As illustrated by eq. 3, agonist potency depends on both affinity and efficacy; thus, high potency can be achieved through high affinity or high efficacy. However, the dependence of agonism on tissue sensitivity differs depending on the dominating factor for agonist potency. If agonist potency depends largely on affinity (“affinity-dominant” agonists), then decreases in tissue sensitivity will have much more effect on whether agonism is produced than if the potency depends on efficacy (“efficacy-dominant” agonists) (Kenakin, 1984). In general, affinity-dominant agonists are much more prone to show no agonism in less sensitive tissues than efficacy-dominant agonists that produce agonism in all tissues. For example, decreases in α-adrenoceptor density through chemical alkylation depress the response to the more potent affinity-dominant agonist oxymetazoline to a much greater extent than the responses to the less potent but efficacy-dominant agonist norepinephrine (Kenakin, 1984). Since bias is simply a ratio of efficacy to affinity for two pathways, bias can also be affinity dominant or efficacy dominant. As seen in Fig. 23, two κ-opioid agonists, ICI204448 [(RS)[3-[1-[[3,4-dichlorophenyl)acetyl]methylamino]-2-(1-pyrrolidinyl)ethyl]phenoxy]acetic acid hydrochloride] and RB-59, have the same intrinsic activities for cAMP and β-arrestin responses but very different relative potencies (White et al., 2014). The fact that both agonists lie on the same intrinsic activity reference trajectory indicates that efficacy alone cannot account for the bias of these agonists (RB-59 is 147-fold biased toward G protein compared with ICI204448 using the reference agonist salvanorin); rather, differences in affinity play a key role in determining the bias. Parenthetically, this illustrates a major shortcoming of utilizing methods that only involve efficacy for the quantification of bias, such as Log(τ), I.A. reference trajectory, and rank order (see section VII.E). As with agonism, efficacy-dominant bias will be more robust in terms of activating biased signaling pathways in a wider range of tissues in vivo than will affinity-dominant bias. This is demonstrated in Fig. 24, which shows the response to two identically biased agonists in a range of tissues with varying levels of receptors. It can be seen from this figure that there is a greater range of tissues (as seen by a greater range of receptor densities) that will demonstrate biased agonism (as opposed to antagonism) in vivo (in the presence of an EC50 of endogenous agonist response) for the efficacy-dominant biased agonist than for the affinity-dominant biased agonist. These simulations underscore the importance of efficacy, as opposed to only bias, in the prediction of agonist response in vivo.

Regression of the relative intrinsic activities of κ-opioid receptor agonists for G protein/β-arrestin responses on the bias of these agonists for each pathway. It can be seen that there are agonists with identical bias values but differing relative efficacies (reflected as intrinsic activity values) for each pathway and vice versa (identical maximal intrinsic activities but varying bias). This latter effect is demonstrated by RB-59 and ICI204448, which have very different bias values but essentially identical efficacies for each pathway (would lie on the same I.A. trajectory). This illustrates the importance of variable affinity with signaling pathways. Data redrawn from White et al (2014).
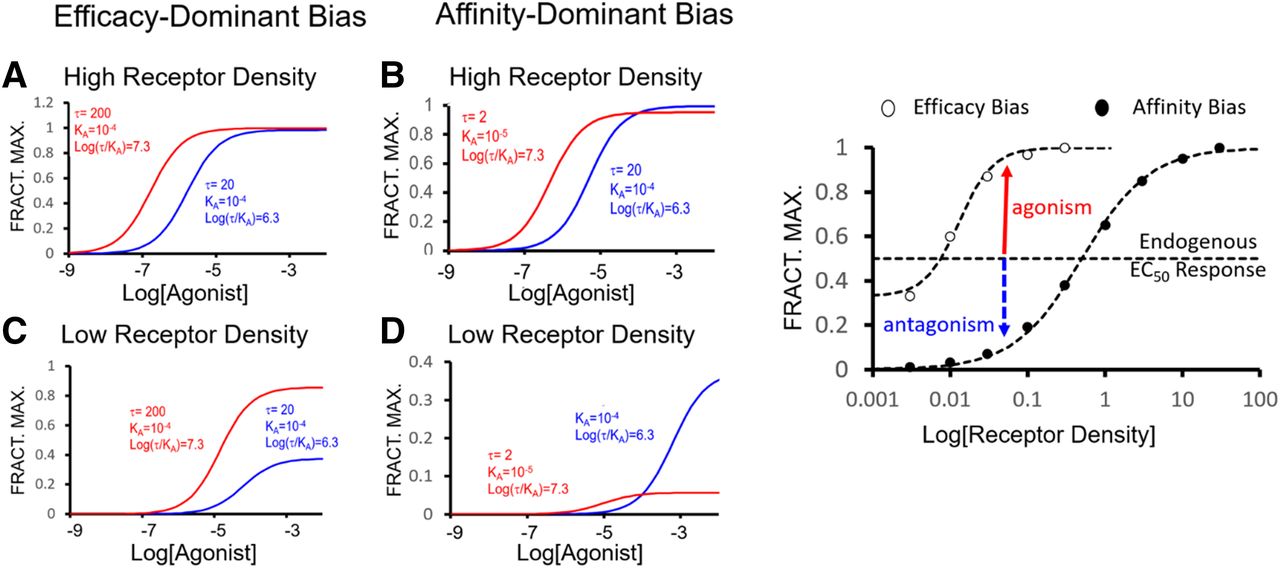
Agonist and antagonist effects of two identically biased agonists in a range of tissues with varying sensitivities (receptor densities). (A–D) The agonist in (A) and (C) achieves bias through selective efficacy, whereas the agonist in (B) and (D) is biased because of selective affinity. It can be seen that in high-sensitivity tissues (A and B), both agonists produce identical profiles of biased effect. However, in low-sensitivity tissues (low receptor density), the response in the preferred pathway (red curve) is selectively depressed for affinity-dominant bias (D) when compared with efficacy-dominant bias (C). In such tissues, this agonist will function as an antagonist. The right panel depicts the observed response to these agonists over a range of tissue sensitivities. It can be seen that with low receptor density, no agonist response will be produced and the ligands will function as antagonists. With increasing tissue sensitivity, the direct agonist effect of the agonists emerges. However, the range of tissues (as indicated by the range in receptor densities) demonstrating agonism is far greater for the efficacy-dominant agonist than it is for the affinity-dominant agonist (i.e., biased agonism is more robust in vivo for efficacy-dominant bias).
The complex interplay of bias and efficacy in the production of therapeutically relevant responses is illustrated by the effects of dopaminergic ligands for the treatment of schizophrenia, a disease postulated to be caused by striatal hyperdopaminergic and cortical hypodopaminergic activity. Partial agonists such as aripiprazole, developed to treat this disease, still are insufficient to correct cortical function; this profile is corrected with β-arrestin2 biased partial agonists that enhance firing of cortical fast-firing neurons (Urs et al., 2016). In general, the profile of striatal antagonism and cortical agonism leads to an improved antipsychotic profile, in that the lack of G protein signaling (bias) of these compounds coupled to the elevated expression of β-arrestin2 and GRK2 in the cortex (vs. striatum) produces the optimal conditions for the biased effect. It is proposed that the interplay of agonism and antagonism present in β-arrestin2 biased partial agonists such as the aripiprazole-derived analog compound 94A is critical to the favorable therapeutic potential for the treatment of schizophrenia (Allen et al., 2011; Urs et al., 2014, 2016).
IX. Future Considerations and Possible Ways Forward
Although the pharmacologic phenomenon of biased signaling is established and easily demonstrated in vitro, the value of this effect is still not really demonstrated in therapy. As pointed out, at the time of this writing, few biased molecules have been tested in humans and the first, TRV120027, failed to meet either the primary or secondary endpoints in the phase IIb Biased Ligand of the Angiotensin Receptor Study in Acute Heart Failure study (Pang et al., 2017). Two other molecules, TRV067 (a blocker of Gq protein–mediated vasoconstriction while sensitizing myofilament calcium-responsiveness in a genetic mouse model of dilated cardiomyopathy; Ryba et al., 2017) and TRV130 (the μ-opioid receptor agonist for postoperative pain; Chen et al., 2013a; Violin et al., 2014), are currently in clinical trials. These are examples of applying the concept of biased signaling through prospective means (the theoretical rationale precedes the creation of the molecule). Interestingly, there are retrospective examples of biased ligands that demonstrate a divergent clinical profile in treatment outcome before they were identified as being biased as in the case of carvedilol (Wisler et al., 2007; Kim et al., 2008). Similar examples of retrospective attribution of selective activity to biased signaling were discussed earlier in section VII.B. Although to date no designed biased molecule has been successful in the clinic, data with these retrospectively identified biased molecules furnish a roundabout proof of concept of the value of biased signaling.
The translational gaps involved in the progression of biased molecules from in vitro characterization studies to in vivo therapeutic conditions are expected and indeed predicted by the tenets of cellular pharmacology. Moreover, these gaps have been realized in the few attempts made to make the transfer into the therapeutic realm, raising the obvious question: What are ways forward to minimize attrition at this crucial step in the drug discovery and development process? One obvious but not very helpful approach would be to identify exemplar molecules in the initial stages of screening and lead optimization and then put them into the most therapeutically relevant systems as quickly as possible. However, the general theme of increasing texture in the pharmacological outcome of assays of greater complexity (i.e., from simple in vitro to highly complex in vivo) usually means that a set of “exemplars” will further differentiate into many subsets, leading to too many possible molecules to progress to the costly final steps of drug testing in humans.
There may be further less radical steps in the development process that can refine choices of biased molecules and result in more informed decisions for therapeutic progression. The use of primary cell systems is one approach that has been cited as a valuable intermediate step in the development process. For instance, cultured trigeminal neurons and glia have been reported to furnish useful data to characterize PACAP receptor biased molecules of possible value in regulation of circadian rhythms, reproduction and development, cognitive behavior, pain transmission, neuroprotection, and neuromodulation (Walker et al., 2014). Another approach is the more effective use of whole animals and complex readouts of biased response such as transcriptome analysis in control and genetically modified animals (Luttrell et al., 2018). Specifically, analyses from such studies often identify many differences, but it may be that concentrating on conserved elements across tissues with biased molecules may be more fruitful. For example, when the transcriptome in studies on bone metabolism with [d-Trp12,Tyr34]-bPTH(7-34) and hPTH(1-34) are compared in six different murine tissues, some interesting general phenomena are noted. Thus, the arrestin-biased molecule generates a more conserved response over the conventional ligand with regard to cell growth, development, and survival (Maudsley et al., 2015, 2016). In this regard, the application of more complex models may furnish more textured data capable of yielding therapeutically relevant concepts for biased molecules (Bradley and Tobin, 2016). Another factor in further defining useful in vivo phenotypes is the creation of tissue-specific gene knockouts. For example, the β-arrestin–biased angiotensin ligand TRV067 demonstrates cardioprotective effects in cardiomyocytes (Ryba et al., 2017). However, β-arrestin overall knockouts in vivo affect other tissues such as the vasculature and the kidney; therefore, it is difficult to ascribe in vivo effects directly to cardiac function (Woo et al., 2017). Often, a limitation to adequate determination of in vivo phenotypes is the difficulty in obtaining responses from the therapeutically relevant tissue; in this regard, the application of label-free technology may offer a way forward, as cell-specific responses can be measured with this format. Finally, the application of new technology and assay techniques such as whole animal functional resonance imaging may assist in the determination of therapeutically phenotypes in vivo; the tracking of brain region 5-HT1A function has been used to correlate in vitro bias with in vivo effect for biased 5-HT agonists (Becker et al., 2016).
In general, two major ideas have revolutionized receptor pharmacology over the past 15 years and spawned the concepts now discussed as biased receptor signaling. The first relates to the allosteric nature of 7TMRs and the view of multiconformational receptor states envisioned with molecular dynamics. The second idea involves the application of the plethora of new functional receptor assays now available to separately observe the wealth of behaviors practiced by 7TMRs. The observation of separate receptor signaling pathways indicates that classic receptor theory describing a simplistic active versus inactive receptor state is incapable of accommodating what is observed in experimental pharmacology. This article discusses the elements involved in biased receptor signaling (defined in section I) beginning with the pleiotropic components of receptor systems (section II) and the observed interactions between them (section III) that lead to the diversity of signaling produced in natural systems to fine-tune physiologic response (section IV). The discussion then progresses to the ideas around harnessing this mechanism for therapeutic advantage (section V); the molecular nature of the mechanism is then discussed in section VI. Section VII discusses the tools that have been proposed to quantify biased signaling so that it can be modified through medicinal chemistry to produce therapeutic molecules. Finally, the important caveats and hurdles in the translation of easily measured and quantified biased signaling effects observed when translating in vitro to in vivo systems for therapeutic advantage are discussed in section VIII. At the time of writing, this is an untested idea in terms of being a fruitful strategy to make better drugs. However, there is a strong rationale for believing that biased signaling could lead to valuable drug therapeutics; in terms of the minimal resources required to sustain efforts to detect and measure possible biased effects in new ligands (Kenakin, 2017), the value proposition for continuing exploration of this effect is favorable.
Authorship Contributions
Wrote or contributed to the writing of the manuscript: Kenakin.
Footnotes
Abbreviations
- 5-HT
- serotonin
- 7TMR
- seven-transmembrane receptor
- [35S]GTPγS
- 5′-O-(3-[35S]thio)triphosphate
- A-77636
- (1)-(1R,3S)-3-adamantyl-1-(aminomethyl)-3,4-dihydro-5,6-dihydroxy-1H-2-benzopyran hydrochloride hydrate
- AZ1729
- N-[3-(2-carbamimidamido-4-methyl-1,3-thiazol-5-yl)phenyl]-4-fluoro benzamide
- BAY 60-6583
- 2-[(6-amino-3,5-dicynao-4-[4-(cyclopropulmethoxy)phenyl]-2-pyridinyl]thio]-acetamide
- BQCA
- 1-(4-methoxybenzyl)-4-oxo-1,4-dihydroquinoline-3-carboxylic acid
- BRET
- bioluminescence resonance energy transfer
- CCL
- chemokine (C-C motif) ligand
- CCR
- chemokine (C-C motif) receptor
- CGP-12177
- 4-[3-[(1,1-dimethylethyl)amino]-2-hydroxypropoxy]-1,3-dihydro-2H-benzimidazol-2-one hydrochloride
- CHO
- Chinese hamster ovary
- CP55,940
- (−)-cis-3-[2-hydroxy-4-(1,1-dimethylheptyl)phenyl]-trans-4-(3-hydroxypropyl)cyclohexanol
- CXCR
- C-X-C chemokine receptor
- DAMGO
- [d-Ala2,Nme-Phe4,Gly-ol5]-enkephalin
- DPFE
- 1-(4-(2,4-difluorophenyl) piperazin-1-yl)-2-((4-fluorobenzyl)oxy)ethanone
- DREAD
- designer receptor exclusively activated by designer drugs
- Dyn1-11
- dynorphin 1-11
- ERK
- extracellular signal-regulated kinase
- GLP
- glucagon-like peptide
- GPCR
- G protein–coupled receptor
- GR89696
- 4-([3,4-dicholorophenyl]acetyl)-3-(1-pyrrolidinylmethyl)-1-piperazinecarboxylic acid methyl ester fumarate salt
- GRK
- G protein–coupled receptor kinase
- GUE1654
- 7-(methylthio)-2-[(2,2-diphenylacetyl)amino]benzo[1,2-d:4,3-d′]bisthiazole
- HEK293
- human embryonic kidney 293
- HIV
- human immunodeficiency virus
- hNPS
- human neuropeptide S
- ICI204448
- (RS)[3-[1-[[3,4-dichlorophenyl)acetyl]methylamino]-2-(1-pyrrolidinyl)ethyl]phenoxy]acetic acid hydrochloride
- (ICL)1-9
- TAIAKFERLLQTVTNYFIT
- IP1
- inositol phosphate
- IP3
- inositol triphosphate
- J113863
- 1,4-cis-1-(1-cycloocten-1-ylmethyl)-4-[[(2,7-dichloro-9H-xanthen-9-yl)carbonyl]amino]-1-ethylpiperidinium iodide
- JNK
- c-Jun N-terminal kinase
- MLS1547
- 5-chloro-7-[[4-(2-pyridinyl)-1-piperazinyl]methyl]-8-quinolinol
- NAM
- negative allosteric modulator
- NECA
- 1-(6-amino-9H-purin-9-yl)-1-deoxy-N-ethyl-β-d-ribofuranuronamide
- NHERF
- Na+/H+ exchange regulatory factor
- PACAP
- pituitary adenylate cyclase-activating polypeptide
- PAM
- positive allosteric modulator
- PAR
- protease-activated receptor
- PLC
- phospholipase C
- PR
- potency ratio
- PTH
- parathyroid hormone
- PTHrP
- parathyroid hormone–related peptide
- PZM21
- 1-[(2S)-2-(dimethylamino)-3-(4-hydroxyphenyl)propyl]-3-[(2S)-1-(thiophen-3-yl)propan-2-yl]urea
- RA
- relative activity
- RAMP
- receptor activity-modifying protein
- RANTES
- regulated on activation normal T cell expressed and secreted
- RASSL
- receptor activated solely by a synthetic ligand
- SAR
- structure-activity relationship
- SII
- [Sar,Ile4,Ile8]-angiotensin II
- SNC80
- [(+)-4-[(αR)-α-((2S,5R)-4-allyl-2,5-dimethyl-1-piperazinyl)-3-methoxybenzyl]-N,N-diethylbenzamide
- SR592230A
- 3-(2-ethylphenoxy)-1-[(1,S)-1,2,3,4-tetrahydronaph-1-ylamkino]-2S-2-propanol oxalate
- TRV120027 (also TRV120)
- (2R)-2-{[(2S)-1-[(2S)-2-[(2S,3S)-2-[(2S)-2-[(2S)-2-[(2S)-5-carbamimidamido-2-[2-(methylamino)acetamido]pentanamido]-3-methylbutanamido]-3-(4-hydroxyphenyl)propanamido]-3-methylpentanamido]-3-(1H-imidazol-5-yl)propanoyl]pyrrolidin-2-yl]formamido}propanoic acid
- TRV130
- N-[(3-methoxythiophen-2-yl)methyl]-2-(9-pyridin-2-yll-6-oxaspiro[4,5]decan-9-yl)ethanamine
- UCB35625
- 1,4-trans-1-(1-cycloocten-1-ylmethyl)-4-[[(2,7-dichloro-9H-xanthen-9-yl)carbonyl]amino]-1-ethylpiperidinium iodide
- UNC9975
- 7-[4-[4-(2,3-dichlorophenyl)-1,4-diazepan-1-yl]butoxy]-1,2,3,4-tetrahydro-1,8-naphthyridin-2-one
- VU0360172
- N-cyclobutyl-6-((3-flurophenyl)ethynyl) picolinamide
- Copyright © 2019 by The American Society for Pharmacology and Experimental Therapeutics
References
- ↵
- ↵
- ↵
- ↵
- ↵
- ↵
- ↵
- ↵
- ↵
- ↵
- ↵
- ↵
- ↵
- ↵
- ↵
- ↵
- ↵
- ↵
- ↵
- ↵
- ↵
- ↵
- ↵
- ↵
- ↵
- ↵
- ↵
- ↵
- ↵
- ↵
- ↵
- ↵
- ↵
- ↵
- ↵
- ↵
- ↵
- ↵
- ↵
- ↵
- ↵
- ↵
- ↵
- ↵
- ↵
- ↵
- ↵
- ↵
- ↵
- ↵
- ↵
- ↵
- ↵
- ↵
- ↵
- ↵
- ↵
- ↵
- ↵
- ↵
- ↵
- ↵
- ↵
- ↵
- ↵
- ↵
- ↵
- ↵
- ↵
- ↵
- ↵
- ↵
- ↵
- ↵
- ↵
- ↵
- ↵
- ↵
- ↵
- ↵
- ↵
- ↵
- ↵
- ↵
- ↵
- ↵
- ↵
- ↵
- ↵
- ↵
- ↵
- ↵
- ↵
- ↵
- ↵
- ↵
- ↵
- ↵
- ↵
- ↵
- ↵
- ↵
- ↵
- ↵
- ↵
- ↵
- ↵
- ↵
- ↵
- ↵
- ↵
- ↵
- ↵
- ↵
- ↵
- ↵
- ↵
- ↵
- ↵
- ↵
- ↵
- ↵
- ↵
- ↵
- ↵
- ↵
- ↵
- ↵
- ↵
- ↵
- ↵
- ↵
- ↵
- ↵
- ↵
- ↵
- ↵
- ↵
- ↵
- ↵
- ↵
- ↵
- ↵
- ↵
- ↵
- ↵
- ↵
- ↵
- ↵
- ↵
- ↵
- ↵
- ↵
- ↵
- ↵
- ↵
- ↵
- ↵
- ↵
- ↵
- ↵
- ↵
- ↵
- ↵
- ↵
- ↵
- ↵
- ↵
- ↵
- ↵
- ↵
- ↵
- ↵
- ↵
- ↵
- ↵
- ↵
- ↵
- ↵
- ↵
- ↵
- ↵
- ↵
- ↵
- ↵
- ↵
- ↵
- ↵
- ↵
- ↵
- ↵
- ↵
- ↵
- ↵
- ↵
- ↵
- ↵
- ↵
- ↵
- ↵
- ↵
- ↵
- ↵
- ↵
- ↵
- ↵
- ↵
- ↵
- ↵
- ↵
- ↵
- ↵
- ↵
- ↵
- ↵
- ↵
- ↵
- ↵
- ↵
- ↵
- ↵
- ↵
- ↵
- ↵
- ↵
- ↵
- ↵
- ↵
- ↵
- ↵
- ↵
- ↵
- ↵
- ↵
- ↵
- ↵
- ↵
- ↵
- ↵
- ↵
- ↵
- ↵
- ↵
- ↵
- ↵
- ↵
- ↵
- ↵
- ↵
- ↵
- ↵
- ↵
- ↵
- ↵
- ↵
- ↵
- ↵
- ↵
- ↵
- ↵
- ↵
- ↵
- ↵
- ↵
- ↵
- ↵
- ↵
- ↵
- ↵
- ↵
- ↵
- ↵
- ↵
- ↵
- ↵
- ↵
- ↵
- ↵
- ↵
- ↵
- ↵
- ↵
- ↵
- ↵
- ↵
- ↵
- ↵
- ↵
- ↵
- ↵
- ↵
- ↵
- ↵
- ↵
- ↵
- ↵
- ↵
- ↵
- ↵
- ↵
- ↵
- ↵
- ↵
- ↵
- ↵
- ↵
- ↵
- ↵
- ↵
- ↵
- ↵
- ↵
- ↵
- ↵
- ↵
- ↵
- ↵
- ↵
- ↵
- ↵
- ↵
- ↵
- ↵
- ↵
- ↵
- ↵
- ↵
- ↵
- ↵
- ↵
- ↵
- ↵
- ↵
- ↵
- ↵
- ↵
- ↵
- ↵
- ↵
- ↵
- ↵
- ↵
- ↵
- ↵
- ↵
- ↵
- ↵
- ↵
- ↵
- ↵
- ↵
- ↵
- ↵
- ↵
- ↵
- ↵
- ↵
- ↵
- ↵
- ↵
- ↵
- ↵
- ↵
- ↵
- ↵
- ↵
- ↵
- ↵
- ↵
- ↵
- ↵
- ↵
- ↵
- ↵
- ↵
- ↵
- ↵
- ↵
- ↵
- ↵
- ↵
- ↵
- ↵
- ↵
- ↵
- ↵
- ↵
- ↵
- ↵
- ↵
- ↵
- ↵
- ↵
- ↵
- ↵
- ↵
- ↵
- ↵
- ↵
- ↵
- ↵
- ↵
- ↵
- ↵
- ↵
- ↵
- ↵
- ↵
- ↵
- ↵
- ↵
- ↵
- ↵
- ↵
- ↵
- ↵
- ↵
- ↵
- ↵
- ↵
- ↵
- ↵
- ↵
- ↵
- ↵
- ↵
- ↵
- ↵
- ↵
- ↵
- ↵
- ↵
- ↵
- ↵
- ↵
- ↵
- ↵
- ↵
- ↵
- ↵
- ↵
- ↵
- ↵
- ↵
- ↵
- ↵
- ↵
- ↵
- ↵
- ↵
- ↵
- ↵
- ↵
- ↵
- ↵
- ↵
- ↵
- ↵
- ↵
- ↵
- ↵
- ↵
- ↵
- ↵
- ↵
- ↵
- ↵
- ↵
- ↵
- ↵
- ↵
- ↵
- ↵
- ↵
- ↵
- ↵
- ↵
- ↵
- ↵
- ↵
- ↵
- ↵
- ↵
- ↵
- ↵
- ↵
- ↵
- ↵
- ↵
- ↵
- ↵
- ↵
- ↵
- ↵
- ↵
- ↵
- ↵
- ↵
- ↵
- ↵
- ↵
- ↵
- ↵
In this issue


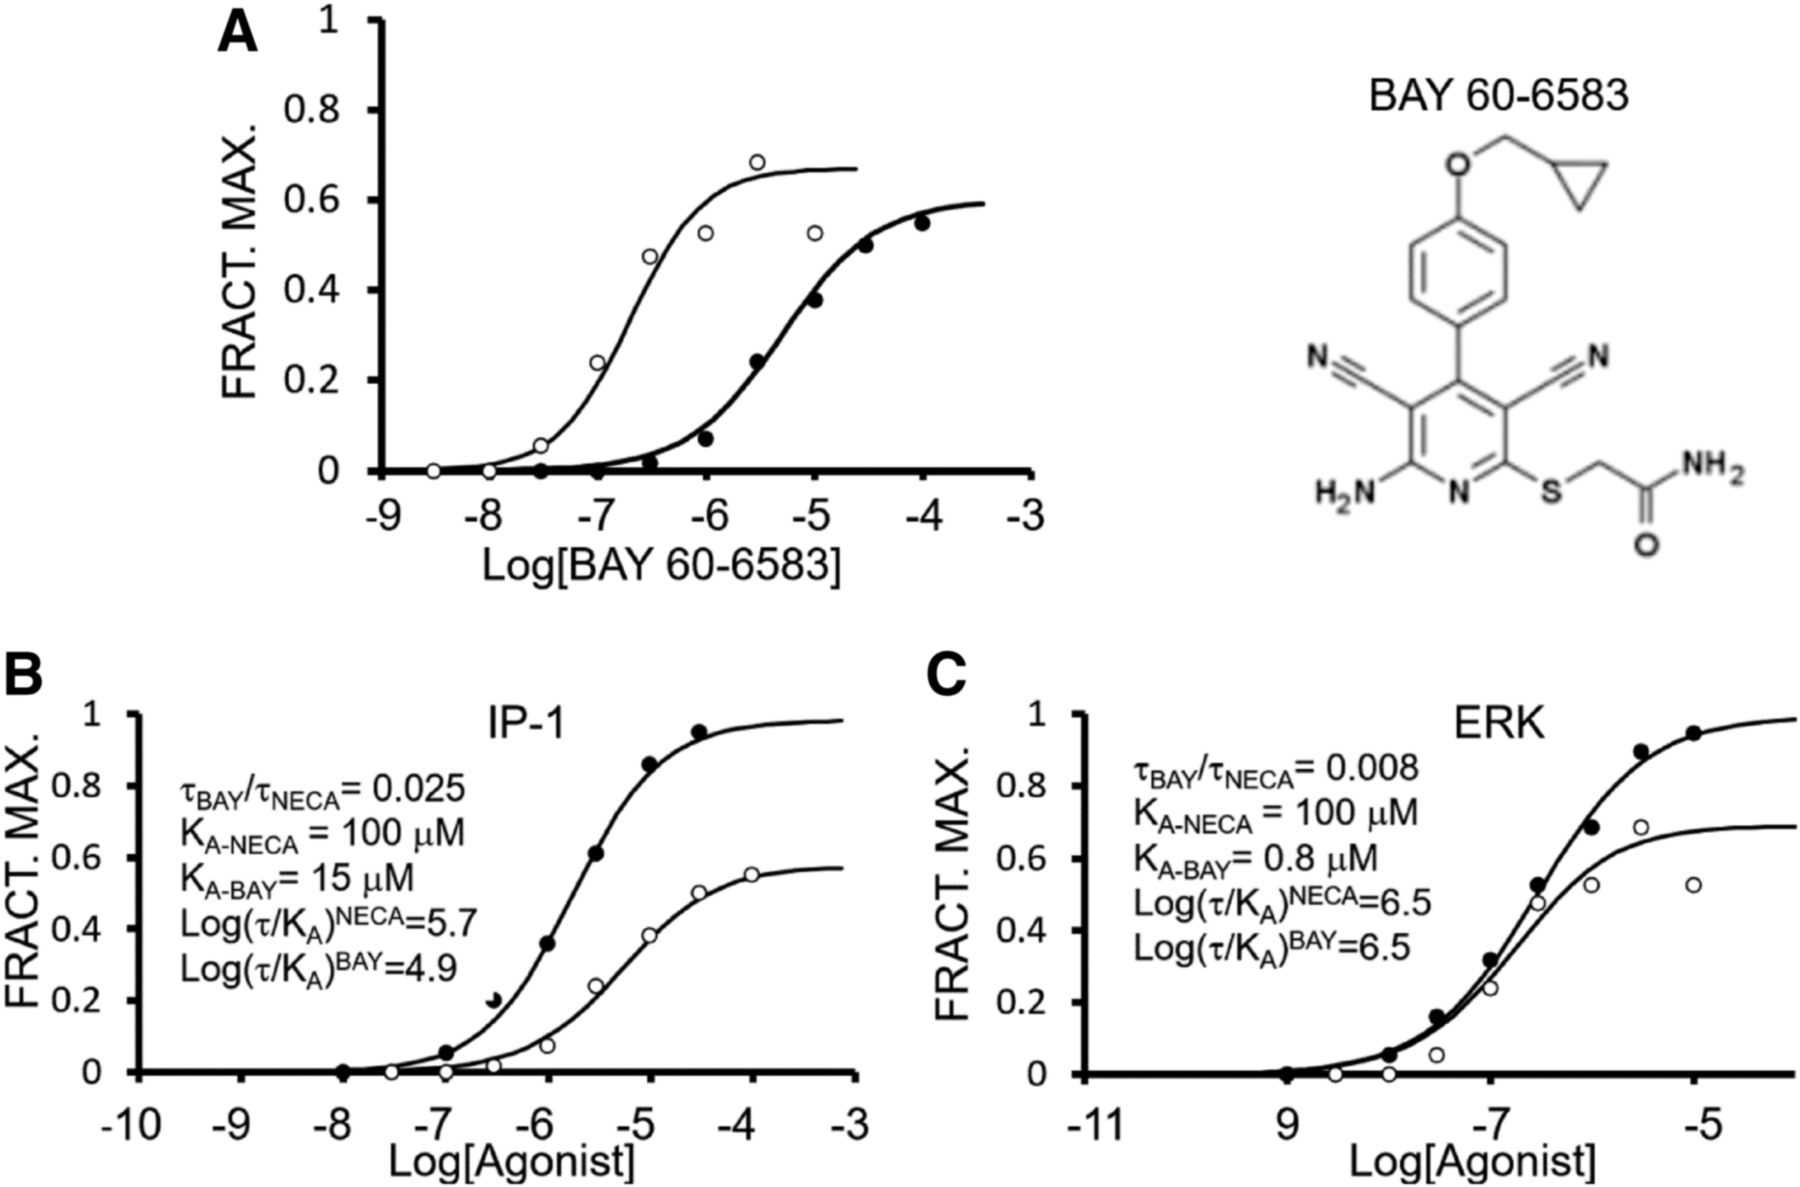
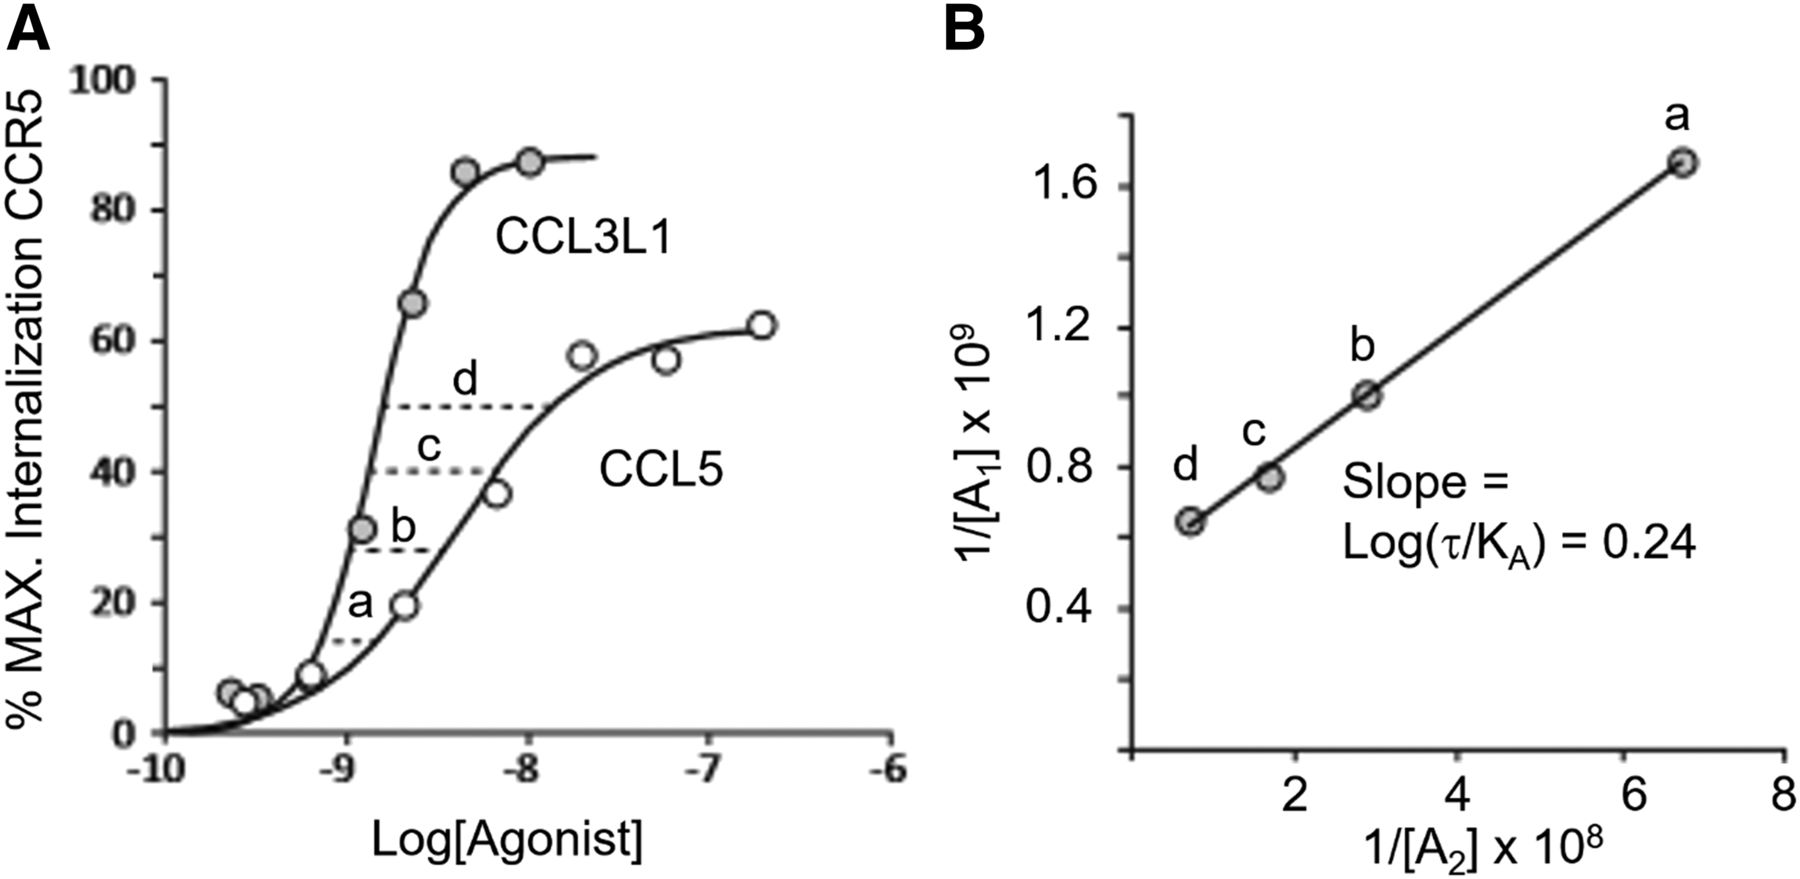
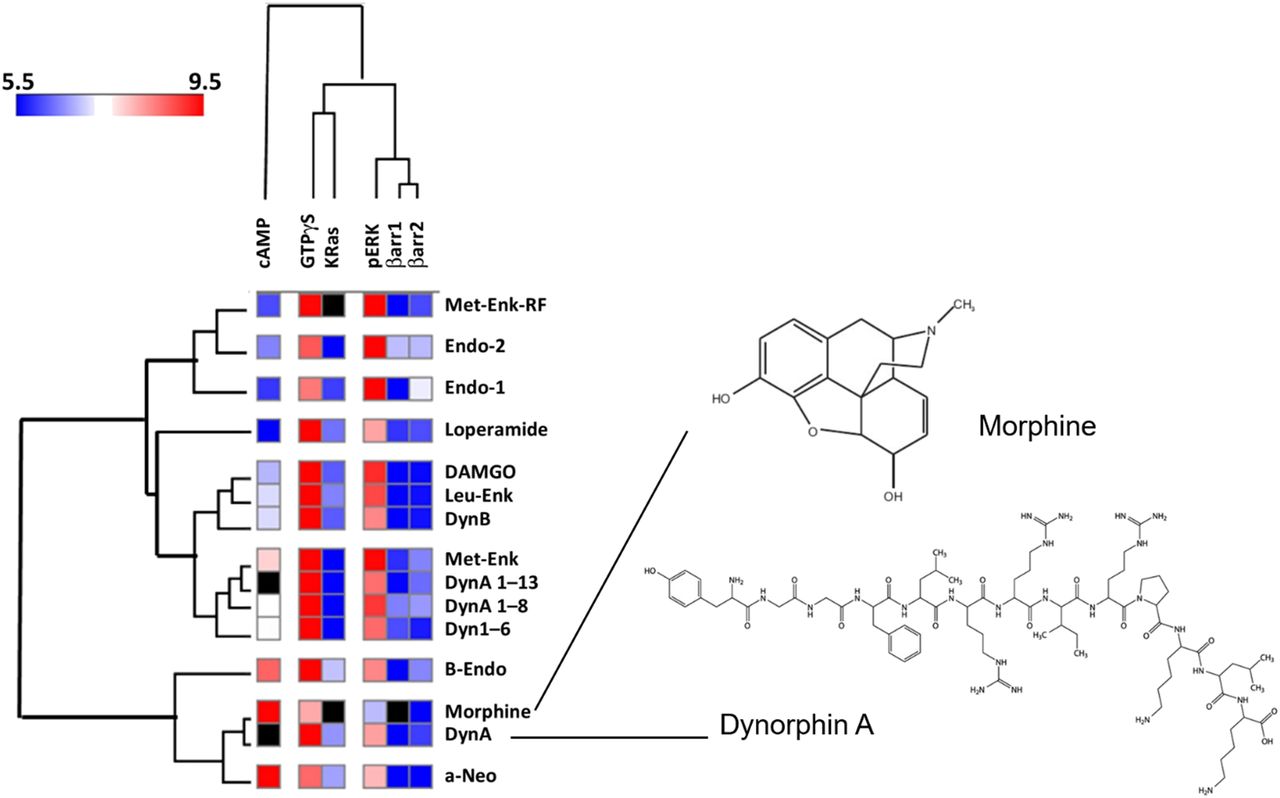
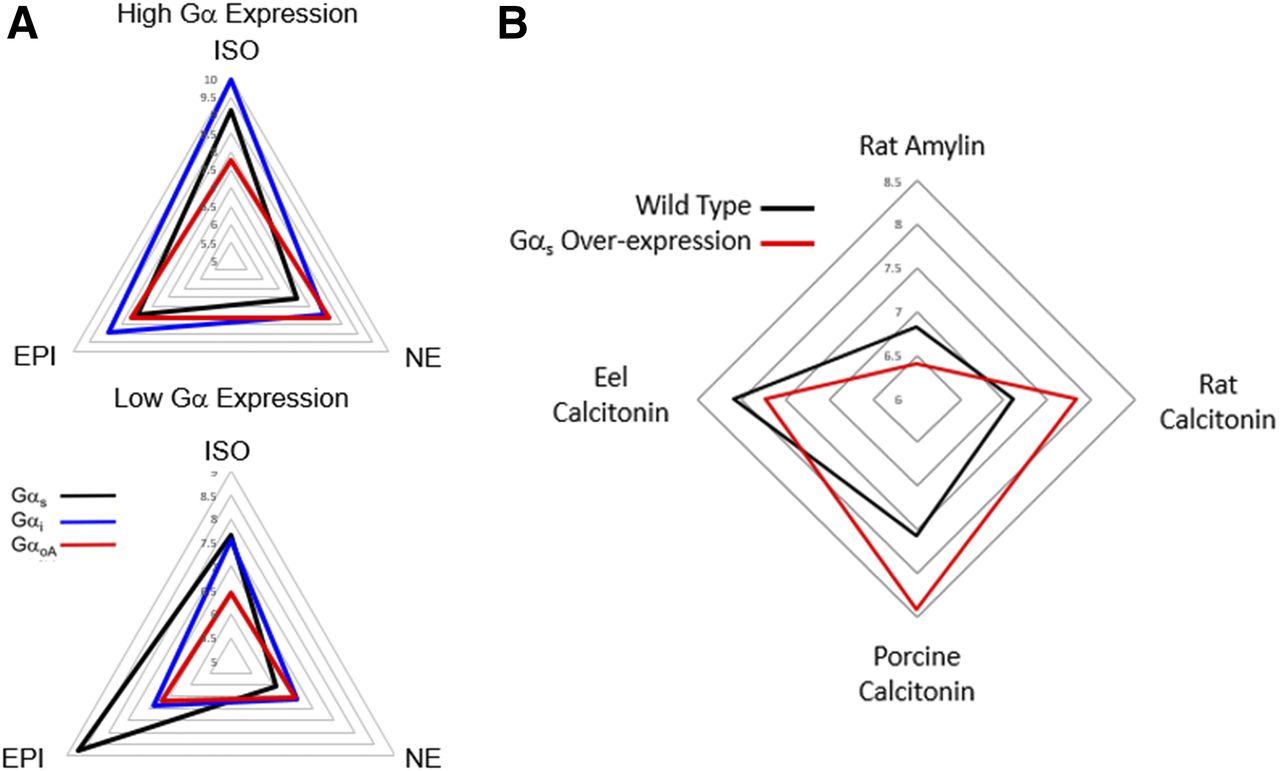
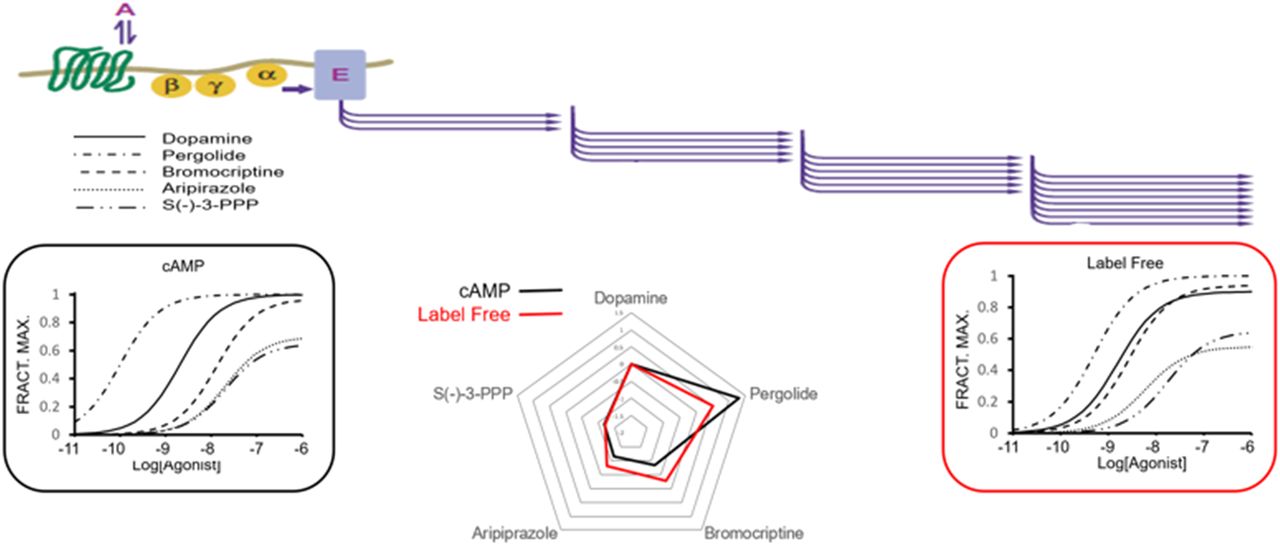
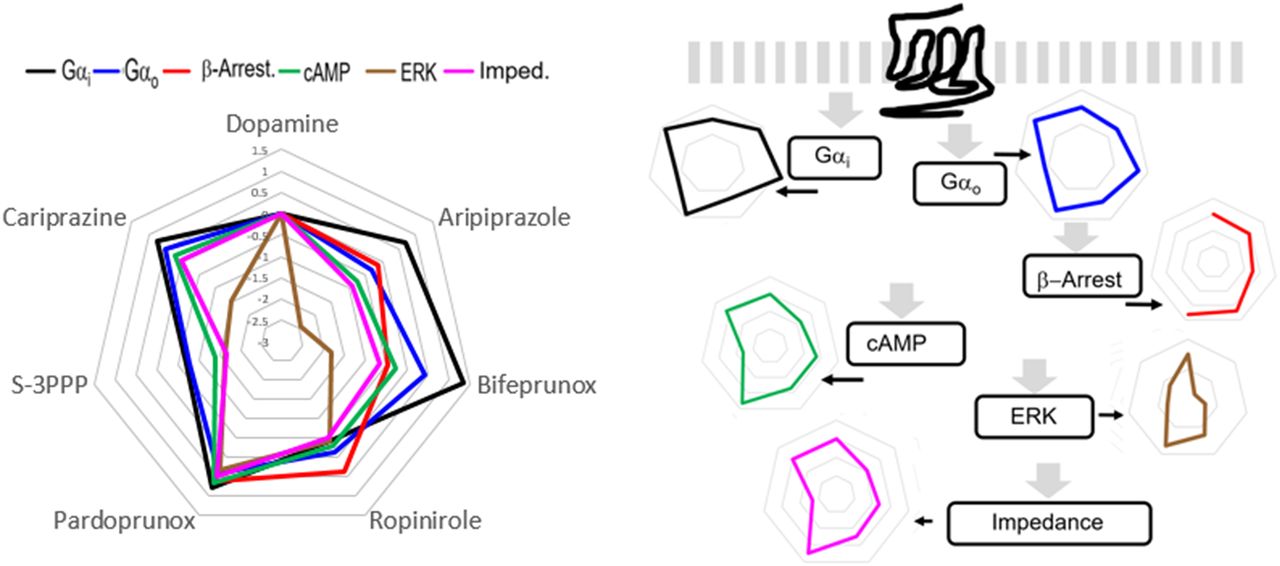
Jump to section
- Article
- Abstract
- I. Introduction
- II. Pleiotropic Receptor Systems
- III. Bias and Pluridimensional Efficacy and Affinity
- IV. Naturally Biased Signaling in Physiology
- V. Therapeutic Application of Biased Signaling
- VI. Molecular Mechanism(s) of Ligand Bias
- VII. Detection and Quantification of Biased Signaling
- VIII. Translation of In Vitro Bias to In Vivo Physiology
- IX. Future Considerations and Possible Ways Forward
- Authorship Contributions
- Footnotes
- Abbreviations
- References
- Figures & Data
- Info & Metrics
- eLetters