


Article Figures & Data
Figures
- Fig. 1.
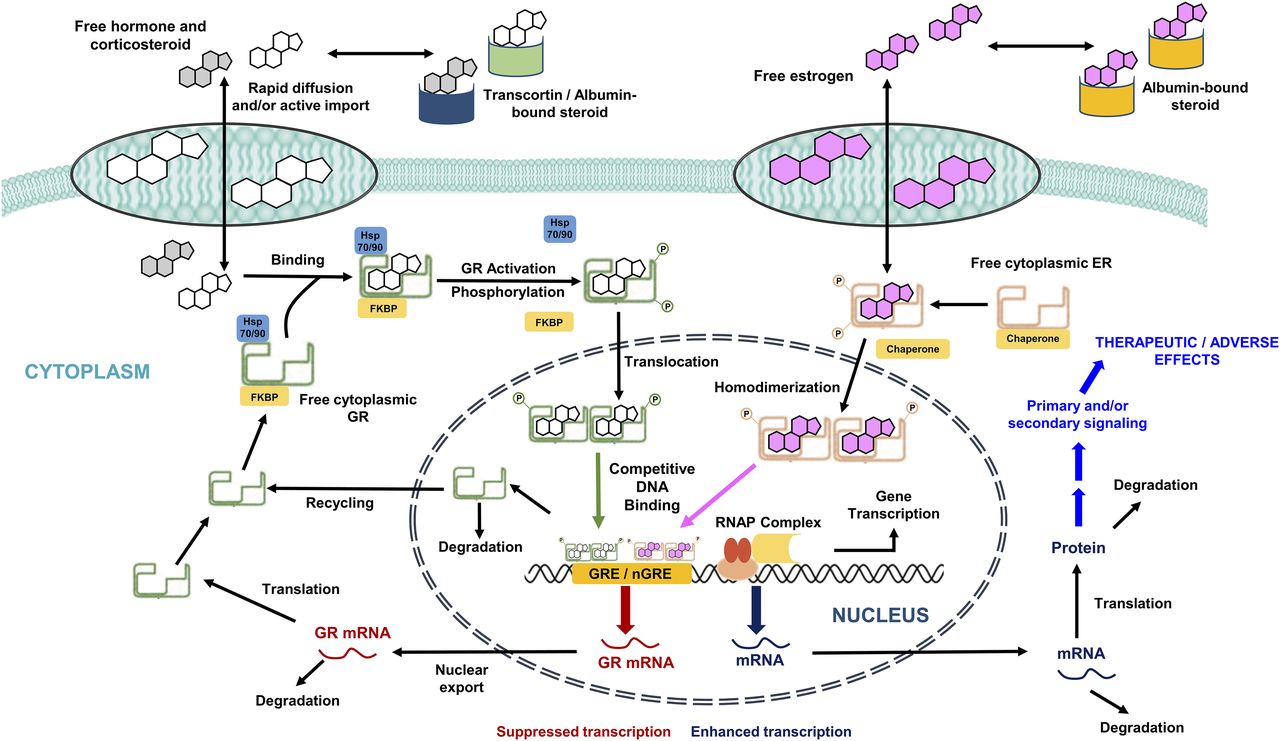
Schematic representation of the genomic mechanism of corticosteroids in tissues and the influence of estrogens on glucocorticoid signaling. ER, estrogen receptor; FKBP, FK506 binding protein; GR, glucocorticoid receptor; hsp 70/90, heat shock protein 70/90; nGRE, negative glucocorticoid response element; RNAP, RNA polymerase. Figure adapted from (Ayyar et al., 2017b).
- Fig. 2.
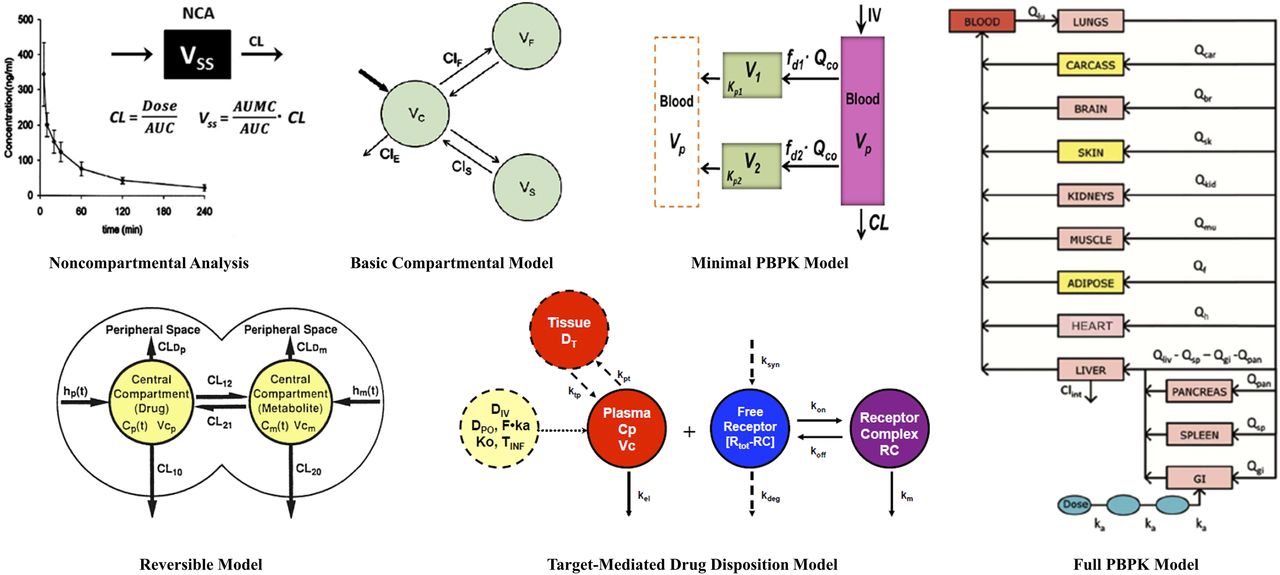
Array of modeling approaches for pharmacokinetic data and systems, including noncompartmental analysis (NCA), basic compartmental (mammillary) models, reversible PK models, TMDD models, minimal PBPK, and full PBPK models. PBPK, physiologically-based pharmacokinetic; TMDD, target-mediated drug disposition.
- Fig. 3.
(Top) Schematics of the pharmacokinetic (left) and two-compartment cell distribution and direct suppression model for basophils (whole blood histamine) (right) in relation to methylprednisolone (CMP) concentrations where IC50 is the CMP producing 50% inhibition of basophil return to blood (kr). (Bottom) Methylprednisolone concentrations (left) and blood basophils as whole blood histamine concentrations (CB) vs. time in a normal male subject at baseline and after 10 (●), 20 (■) and 40 (▲) mg of intravenous methylprednisolone sodium succinate. Solid lines depict joint model fittings. Figure modified from Kong et al., 1989 with permission of John Wiley & Sons, Inc.
- Fig. 4.
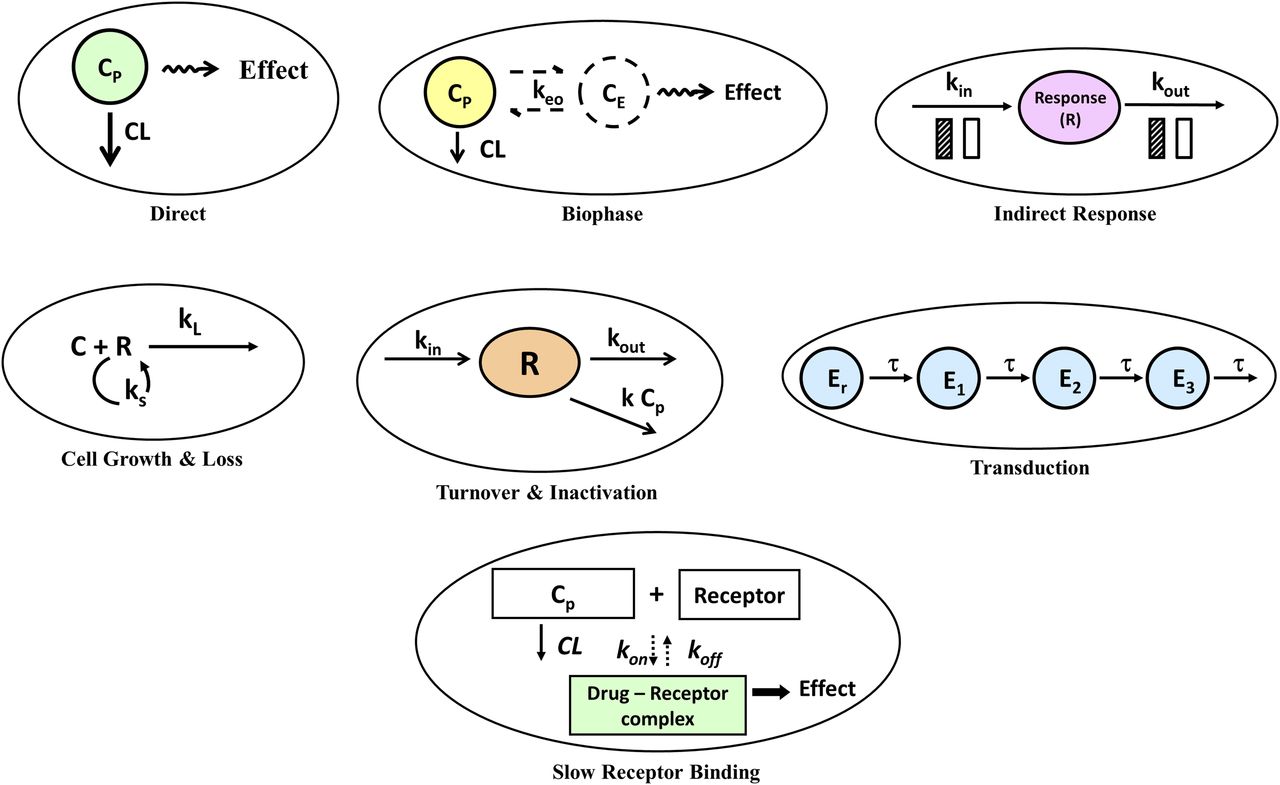
Seven major PK/PD models based on mechanisms of drug action and primary rate-limiting steps in the kinetic, target-binding, or physiologic process.
- Fig. 5.
Basic components of systems pharmacokinetic/pharmacodynamic models of genomic drug action. The PK is reflected by the concentration of drug in the central (plasma) compartment and its distribution to the effect site(s) in tissues. Local concentrations of unbound drug bind with free receptors that are synthesized (ksyn) and degraded (kdeg) over time in tissues. Target engagement and occupancy serves as the driving force for the inhibition and/or stimulation of the production (kin) or removal (kout) of multiple target gene biomarkers. Genomic markers and mediators of both therapeutic and adverse drug effects signal through interconnected gene (mRNA and protein) networks to mediate clinically measurable PD end-point responses. For drugs with genomic mechanisms, such as corticosteroids, signaling proteins related to efficacy and toxicity often do not transduce in a linear manner but interact through intertwined signaling networks.
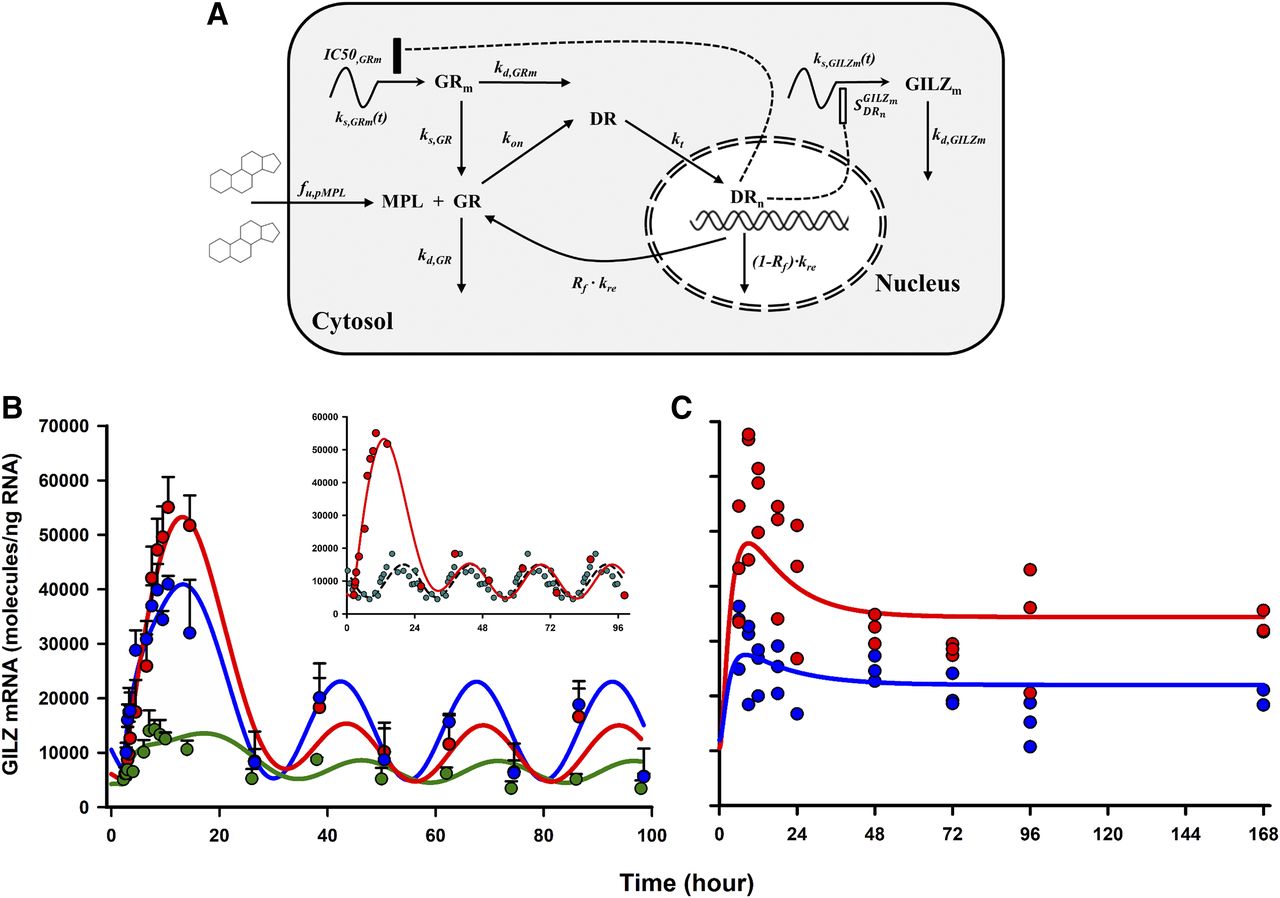
- Fig. 6.
Pharmacodynamic scheme for receptor/gene-mediated corticosteroid action (A); measured data (circles) and model-fitted GILZ mRNA dynamics (lines) in skeletal muscle (green), lung (blue), and adipose tissue (red) after 50 mg/kg i.m. doses of methylprednisolone were given to male rats (B); and measured data (circles) and model-predicted (simulated) dynamics of GILZ mRNA (lines) in lung (blue) and adipose tissue (red) upon 0.3 mg/kg/h s.c. infusion of methylprednisolone administered to male rats over 1 week (C). The inset in (B) jointly depicts the mean PD profiles of GILZ in adipose tissue from dosed (red, solid line) and circadian control (cyan, dashed line) animals. Figure adapted from (Ayyar et al., 2017b).
- Fig. 7.
(A) Schematic of systems pharmacodynamic model linking methylprednisolone pharmacokinetics, glucocorticoid receptor dynamics, and hepatic mRNA and protein biomarkers to select efficacy and toxicity end-points in rats. Stimulation is denoted as open rectangles, and inhibition is denoted by closed rectangles. Heavy lines reflect turnover while broken lines reflect effects. (B) Measured and model-fitted profiles of steroid PK after 50 mg/kg i.v. (top-left) and i.m. (top-middle) doses, fitted profiles of receptor (mRNA, free cytosolic, and nuclear complex) dynamics (top right), TAT signaling pathway (middle row), and acute phase response and lymphocyte dynamics (bottom). Orange, PK; green, mRNA; blue, protein; and red, physiologic PD end-point. Figure adapted from Ayyar et al., 2018b with permission by Springer Nature.
- Fig. 8.
Systems modeling of sex differences in methylprednisolone action. (A) Diagrammatic summary of the various animal cohorts and general experimental study design. (B) General scheme of the multiscale modeling approach which provides the basis for the development of the systems PK/PD/PG model. (C) Schematic of the mPBPK/PD/PG systems model for corticosteroid actions in male and female rats. Lines with arrows indicate blood flows, binding interactions, conversion of species, or turnover of responses. Dashed lines ending in closed boxes indicate inhibition whereas dashed lines with open boxes depict a stimulation of turnover exerted by the connected factors.
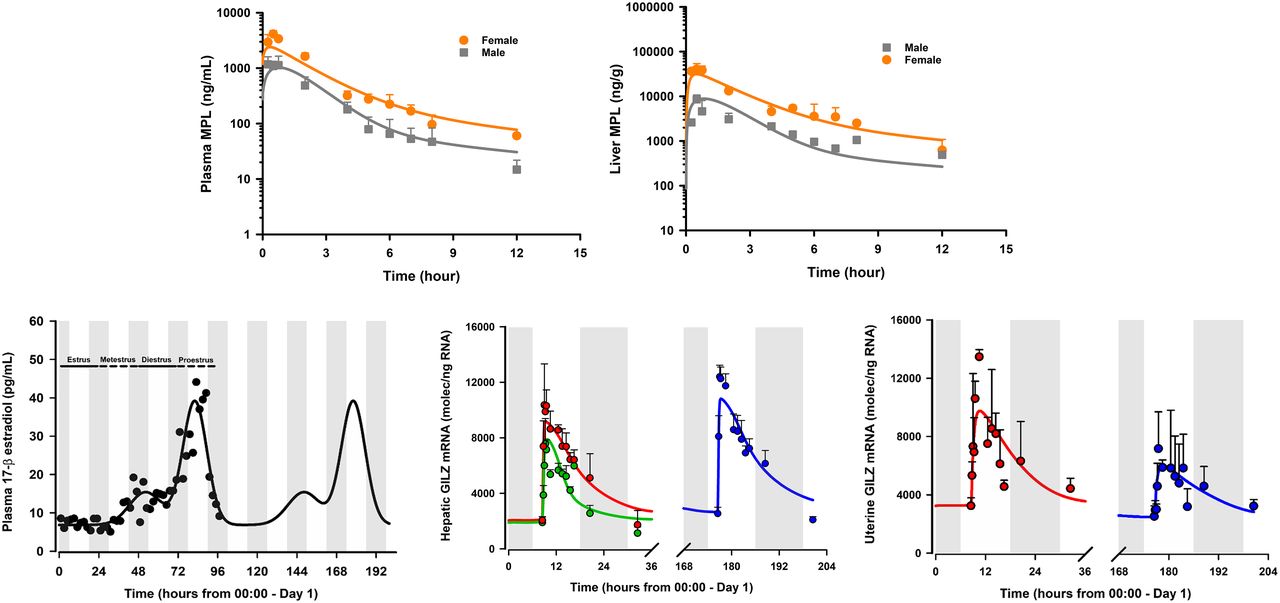
- Fig. 9.
Model fittings of the concentration-time profiles of total MPL in plasma (top left) and liver (top right) of male and female rats that received 50 mg/kg i.m. doses of MPL. Shown on the (bottom left) is the plasma concentration-time profile of E2 in female rats over the 4-day estrous cycle; symbols are measurements from individual rats, and the solid line depicts the model-fitted profile shown to repeat for a second cycle. (Bottom middle) depicts GILZ mRNA in liver from male rats (green), estrus-phased female rats (red), and proestrus-phased female rats (blue) given 50 mg/kg i.m. MPL. The GILZ mRNA in uterus from estrus-phased female rats (red) and proestrus-phased female rats (blue) given 50 mg/kg i.m. MPL is shown (bottom right). Symbols represent the mean ± S.D. Dark (shaded) and light (unshaded) periods are indicated. Figure adapted from (Ayyar et al., 2019a and 2019b).
- Fig. 10.
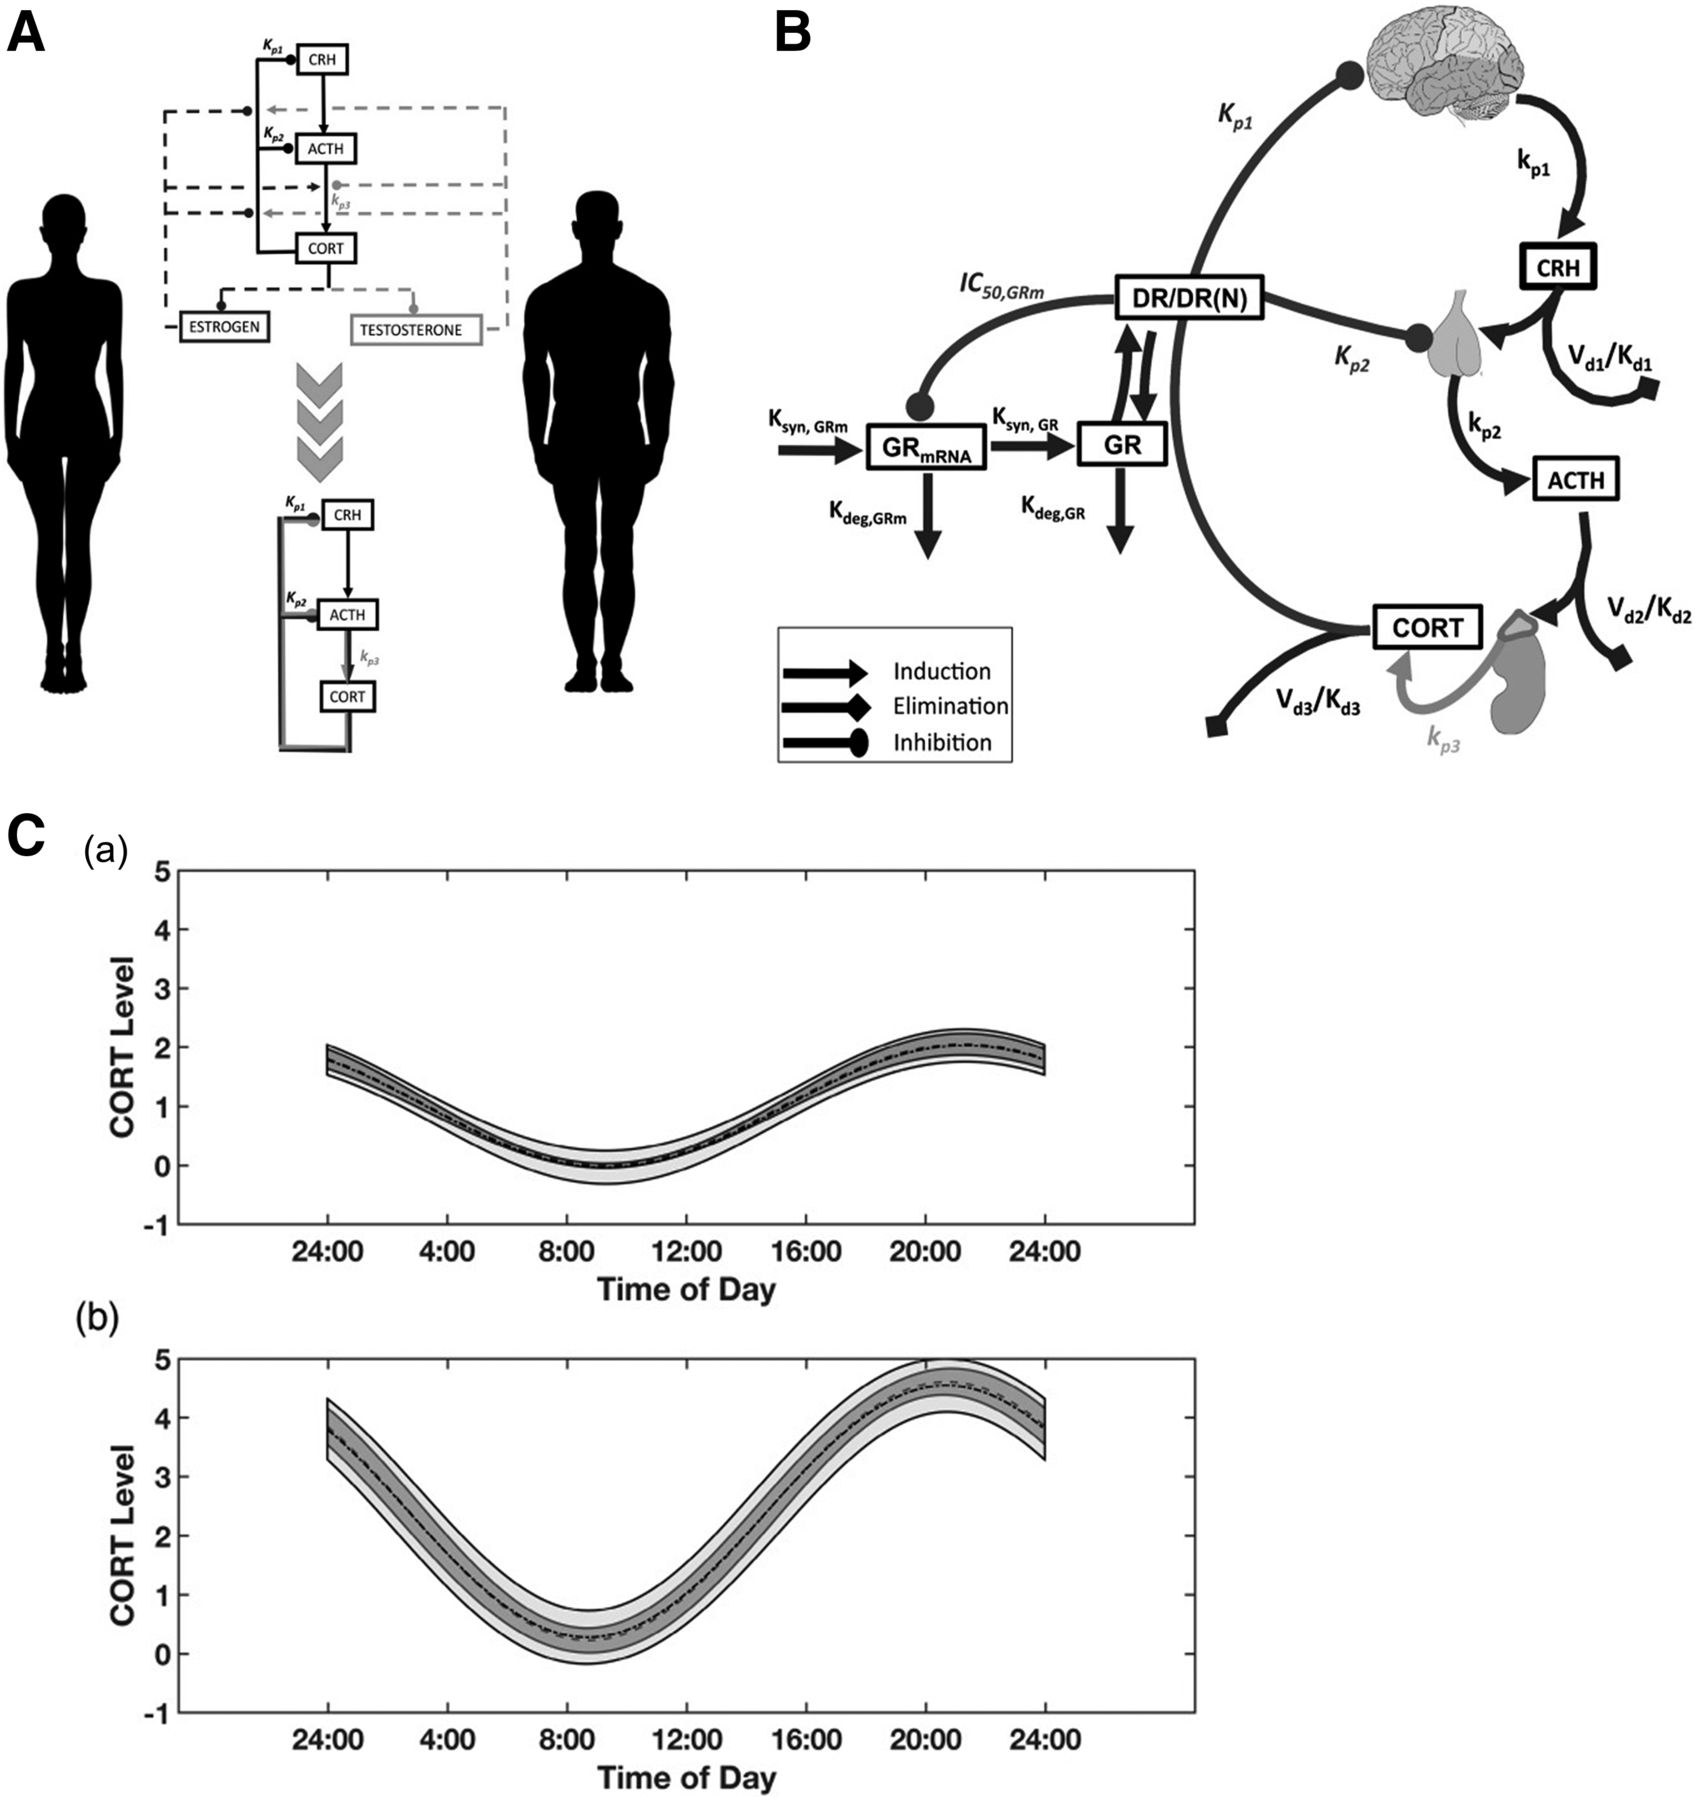
(A) General schematic of the physiologic model considering sex-related variability on the HPA axis to occur on the strength of glucocorticoid-mediated negative feedback (Kp1 and Kp2) and adrenal sensitivity (kp3) within the HPA network. (B) Schematic representation of the signaling mediators in the mathematical model incorporating the fifth-generation model for corticosteroids. (C) Simulated and experimental circadian CORT profiles generated by (a) male and (b) female parameter sets. For both (male and female), the dashed line represents the mean of simulated CORT circadian profiles generated by the parameter sets. The dark gray-shaded area represents the S.D. of the simulated CORT circadian profiles. The black dashed and dotted line represents the scaled mean experimental cosinor for the CORT profile. The light gray shaded area represents the scaled S.D. of the experimental CORT cosinors. ACTH, adrenocorticotrophic hormone; CORT, corticosterone; CRH, corticotropin releasing hormone. Figure adapted from Rao and Androulakis, 2017 with permission by Oxford University Press.


