


Abstract
Tobacco use is a leading contributor to disability and death worldwide, and genetic factors contribute in part to the development of nicotine dependence. To identify novel genes for which natural variation contributes to the development of nicotine dependence, we performed a comprehensive genome wide association study using nicotine dependent smokers as cases and non-dependent smokers as controls. To allow the efficient, rapid, and cost effective screen of the genome, the study was carried out using a two-stage design. In the first stage, genotyping of over 2.4 million single nucleotide polymorphisms (SNPs) was completed in case and control pools. In the second stage, we selected SNPs for individual genotyping based on the most significant allele frequency differences between cases and controls from the pooled results. Individual genotyping was performed in 1050 cases and 879 controls using 31 960 selected SNPs. The primary analysis, a logistic regression model with covariates of age, gender, genotype and gender by genotype interaction, identified 35 SNPs with P -values less than 10 −4 (minimum P -value 1.53 × 10 −6 ). Although none of the individual findings is statistically significant after correcting for multiple tests, additional statistical analyses support the existence of true findings in this group. Our study nominates several novel genes, such as Neurexin 1 ( NRXN1 ), in the development of nicotine dependence while also identifying a known candidate gene, the β3 nicotinic cholinergic receptor. This work anticipates the future directions of large-scale genome wide association studies with state-of-the-art methodological approaches and sharing of data with the scientific community.
INTRODUCTION
Tobacco use, primarily through cigarette smoking, is responsible for about five million deaths annually, making it the largest cause of preventable mortality in the world ( 1 ), and nicotine is the component in tobacco that is responsible for the maintenance of smoking. Because of increasing tobacco use in developing nations, it is predicted that the death toll worldwide will rise to more than 10 million per year by 2020.
In the USA, 21% of adults were current smokers in 2004, with 23% of men and 19% of women smoking ( 2 ). Each year, ∼440 000 people die of a smoking-related illness ( 3 ). The economic burden of smoking is correspondingly high. Annual costs are estimated at $75 billion in direct medical expenses and $92 billion in lost productivity. The prevalence of cigarette smoking has decreased over the last 30 years in the USA, primarily through smokers' successful efforts to quit. Yet, the rate of smoking cessation among adults has been slowing since the mid-1990s underscoring the limitations of current treatments for smoking. In addition, adolescents continue to initiate cigarette use, with 21% of high school students reporting cigarette smoking in the last month ( 4 ).
Smoking behaviors, including onset of smoking, smoking persistence (current smoking versus past smoking) and nicotine dependence, cluster in families ( 5 ), and large twin studies indicate that this clustering reflects genetic factors ( 6–10 ). Previous approaches have used genetic linkage studies ( 11–14 ) and candidate gene tests ( 15–17 ) to identify chromosomal regions and specific genetic variants suspected to be involved in smoking and nicotine dependence. We have extended the search for genetic factors by performing a high-density whole genome association study using a case-control design in unrelated individuals to identify common genetic variants that contribute to the transition from cigarette smoking to the development of nicotine dependence.
RESULTS
The final sample of 1050 nicotine dependent case subjects and 879 non-dependent controls who smoked was examined for population stratification, and no evidence of admixture was observed. Quality control measures were applied to the individually genotyped SNPs and 31 960 SNPs were available for analysis.
The most significant findings are presented in Table 1 for those SNPs with a P -value of less than 10 −4 . Several genes not previously implicated in the development of nicotine dependence are listed and their hypothesized mechanism of involvement is discussed below. The most significant result was observed with rs2836823 ( P -value = 1.53 × 10 −6 ). This SNP is intergenic, as are several of the top findings. A SNP was defined as ‘intergenic’ if it was not physically in a gene or within 10 kb of a known transcribed region. See Figure 1 for an overview of the individual genotyping results.
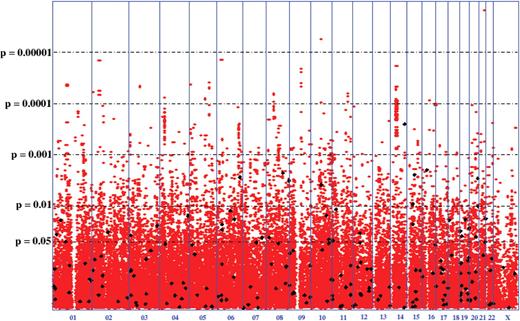
P -values of genome-wide association scan for genes that affect the risk of developing nicotine dependence. −log 10 (p) is plotted for each SNP in chromosomal order. The spacing between SNPs on the plot is based on physical map length. The horizontal lines show P -values for logistic analysis. The vertical lines show chromosomal boundaries. Black diamonds represent SNPs that result in non-synonymous amino acid changes.
SNPs with primary model P -value < 0.0001. Listed genes are within 10 kb of the SNP position
| SNP | Gene | Chr | Pos(bp) | Risk Allele a | Primary P -value | Male odds ratio (95%CI) | Female odds ratio (95% CI) |
|---|---|---|---|---|---|---|---|
| rs2836823 | 21 | 39,302,119 | T (0.48/0.4) | 1.53E-06 | 1.35 (1.08–1.68) | 1.46 (1.23–1.73) | |
| rs4142041 | CTNNA3 | 10 b | 68,310,957 | G (0.41/0.34) | 5.64E-06 | 1.73 (1.37–2.2)* | 1.14 (0.97–1.35)* |
| rs999c | GPSM3, AGPAT1, NOTCH4, RNF5, AGER, PBX2, AGER | 6 | 32,261,864 | C (0.96/0.94) | 1.42E-05 | 1.92 (1.06–3.45) | 2.53 (1.62–3.95) |
| rs12623467 | NRXN1 | 2 d | 51,136,740 | C (0.96/0.92) | 1.48E-05 | 2.42 (1.51–3.88) | 1.57 (1.14–2.16) |
| rs1782159 | 14 e | 40,826,319 | C (0.25/0.2) | 1.87E-05 | 1.97 (1.46–2.65)* | 1.09 (0.87–1.36)* | |
| rs12380218 | VPS13A | 9 f | 77,165,214 | G (0.24/0.19) | 2.09E-05 | 1.18 (0.9–1.55) | 1.56 (1.28–1.91) |
| rs2022443 | VPS13A | 9 f | 77,099,406 | G (0.24/0.19) | 2.49E-05 | 1.12 (0.86–1.45)* | 1.57 (1.29–1.91)* |
| rs2673931 | TRPC7 | 5 g | 135,717,335 | T (0.66/0.61) | 3.89E-05 | 1.68 (1.34–2.12)* | 1.04 (0.87–1.24)* |
| rs4142603 | 9 f | 76,998,948 | C (0.25/0.19) | 4.05E-05 | 1.15 (0.9–1.47) | 1.52 (1.26–1.84) | |
| rs1031006 | 5 | 14,040,103 | A (0.67/0.62) | 4.30E-05 | 0.98 (0.78–1.24)* | 1.49 (1.25–1.78)* | |
| rs2791480 | CLCA1 | 1 | 86,680,605 | G (0.78/0.72) | 4.38E-05 | 1.53 (1.19–1.97) | 1.33 (1.1–1.61) |
| rs10049135 | 3 | 72,731,670 | A (0.89/0.86) | 4.65E-05 | 2.09 (1.51–2.91)* | 0.96 (0.75–1.24)* | |
| rs11145381 | VPS13A | 9 f | 77,144,695 | C (0.23/0.18) | 4.72E-05 | 1.19 (0.91–1.57) | 1.54 (1.26–1.88) |
| rs2798983 | 14 e | 40,841,983 | C (0.28/0.22) | 4.77E-05 | 1.63 (1.25–2.13) | 1.28 (1.05–1.55) | |
| rs2546657 | TRPC7 | 5 g | 135,711,634 | A (0.66/0.62) | 4.96E-05 | 1.67 (1.33–2.09)* | 1.01 (0.85–1.2)* |
| rs1782182 | 14 e | 40,766,891 | G (0.31/0.25) | 5.28E-05 | 1.72 (1.33–2.22)* | 1.14 (0.95–1.38)* | |
| rs10490162 | NRXN1 | 2 | 51,159,308 | T (0.91/0.86) | 5.66E-05 | 1.92 (1.34–2.75) | 1.39 (1.08–1.79) |
| rs11694463 | 2 | 12,732,219 | C (0.12/0.09) | 6.10E-05 | 2.1 (1.4–3.15) | 1.37 (1.05–1.78) | |
| rs17706334 | 11 h | 108,486,074 | A (0.97/0.94) | 6.38E-05 | 1.71 (1.05–2.8) | 2.19 (1.44–3.33) | |
| rs17706299 | 11 h | 108,486,027 | C (0.97/0.94) | 6.51E-05 | 1.71 (1.05–2.79) | 2.19 (1.44–3.33) | |
| rs13277254 | CHRNB3 | 8 i | 42,669,139 | A (0.81/0.76) | 6.54E-05 | 1.19 (0.92–1.55) | 1.55 (1.26–1.91) |
| rs12467557 | NRXN1 | 2 d | 51,153,921 | A (0.96/0.93) | 6.88E-05 | 2.53 (1.48–4.31) | 1.62 (1.14–2.3) |
| rs17633258 | 11 h | 108,491,084 | C (0.97/0.94) | 7.31E-05 | 1.9 (1.14–3.15) | 2.11 (1.38–3.23) | |
| rs4859365 | 4 | 35,345,098 | G (0.52/0.45) | 7.72E-05 | 1.49 (1.2–1.86) | 1.24 (1.04–1.47) | |
| rs10793832 | FBXL17 | 5 | 107,348,129 | C (0.32/0.26) | 8.13E-05 | 1.11 (0.87–1.41) | 1.47 (1.23–1.76) |
| rs1782134 | 14 e | 40,785,318 | T (0.3/0.25) | 8.18E-05 | 1.68 (1.3–2.18)* | 1.15 (0.96–1.39)* | |
| rs11157219 | 14 e | 40,852,451 | G (0.3/0.24) | 8.78E-05 | 1.7 (1.31–2.2)* | 1.16 (0.96–1.4)* | |
| rs2302673 | FTO | 16 | 52,625,622 | T (0.87/0.84) | 8.85E-05 | 1.04 (0.76–1.44)* | 1.69 (1.33–2.16)* |
| rs1612945 | 14 e | 40,805,691 | C (0.3/0.24) | 8.91E-05 | 1.66 (1.29–2.15)* | 1.18 (0.98–1.42)* | |
| rs1782145 | 14 e | 40,800,126 | C (0.3/0.24) | 9.06E-05 | 1.65 (1.28–2.14)* | 1.18 (0.98–1.42)* | |
| rs1782141 | 14 e | 40,795,921 | A (0.3/0.25) | 9.20E-05 | 1.68 (1.3–2.16)* | 1.15 (0.96–1.39)* | |
| rs17633211 | 11 h | 108,490,715 | T (0.97/0.94) | 9.33E-05 | 1.9 (1.14–3.15) | 2.09 (1.37–3.19) | |
| rs6474413 | CHRNB3 | 8 i | 42,670,221 | T (0.81/0.76) | 9.36E-05 | 1.18 (0.91–1.53) | 1.54 (1.25–1.9) |
| rs9332406 | CTNNA3 | 10 b | 68,340,205 | A (0.4/0.34) | 9.71E-05 | 1.63 (1.28–2.06)* | 1.11 (0.94–1.32)* |
| rs1782144 | 14 e | 40,799,523 | G (0.3/0.24) | 9.88E-05 | 1.65 (1.28–2.14)* | 1.18 (0.98–1.43)* |
*Significantly different Odds Ratio for men and women.
a The risk allele is chosen arbitrarily to be the allele more prevalent in cases to facilitate comparison of effect sizes across SNPs. This does not imply that the effect of the variant is known in any case; the other allele could be protective. In addition, the alleles could be complementary to those reported in dbSNP (see online SNP information).
b Two Chr 10 SNPs with r 2 correlation of 0.89.
c The allele frequency for rs999 is quite different in these data than reported in dbSNP; this may represent a failure to accurately genotype this SNP in this study.
d Two Chr 2 SNPs with r 2 correlation of 0.91 (the other two Chr 2 SNPs have pair-wise correlations of < 50%).
e Nine Chr 14 SNPs with minimum pair-wise r 2 correlation of > 0.85.
f Four Chr 9 SNPs with minimum pair-wise r 2 correlation of > 0.85.
g Two Chr 5 SNPs with r 2 correlation of 0.99 (the other two Chr 5 SNPs are uncorrelated).
h Four Chr 11 SNPs with minimum pair-wise r 2 correlation of > 0.95.
i Two Chr 8 SNPs with r 2 correlation of 1.
Because of the dense genome-wide scope of our study, the interpretation of these P -values was complicated by the large number of statistical tests. Approximately 2.4 million SNPs were examined in the pooled screening stage. Although this is a large sample with nearly 2000 subjects, no SNP showed a genome-wide significant P -value after Bonferroni correction for multiple tests. Yet, several independent lines of evidence provided support that true genetic associations were identified in this top group of SNPs.
We used the agreement of direction of effect for the top SNPs in the Stage I samples (those included in the pooled genotyping, n = 948) as compared with those samples added in Stage II ( n = 981) as a measure of evidence for real associations within the dataset. If there were no true associations in the data, the expectation would be a random assortment of effect direction between the two sample sets. In contrast, 30 of the top 35 SNPs in the Stage I samples show the same direction of effect in the additional Stage II sample set. This level of agreement was highly significant, with a P -value of 1.1 × 10 −5 from the binomial distribution indicating the error rate associated with rejecting the hypothesis of chance agreement. Thus, our top SNPs were enriched for real and reproducible allele frequency differences between cases and controls.
Further evidence for the presence of true associations came from comparison of these results with a candidate gene study conducted simultaneously (described in the companion paper by Saccone et al . ( 18 ). The β3 nicotinic receptor candidate gene, CHRNB3 , the most significant finding in the candidate gene study, was also tagged by SNPs identified in the genome wide association study. This gene has a strong prior probability of a relationship with nicotine dependence, and the likelihood of any of the candidate genes in the study by Saccone and colleagues being selected in the top group of SNPs in the genome wide association study is less than 5%.
To investigate the accuracy of pooled genotyping estimates of the allele frequency differences between cases and controls, we examined the relationship between the pooled and individual genotyping results. The pooled genotyping indeed enriched the selected set of SNPs for sizable allele frequency differences between cases and controls included in the pooled study. When P -values were computed from individual genotypes using only Stage I samples, there is a strong enrichment of small P -values (Fig. 2 A). If the pooled genotyping was not at all successful, the distribution of P -values would be uniform, and if the pooling was completely accurate, then only small P -values would be present in the individual genotyping stage assessed in this sample subset. As seen in Figure 2 A, our results lie between these extremes. We also examined the P -values of the samples added into the Stage II, which were not in the pooling step. Because these Stage II samples are an independent random sample from the case and control populations, they are not expected to show the same allele frequency differences as Stage I samples where those differences are due to sampling error. Thus, their P -values should be uniformly distributed except for possible real associations, which would be consistent between the two sets of samples. This is seen in Figure 2 B. The graph is fairly uniform with only a slight increase in small P -values.
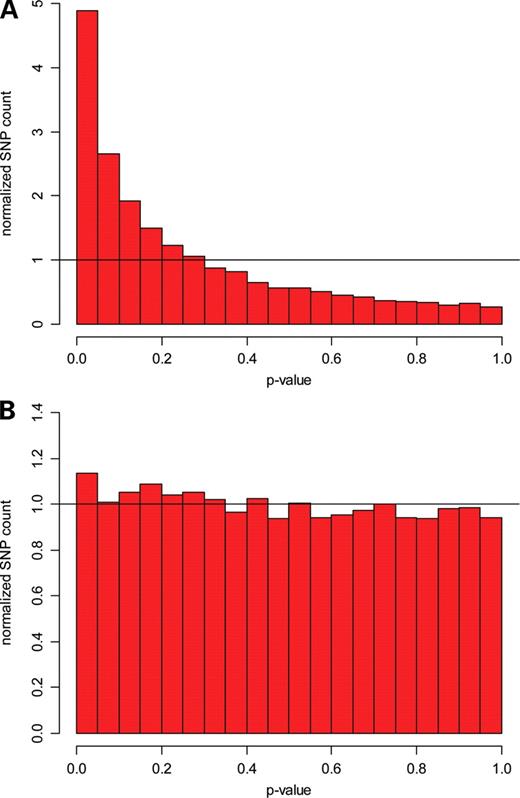
( A ) Distribution of P -values from the Stage I sample of the 31960 individually genotyped SNPs that were selected from pooled genotyping stage. The distribution shows that the pooled genotyping produced an enrichment of SNPs with small P -values. A uniform distribution from 0–1 would be expected if there were no correlation between pooled genotyping and individual genotyping. ( B ) Distribution of P -values from the additional samples added in Stage II. The distribution is fairly uniform with only a slight enrichment of small P -values.
In addition, we directly compared allele frequency estimates based on the pooled genotyping with those based on individual genotyping. As seen in Figure 3 , the majority of the allele frequency estimates from the pooled and individual genotyping results lie along the diagonal. A similar finding is seen if case or control samples are examined separately. We computed a correlation of 87% between allele frequencies estimated from the case pooled genotyping and allele frequencies computed in the individual genotyping sample of cases from Stage I (case subjects n = 482). Similarly, there was an 84% correlation of allele frequencies seen in the comparison of the pooled and individual genotyping in the control sample from Stage I (control subjects n = 466). When we compared the allele frequency differences between cases and controls in pools (which is implicitly large because the SNPs were selected for individual genotyping) with the difference between cases and controls in the individual genotyping, we found a 58% correlation. This indicates a high level of concordance between the pooled and individual genotyping results; thus, the pooled genotyping was successful in identifying SNPs that would show allele frequency differences in individually genotyped case and control subjects.
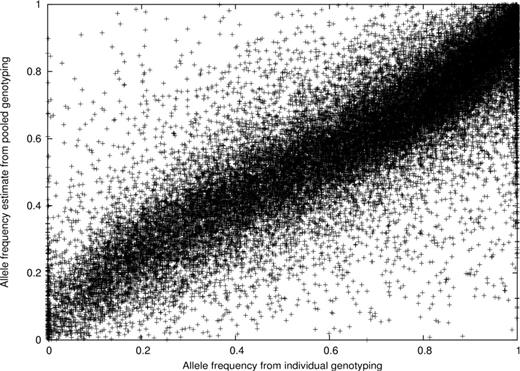
Scatter plot of the allele frequencies from pooling and individual genotyping from the Stage I sample.
Lastly, we examined potential differences between the US and Australian samples. A comparison of cases and controls from the two populations did not show any significant differences by gender or stratification results.
DISCUSSION
Smoking contributes to the morbidity and mortality of a large component of the population and twin studies provide strong evidence that genetic factors contribute substantially to the risk of developing nicotine dependence. This is the first high density, genome wide association study with the goal to identify common susceptibility or resistance gene variants for nicotine dependence.
Several novel genes were identified in this study as potential contributors to the development of nicotine dependence, such as Neurexin 1 ( NRXN1 ). There were at least two signals in NRXN1 (Table 2 ). The SNP rs10490162 is weakly correlated with the other two SNPs that were genotyped in the gene (maximum pair wise correlation is r2 = 0.45 with the other two SNPs, which were found to be in strong disequilibrium with each other). Interestingly, another neurexin gene, Neurexin 3 ( NRXN3 ), was reported as a susceptibility gene for polysubstance addiction in a pooled genome wide association study by Uhl and colleagues ( 19 ). In addition, the most significant SNP in NRXN3 in our study, rs2221299 , had a P -value of 0.0034. While there was substantially less evidence for association with NRXN3 in our study, the fact that two independent studies of substance dependence found evidence of association with neurexin genes merits further investigation.
All SNPs individually genotyped in the genes NRNX1 and VPS13A
| SNP ID | Chr a | Position | Minor allele frequency | Risk allele | P -value b | Male odds ratio (95% CI) | Female odds ratio (95% CI) |
|---|---|---|---|---|---|---|---|
| NRXN1 | |||||||
| afd1260848 | 2 | 50,088,115 | 0.0111 | T | 0.306199180 | 1.16 (0.43–3.13) | 1.91 (0.81–4.50) |
| rs1400882 | 2 | 50,371,747 | 0.4237 | G | 0.366666760 | 1.02 (0.82–1.27) | 1.13 (0.95–1.33) |
| afd743424 | 2 | 50,673,793 | 0.0285 | C | 0.339442817 | 1.5 (0.84–2.79) | 1.13 (0.68–1.88) |
| rs17040897 | 2 | 50,751,878 | 0.0010 | T | 0.435646837 | 0.0 | 2.63 (0.21–33.00) |
| rs17041112 | 2 | 51,064,107 | 0.0278 | A | 0.041036238 | 2.27 (1.04–4.95) | 1.40 (0.88–2.24) |
| afd737192 | 2 | 51,065,341 | 0.0117 | T | 0.038498276 | 3.28 (0.96–11.27) | 1.83 (0.87–3.86) |
| rs12623467 | 2 | 51,136,740 | 0.0607 | C | 0.000014776 | 2.42 (1.51–3.88) | 1.57 (1.14–2.16) |
| rs12467557 | 2 | 51,153,921 | 0.0547 | A | 0.000068795 | 2.53 (1.48–4.31) | 1.62 (1.14–2.30) |
| rs10490162 | 2 | 51,159,308 | 0.1126 | T | 0.000056606 | 1.92 (1.34–2.75) | 1.39 (1.08–1.79) |
| afd736936 | 2 | 51,173,172 | 0.0161 | C | 0.007967325 | 3.50 (1.27–9.67) | 1.79 (0.94–3.39) |
| VPS13A | |||||||
| rs10869910 | 9 | 77,053,556 | 0.1982 | T | 0.000490786 | 1.11 (0.84–1.46) | 1.48 (1.21–1.82) |
| rs2022443 | 9 | 77,099,406 | 0.2200 | G | 0.000024860 | 1.12 (0.86–1.45) | 1.57 (1.29–1.91) |
| rs7864334 | 9 | 77,134,110 | 0.4888 | C | 0.004466534 | 0.95 (0.76–1.18) | 1.31 (1.11–1.55) |
| rs11145381 | 9 | 77,144,695 | 0.2093 | C | 0.000047241 | 1.19 (0.91–1.57) | 1.54 (1.26–1.88) |
| rs17423381 | 9 | 77,147,214 | 0.0850 | G | 0.365266659 | 1.30 (0.89–1.90) | 0.96 (0.71–1.30) |
| rs12380218 | 9 | 77,165,214 | 0.2155 | G | 0.000020915 | 1.18 (0.90–1.55) | 1.56 (1.28–1.91) |
| rs11145388 | 9 | 77,179,410 | 0.1857 | T | 0.001001859 | 1.11 (0.84–1.47) | 1.47 (1.19–1.82) |
| rs11145410 | 9 | 77,241,954 | 0.1909 | A | 0.000785556 | 1.19 (9.90–1.57) | 1.45 (1.18–1.78) |
a Chromosome.
b Primary 2df P -value from the logistic regression analysis.
The neurexin gene family is a group of polymorphic cell surface proteins expressed primarily in neurons that function in cell–cell interactions and are required for normal neurotransmitter release ( 20 ). Neurexins are important factors in GABAergic and glutamatergic synapse genesis and are the only known factors reported to induce GABAergic postsynaptic differentiation. NRXN1 and NRXN3 are among the largest known human genes, and they utilize at least two promoters and alternatively spliced exons to produce thousands of distinct mRNA transcripts and protein isoforms. It is hypothesized that differential expression of neurexin isoforms by GABAergic and glutamatergic neurons contributes to the local induction of postsynaptic specialization. Because substance dependence is modeled as a relative imbalance of excitatory and inhibitory neurotransmission (or related to ‘disinhibition’) ( 21 ), the neurexin genes are plausible new candidate genes that contribute to the neurobiology of dependence through the regulated choice between excitatory or inhibitory pathways. Biological characterization of these genes may define a role of neural development or neurotransmitter release and dependence.
This study also identified a vacuolar sorting protein, VPS13A , as a potential contributor to nicotine dependence. Interestingly, three independent genetic linkage studies of smoking ( 11–13 ) identified a region on chromosome 9 near this gene. This gene appears to control the cycling of proteins through the cell membrane, and there are numerous alternative transcripts. Variants in the VPS13A gene cause progressive neurodegeneration and red cell acanthocytosis ( 22 ). Another novel gene for further study is TRPC7 (transient receptor potential canonical) channel which encodes a subunit of multimeric calcium channels ( 23 ). A recent study using animal model indicated that TRPC channels can functionally regulate nicotine-induced neuronal activity in the locomotion circuitry ( 24 ).
There are several other genes tagged by the top SNPs. An alpha catenin gene, CTNNA3 , inhibits Wnt signaling and has variants that affect the levels of plasma amyloid beta protein (Abeta42) in Alzheimer's disease families ( 25 ), though other reports fail to find an association with Alzheimer's disease ( 26 ). The CLCA1 gene encodes a calcium-activated chloride channel that may contribute to the pathogenesis of asthma ( 27 ) and chronic obstructive pulmonary disease ( 28 ). While none of these genes has a known relationship to nicotine metabolism or mechanism of action, they are involved in brain and lung function and therefore have plausible biological relationships to smoking behavior and dependence. Replication of these findings and additional biological characterization of these variants and genes may solidify these proposed links.
In addition to the novel genes implicated in the genome wide association study, a classic candidate gene, the β3 nicotinic receptor ( CHRNB3 ) is among the top group. The nicotinic receptors are a family of ligand-gated ion channels that mediate fast signal transmission at synapses. Nicotine is an agonist of these receptors that produce physiological responses.
The SNPs were tested for varying gender effects as part of the primary analytic model. Several of the top SNPs had significantly different odds ratios for men and women (Table 1 ). It is clear from epidemiological data that there are significant gender differences in the risk for the development of dependence, and this study provides evidence that separate genes may contribute to the development of nicotine dependence in men and women. Following the primary analyses, we further analyzed the top ranked SNPs to determine if there was evidence for other modes of transmission, such as recessive or dominant models. There was no evidence for improvement in the fit for either of these models for any of the SNPs in the top group.
The maximum effect size for these top associated SNPs is an odds ratio of 2.53. These estimates are likely to be overestimates of the true population values due to the ‘jackpot effect’ of many multiple comparisons. Several alternatives exist for correction of these estimates, but have not been applied to these data. The effect size estimates are consistent with multiple genes of modest effect contributing to the development of dependence.
This genome wide association study is a first step in a large-scale genetic examination of nicotine dependence. Our analytic plan was determined a priori so that we would be able to interpret the results most clearly. We purposefully chose to examine the entire sample as the primary analysis, rather than use a split sample design because we felt that this had the greatest power to detect true findings ( 29 ). Though we have evidence of true results in this study, confirmation in an independent sample is crucial.
Many other issues will need to be addressed in the future examination of these data. For example, smoking and nicotine dependence are correlated with many other disorders, such as alcohol dependence and major depressive disorder ( 30–33 ). Preliminary analyses of our sample have confirmed that this clustering of other disorders with nicotine dependence is present in our sample. In addition, nicotine dependence can be defined by other measures, such as the American Psychiatric Association criteria in the Diagnostic and Statistical Manual, Version IV (DSM-IV) ( 34 ). Previous work has shown that though different measures of nicotine dependence are correlated, there is not perfect overlap because the Fagerström Test for Nicotine Dependence (FTND) and DSM-IV definitions focus on different features of dependence ( 35 ). The FTND is a measure that focuses on physiological dependence, whereas the DSM-IV dependence includes cognitive and behavioral aspects of dependence. Different classification by FTND and DSM-IV nicotine dependence is also seen in our sample with 75% of our cases (FTND ≥4) and 24% of our controls (FTND = 0) affected with DSM-IV nicotine dependence. As we move forward with additional analyses, which will include comorbid disorders and varying definitions of nicotine dependence, we hope to explicate some of the individual features that contribute to these findings of association.
In summary, efforts to understand nicotine dependence are important so that new approaches can be developed to reduce tobacco use, especially cigarette smoking. This systematic survey of the genome nominates novel genes, such as NRXN1 , that increase an individual's risk of transitioning from smoking to nicotine dependence. The continued genetic and biological characterization of these genes will help in understanding the underlining causality of nicotine dependence and may provide novel drug development targets for smoking cessation. These variants also may be involved in addictive behavior in general. The current pharmacological treatments for nicotine dependence continue to produce only limited abstinence success, and the tailoring of medications to promote smoking cessation to an individual's genetic background may significantly increase the efficacy of treatment. Our work is part of an emerging body of knowledge that may facilitate personalized approaches in the practice of medicine through large-scale study of genetic variants. Novel targets can now be studied and hopefully will facilitate the development of improved treatment options to alleviate this major health burden and reduce smoking-related deaths.
MATERIALS AND METHODS
The purpose of this study was to identify genes contributing to the progression from smoking to the development of nicotine dependence. As a result, the study examined the phenotypic contrast between nicotine dependent subjects and individuals who smoked but never developed nicotine dependence.
Subjects
All subjects (1050 cases and 879 controls) were selected from two ongoing studies: the Collaborative Genetic Study of Nicotine Dependence, a US-based sample (St Louis, Detroit and Minneapolis), and the Nicotine Addiction Genetics study, an Australian-based, European-Ancestry sample. The US sample was recruited through telephone screening of community-based subjects to determine eligibility for recruitment as case (current FTND ≥4) or control status. Qualifying subjects were invited to participate in the genetic study. The Australian participants were enrolled at the Queensland Institute of Medical Research as families and spouses of the Australian Twin Panel.
The Institutional Review Board approved both studies, and all subjects provided informed consent to participate. Blood samples were collected from each subject for DNA analysis and submitted together with electronic phenotypic data to the NIDA Center for Genetic Studies, which manages the sharing of research data in accordance with NIH guidelines. All subjects were self-identified as being of European descent. See Table 3 for further demographic details.
Distribution of sex, age, FTND score, and recruitment site in cases and controls
| Cases ( n = 1050) | Controls ( n = 879) | |
|---|---|---|
| Sex | ||
| Males | 44.2% | 30.4% |
| Females | 55.8% | 69.6% |
| Age (years) | ||
| Mean±SD | 37.7±6.9 | 36.7±7.5 |
| Range | 25–82 | 25–82 |
| FTND | ||
| Mean±SD | 6.3±1.7 | 0 |
| Site | ||
| USA | 797 | 713 |
| Australia | 253 | 66 |
| Cases ( n = 1050) | Controls ( n = 879) | |
|---|---|---|
| Sex | ||
| Males | 44.2% | 30.4% |
| Females | 55.8% | 69.6% |
| Age (years) | ||
| Mean±SD | 37.7±6.9 | 36.7±7.5 |
| Range | 25–82 | 25–82 |
| FTND | ||
| Mean±SD | 6.3±1.7 | 0 |
| Site | ||
| USA | 797 | 713 |
| Australia | 253 | 66 |
Phenotype data
Equivalent assessments were performed at both sites. A personal interview that comprehensively assessed nicotine dependence using several different criteria such as the Fagerström Test for Nicotine Dependence ( 36 ) and the Diagnostic and Statistical Manual of Mental Disorders-IV ( 34 ) was administered.
Case definitions of nicotine dependence
The focus of this study was a case-control design of unrelated individuals for a genetic association study of nicotine dependence. Cases were defined by a commonly used definition of nicotine dependence, a FTND score of 4 or more when smoking the most (maximum score of 10) ( 36 ). No significant difference was observed in FTND score between the US and Australian samples (mean FTND: 6.43 for US and 6.06 for Australian cases).
Control definitions
Control subject status was defined as an individual who smoked (defined by smoking at least 100 cigarettes during their lifetime), yet never became dependent (lifetime FTND = 0). Historically, the threshold of smoking 100 or more cigarettes has been used in survey research as a definition of a ‘smoker’. With the selection of controls who smoked, the study focused on those genetic effects related to the transition from smoking to the development of nicotine dependence. Additional data from the Australian twin panels supports this designation of a control status. Among monozygotic twins who smoked, the rate of nicotine dependence, defined as a score of 4 or more using the Heavy Smoking Index (HSI-an abbreviated version of the FTND) ( 37 ), was lowest in those whose co-twin had an HSI score of 0; lower even than in those whose co-twin had experimented with cigarettes, but never became a smoker, or those whose co-twin had never smoked even a single cigarette (Table 4 ).
Prevalence of nicotine dependence in monozygotic twins
| Co-twin smoking history | Respondent % nicotine dependent among smokers |
|---|---|
| Never smoked | 16.67 |
| Smoked 1–2 times | 4.84 |
| Smoked 3–20 times | 4.17 |
| Smoked 21–99 times | 6.52 |
| Smoked 100 times or more, HSI = 0 | 1.63 |
| Smoked 100 times or more, HSI = 1 | 2.47 |
| Smoked 100 times or more, HSI = 2 | 4.79 |
| Smoked 100 times or more, HSI = 3 | 5.06 |
| Smoked 100 times or more, HSI = 4 | 50.78 |
| Smoked 100 times or more, HSI = 5 | 68.42 |
| Smoked 100 times or more, HSI = 6 | 72.73 |
DNA preparation
DNA was extracted from whole blood and EBV transformed cell lines and was aliquoted and stored frozen at −80°C until distributed to the genotyping labs.
Study design
To allow the efficient, rapid and cost-effective screening of over 2.4 million SNPs, we performed a whole genome association study using a two-stage design.
Stage I—pooled genotyping high-density oligonucleotide genotyping arrays
In Stage I, 482 cases and 466 control DNA samples from US and Australian subjects of European ancestry were selected for study. To examine potential population stratification, we performed a STRUCTURE analysis ( 38 ) using 295 individually genotyped SNPs. The selected SNPs were roughly evenly spaced across the autosomes and were selected for stratification analyses ( 39 ). The STRUCTURE program identifies subpopulations of individuals who are genetically similar through a Markov chain Monte Carlo sampling procedure using markers selected across the genome. There was no evidence of population admixture. Cases and controls were then placed in pools for genotyping of 2.4 million SNPs, and estimates of allele frequency differences between case and control pools were determined.
Pooled genotyping was performed using eight cases and eight control pools. DNA was quantified using Pico Green. The concentrations were normalized and verified to within a coefficient of variation of < 10%. Equimolar amounts of DNA from ∼60 individuals were placed into each of the 16 pools. An individual's sample was included in only one pool. The 16 pools were hybridized to 49 chip designs to interrogate 2 427 354 SNPs across the whole genome.
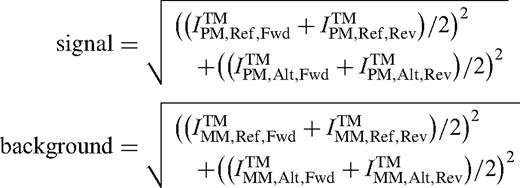
Determination of pooled allele frequency estimates
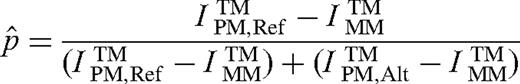
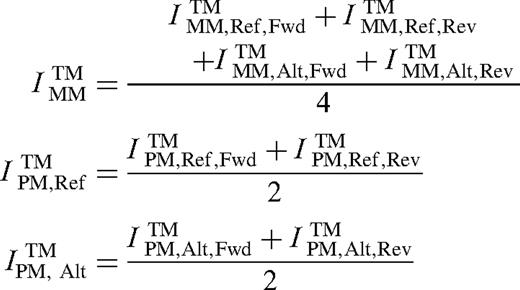
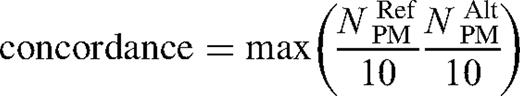
Three quality control metrics were developed to assess the reliability of the intensities for a SNP on an array scan. The first metric, concordance, evaluated the presence of a target for a SNP. The second metric, signal to background ratio, related the amount of specific and non-specific binding, estimated from the intensities of perfect match and mismatch features. The third metric tracked the number of features in each SNP tiling that had saturated intensities. Cutoffs were applied to all three metrics, and SNP feature sets that did not pass were discarded from further evaluation.
The number of saturated features was computed as the number of features that reached the highest intensity possible for the digitized numeric intensity value. SNPs with number of saturated features > 0 were discarded from further evaluations.
Stage II SNP selection
Computation of empirical P -values to evaluate each SNP's association independently
Corrected t -test P -values were computed similarly to regular t -test P -values. For testing of the difference between average case p̂ and average control p̂ , the standard error was corrected by a chip design-specific additive constant. The additive constant was obtained by minimizing the coefficient of variation of the t -tests for each chip design. This standard error additive constant ensured that SNP selection was not biased to low or high standard errors, as there was no prior evidence that SNPs with low or high standard errors were more or less likely to be associated with the phenotype. The empirical P -values were computed from ranks of the corrected t -test P -values for each chip design by dividing the rank by the total number of passing SNPs on the chip design. See Figure 4 for a distribution of standard errors.
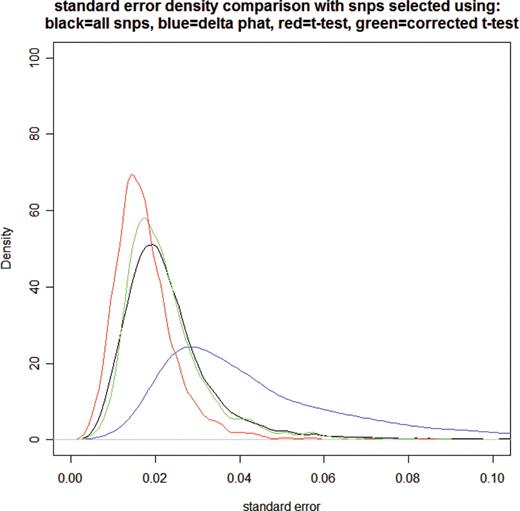
Plot of distributions of standard errors of SNPs selected using different criteria. The plot illustrates that delta p̂ cutoff selects preferentially SNPs with high standard errors of delta p̂ , regular t -test preferentially selects SNPs with low standard errors and the corrected t -test is centered on the standard error distribution from all SNPs.
SNP selection criteria
The SNPs were selected from among SNPs that had at least two passing p̂ values for cases and controls. Selected SNPs mapped onto human genome build 35 and had successfully designed assays. An empirical P -value cutoff of 0.0196 was used to select SNPs.
Stage II individual genotyping
For individual genotyping, we designed a custom array to interrogate 41 402 SNPs that included SNPs selected from the pooled genotyping (39 213) and stratification and quality control SNPs (2189). In Stage II, we performed individual genotyping on the original case and control samples and additional case and control subjects of European descent, for a final sample size of 1929 individuals (1050 cases and 879 controls).
Individual genotypes were determined by clustering all SNP scans in the two-dimensional space defined by reference and alternate perfect match trimmed mean intensities. Trimmed mean intensities were computed as described above in section ‘Determination of Pooled Allele Frequency Estimates’. The genotype clustering procedure was an iterative algorithm developed as a combination of K-means and constrained multiple linear regressions. The K-means at each step reevaluated the cluster membership representing distinct diploid genotypes. The multiple linear regressions minimized the variance in p̂ within each cluster while optimizing the regression lines' common intersect. The common intersect defined a measure of common background that was used to adjust the allele frequencies for the next step of K-means. The K-means and multiple linear regression steps were iterated until the cluster membership and background estimates converged. The best number of clusters was selected by maximizing the total likelihood over the possible cluster counts of 1, 2 and 3 (representing the combinations of the three possible diploid genotypes). The total likelihood was composed of data likelihood and model likelihood. The data likelihood was determined using a normal mixture model for the distribution of p̂ around the cluster means. The model likelihood was calculated using a prior distribution of expected cluster positions, resulting in optimal p̂ positions of 0.8 for the homozygous reference cluster, 0.5 for the heterozygous cluster and 0.2 for the homozygous alternate cluster.
A genotyping quality metric was compiled for each genotype from 15 input metrics that described the quality of the SNP and the genotype. The genotyping quality metric correlated with a probability of having a discordant call between the Perlegen platform and outside genotyping platforms (i.e. non-Perlegen HapMap project genotypes). A system of 10 bootstrap aggregated regression trees was trained using an independent data set of concordance data between Perlegen genotypes and HapMap project genotypes. The trained predictor was then used to predict the genotyping quality for each of the genotypes in this data set.
Hardy–Weinberg equilibrium
Hardy–Weinberg equilibrium (HWE) was tested separately for cases and controls. SNPs that did not follow HWE at a level of P -value < 10 −15 in either cases or controls were discarded. There were 859 and 797 autosomal SNPs excluded because of this extreme disequilibrium in cases and controls, respectively, and 765 of these SNPs were common to both groups. This level of deviation from HWE indicates issues with SNP genotyping and clustering. Because association with the phenotype can result in SNPs not being in HWE, SNPs with HWE P -values between 10 −4 and 10 −15 were visually inspected, and where problems with clustering were detected, the SNP was discarded from further analysis. This results in 31 960 SNPs available for analysis.
Population stratification
In order to avoid false positive results due to cryptic population stratification in the larger sample, we repeated a STRUCTURE analysis in the expanded sample of 1929 subjects ( 38 ) using genotype data for 289 well performing SNPs ( 39 ). This again revealed no evidence of population admixture. In addition, the non-inflated Q–Q plot of test statistics in the Stage II only samples (Fig. 5 ) indicates a lack of population admixture correlated with case control status.
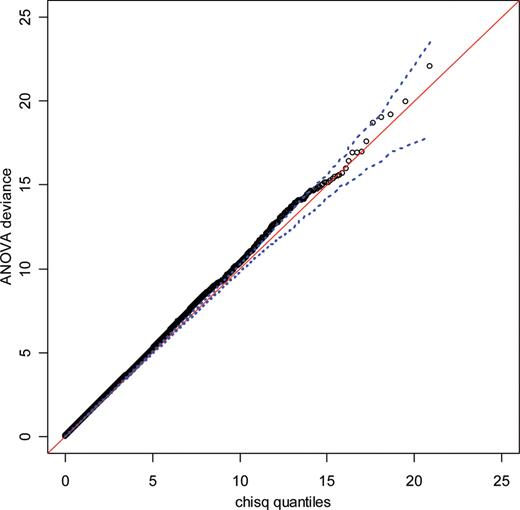
Q–Q plot of logistic regression ANOVA deviance produced from samples added to Stage I samples at Stage II. Because these samples are independent of Stage I samples used for the SNP selection from pooled genotyping the test statistic is expected to largely follow the null distribution (Chi-square distribution with two degrees of freedom). Due to the lower power of this sample set compared to the combined set of samples and the small effect sizes found in this study, any possible associations are not expected to cluster together at low P -values, thereby changing the linear shape of this Q–Q plot. The dotted line represents 95% point-wise confidence envelope of expected null distribution.
Covariate analysis
The covariates available for individuals were sex, age, site (USA or Australia) and sample (first or second). Prior to performing genetic analyses, inspection of the data indicated that the covariates of gender and recruitment site were important predictors of case and control status and were used as covariates in the logistic regression model.
Genetic association
We developed an a priori analytic strategy so that we could then interpret our results and avoid issues of multiple testing from using varying methods of analysis. We chose to examine the total sample of 1929 individuals in the primary analysis because this had the greatest power to detect true findings ( 29 ). For our primary single SNP association analyses, we used logistic regression to incorporate the significant covariates sex and site (USA and Australia), and tested the effect of genotype together with a genotype-by-sex interaction term using a standard likelihood-ratio χ2 statistic with two degrees of freedom. This approach allowed us to detect SNPs having gender-specific effects as well as SNPs with similar effects in males and females. For these primary analyses, we coded genotype according to the number of ‘risk’ alleles (0, 1 or 2) where the risk allele was defined to be the allele having higher frequency in cases than in controls. This coding was additive on the log scale and thus corresponded to a multiplicative genetic model. The full model was compared to a reduced model including gender and recruitment site only, and significance was assessed by a χ2 test with two degrees of freedom. The resulting P -values were used to rank the SNPs.
Following these primary analyses, we further analyzed the top ranked SNPs to determine if there was significant evidence for alternative modes of transmission such as dominant or recessive models.
ACKNOWLEDGEMENTS
The authors wish to acknowledge the contributions of advisors to this project. The NIDA Genetics Consortium, with Jonathan Pollock, and NICSNP committees were vital to the success of the research. The Data Analysis Committee helped oversee analyses for the genome wide association studies and investigated methodological issues in association analyses. Further, the committee assisted in data management and data sharing functions. In addition to the authors, committee members included Andrew Bergen, Gerald Dunn, Mary Jeanne Kreek, Huijun Ring, Lei Yu and Hongyu Zhao. At Perlegen Sciences, we would like to acknowledge the work of Laura Stuve, Curtis Kautzer, the genotyping laboratory, Laura Kamigaki, the sample group, and John Blanchard, Geoff Nilsen, and the bioinformatics and data quality groups for excellent technical and infrastructural support for this work performed under NIDA Contract HHSN271200477471C. This work is supported by NIH grants CA89392 from the National Cancer Institute, DA12854 and DA015129 from the National Institute on Drug Abuse, and the contract N01DA-0-7079 from NIDA. We are greatly appreciative for the assistance in manuscript preparation from Sherri Fisher. In memory of Theodore Reich, founding Principal Investigator of COGEND; we are indebted to his leadership in the establishment of COGEND, and acknowledge his seminal scientific contributions to the field.
Data Access: Phenotypes and genotypes are available through the NIDA Genetics Consortium to the scientific community at the time of publication (http://nidagenetics.org).
Conflict of Interest statement . Dennis G. Ballinger and Karel Konvicka are employed by Perlegen Sciences, Inc. With the exception of D. Ballinger and K. Konvicka, none of the authors or their immediate families are currently involved with, or have been involved with, any companies, trade associations, unions, litigants or other groups with a direct financial interest in the subject matter or materials discussed in this manuscript in the past five years.
