
Nilotinib Effects in Parkinson’s disease and Dementia with Lewy bodies
Abstract
Background: We evaluated the effects of low doses of the tyrosine kinase Abelson (Abl) inhibitor Nilotinib, on safety and pharmacokinetics in Parkinson’s disease dementia or dementia with Lewy bodies.
Objectives: The primary outcomes of this study were safety and tolerability; pharmacokinetics and target engagement were secondary, while clinical outcomes were exploratory.
Methods: Twelve subjects were randomized into 150 mg (n = 5) or 300 mg (n = 7) groups and received Nilotinib orally every day for 24 weeks.
Results: This study shows that 150 mg and 300 mg doses of Nilotinib appear to be safe and tolerated in subjects with advanced Parkinson’s disease. Nilotinib is detectable in the cerebrospinal fluid (CSF) and seems to engage the target Abl. Motor and cognitive outcomes suggest a possible beneficial effect on clinical outcomes. The CSF levels of homovanillic acid are significantly increased between baseline and 24 weeks of treatment. Exploratory CSF biomarkers were measured.
Conclusions: This small proof-of-concept study lacks a placebo group and participants were not homogenous, resulting in baseline differences between and within groups. This limits the interpretations of the biomarker and clinical data, and any conclusions should be drawn cautiously. Nonetheless, the collective observations suggest that it is warranted to evaluate the safety and efficacy of Nilotinib in larger randomized, double-blind, placebo-controlled trials.
INTRODUCTION
Parkinson’s disease (PD) is the second most common neurodegenerative disorder that causes motor and non-motor symptoms. PD is characterized by loss of dopamine (DA)-producing neurons in the substantia nigra (SN) pars compacta and formation of intracellular inclusions known as Lewy bodies (LBs) that primarily contain aggregated α-synuclein. Evidence suggests that autophagy is impaired in neurodegenerative disorders, including PD [1–8]; leading to accumulation and propagation of misfolded α-synuclein and SN neuronal degeneration. A major challenge is to develop a therapy that can halt loss of DA neurons in SN and alleviate progressive motor and non-motor symptoms.
Nilotinib (Tasigna®, AMN107, Novartis, Switzerland) is a Break point cluster (BCR)-Abl (Abelson) tyrosine kinase inhibitor approved by the U.S. FDA for adults with chronic myeloid leukemia (CML) at oral doses of 600–800 mg daily [9–11]. Tyrosine kinase inhibitors induce autophagy [12–14] to destroy rapidly dividing tumor cells in CML [12]. We previously demonstrated that a low dose of Nilotinib (1–10 mg/kg daily) penetrates the blood brain barrier (BBB) and degrades misfolded α-synuclein via autophagy [13, 15–17]. Nilotinib also increases DA levels and improves motor and cognitive outcomes in PD and Alzheimer’s disease models [13, 14, 18–20]. In preclinical studies, Nilotinib enters the brain and inhibits Abl, leading to reduction of oxidative stress and protection of DA neurons [13, 21–24]. The rationale behind this study is based on extensive preclinical laboratory findings [12–14, 19–22]. We administered late-stage PD and DLB patients doses of Nilotinib that are commercially available and substantially lower (150 mg or 300 mg daily) than those used in oncology (600–800 mg daily). Based on preclinical studies we hypothesized that Nilotinib would enter the brain and inhibit Abl in PD and DLB patients.
We conducted a pilot open label proof-of-concept study to evaluate the safety and tolerability of Nilotinib in participants with advanced PD with dementia (PDD) or dementia with Lewy bodies (DLB). Our primary objective is to demonstrate that low oral daily doses of 150 mg or 300 mg Nilotinib (compared to 600–800 mg in cancer) are safe and tolerated. Our secondary objectives are to assess whether orally administered Nilotinib crosses the BBB and inhibits CSF Abl. Based on preclinical data we also hypothesized that Nilotinib will increase DA levels. Motor and cognitive functions were also measured as exploratory clinical outcomes. Other exploratory outcomes are that Nilotinib may alter PD-related CSF biomarkers DJ-1 and α-synuclein. As most participants in this study had dementia we also explored the effects of Nilotinib on AD-related CSF biomarkers, including Aβ40 and Aβ42, total tau and phosphorylated tau (p-tau).
METHODS AND MATERIALS
Study design
Twelve PDD or DLB participants with parkinsonian Hoehn and Yahr stage 3–5 were randomized into 150 mg (n = 5) or 300 mg (n = 7) groups and received oral daily doses of Nilotinib for 24 weeks with 12 weeks follow up (Fig. 1). Diagnosis of PD was according to the UK Brain Bank Diagnostic Criteria. Diagnostic criteria for probable DLB included the presence of dementia and at least two of three other symptoms, including fluctuating attention and concentration, visual hallucinations and parkinsonian motor signs. Participants were stable on L-Dopa treatment and other PD medications for four weeks prior to study enrollment as indicated in Table 1. Participants on stable treatment (>4 weeks) with monoamine oxidase (MAO)-B inhibitor Selegeline up to 10 mg/day or Rasagiline up to 1 mg/day were enrolled. Montreal Cognitive Assessment (MoCA) in the range of 18–26 was used at screening to determine cognitive impairment (MCI), moderate dementia (17–10) and severe dementia (<10) in PD and DLB patients, respectively. This is the first clinical study to examine the effects of the cancer drug Nilotinib in the PD population. We selected PDD or DLB patients to evaluate safety and tolerability in this population and excluded co-morbidities including myocardial, hematological and hepatic abnormalities, resulting in a high number of screen failures. PDD or DLB participants who were enrolled also had cognitive symptoms, and this was not an exclusion criterion as our preclinical data suggest that Nilotinib may improve cognitive performance in animal models.
The primary objective was to determine the safety and tolerability of daily Nilotinib for 6 months. Electrocardiograms (EKGs), physical and neurological exams and blood draws for laboratory chemistry were performed every two weeks for the first two months, and every month thereafter. Patients with cardiovascular disease, myocardial infarcts, QTc interval >450 ms and those who are on drugs that prolong QTc or taking exclusionary medications (i.e. coumadin) were not enrolled. Thirty patients were screened and twelve were enrolled and most screen failures were subjects who had QTc>450 ms. The secondary objectives were to determine whether Nilotinib crosses the BBB and whether it affects phosphorylation of Abl in CSF samples. Nilotinib concentration was measured in plasma and CSF at baseline (before treatment) at two months (interim) and six months treatment. Pharmacodynamic analyses were performed to determine target engagement via measurement of CSF phosphorylated Abl. Other exploratory markers associated with neurodegeneration, including CSF α-synuclein, DJ-1, DA metabolite HVA, total tau and p-tau181, Aβ42 and Aβ40, Neuron Specific Enolase (NSE) and glial and neuronal marker S100B were also measured. Tertiary/exploratory clinical outcomes included measurement of motor and non-motor symptoms using Unified Parkinson’s Disease Rating Scale (UPDRS) I-IV. Nilotinib effects on progression of dementia were evaluated using the Mini Mental State Examination (MMSE) and Scales for Outcomes in Parkinson’s disease-Cognition (SCOPA-Cog). The Columbia Suicide Severity Rating Scale (CSSRS) was performed at every visit.
Screening and enrollment
Participants and study partners were consented prior to any study-related procedures. Demographics, concurrent medications, and medical history were gathered from the participant and study partner (Table 1). Patients who could not give consent were consented by a legally authorized representative. Vital signs were recorded with comprehensive physical and neurological examinations. Randomization was performed via an internet based randomization module and subjects were assigned to one of the 2 treatment groups. The chance for randomization to the groups was 1:1 for 150 mg:300 mg Nilotinib.
Safety monitoring
Physical and neurological exams and EKGs were performed with laboratory blood chemistry, including total cholesterol, low density lipoprotein (LDL), high density lipoprotein (HDL), triglyceride, phosphate, total bilirubin, calcium, chloride, sodium, potassium, magnesium, lipase, α-amylase, alanine aminotransferase (ALT) and aspartate aminotransferase (AST). A standard hematology panel included complete blood count with differential for white blood cells (WBC), hemoglobin, hematocrit and platelets.
Baseline
This visit was scheduled 2–4 weeks after screening and results from all screening procedures were reviewed for inclusion/exclusion criteria. CSF was collected via lumbar puncture and blood draws were performed for biomarker measurements. Blood biomarker samples were collected 30 minutes before CSF collection. Vital signs, brief physical and neurological examination along with documentation of concurrent medications and reviewed AEs were performed at every visit.
Plasma and CSF collection
Blood draw (15 ml) and lumbar puncture (∼15 ml CSF) were performed on all patients at baseline, 2 and 6-months treatment. Collection was obtained at 1, 2, 3, 4 or 5 hrs after Nilotinib administration by mouth. Plasma was isolated immediately after blood draw and aliquoted and stored at –80°C. CSF was aliquoted and stored at –80°C. Freeze/thaw cycles were avoided. To avoid CSF contamination with blood, the first 1 mL of CSF collection was discarded and all samples were centrifuged at 1000 g for 15 minutes. Samples that contained >25 ng/ml Hemoglobin were eliminated and were not tested for biomarkers. The hemoglobin levels in CSF samples were measured using human hemoglobin ELISA Quantitation (Cat # E80-136) Kit (Bethyl Lab Inc, Montgomery, TX, USA) according to the manufacturer’s instructions.
Mass spectrometry to evaluate Nilotinib pharmacokinetics
Plasma and CSF samples (20 μl) were thawed initially on ice at room temperature and transferred to Eppendorf tubes containing 100 μl of water. Extraction solvent (500 μl) Acetonitrile/Methanol (50:50) containing the internal standard (5 ng/mL of Nilotinib_13C_2H3) was added to the sample. The mixture was vortexed and incubated for 20 min on ice to accelerate protein precipitation and dialysis through 25 μm membranes was performed to obtain unbound Nilotinib. After incubation, the samples were vortexed and centrifuged at 13,000 rpm for 20 min at 4°C. The supernatant containing unbound Nilotinib was freeze-dried using speed vacuum and reconstituted in 200 μL of Methanol: Water (50:50) and processed by mass spectrometry.
The samples were resolved on an Acquity UPLC BEH C18 1.7 μm, 2.1×50 mm column online with a triple quadrupole mass spectrometer (Xevo-TQ-S, Waters Corporation, USA) operating in the multiple reaction monitoring (MRM) mode. The instrument parameters were optimized to gain maximum specificity and sensitivity of ionization for the parent [m/z = 530.27 (Nilotinib), 438.25 and daughter ions [m/z = 289.01 (Nilotinib) using “IntelliStart” feature of MassLynx software (Waters Corporation, USA). The metabolite ratios were calculated by normalizing the peak area of endogenous metabolites within tissue samples normalized to the internal standard Nilotinib_13C_2H3.
Phospho-Abl (pan-tyrosine) enzyme-linked immunosorbent assay (ELISA)
PathScan® pan-tyrosine phospho-Abl solid phase sandwich ELISA was performed on the same CSF and plasma samples that were used for Nilotinib measurement in CSF. Abl rabbit antibody was coated on the microwells and 100 μl CSF or plasma was incubated for 2 hrs at 37°C. Bcr-Abl and Abl protein (phospho and nonphospho) were captured by the coated antibody. All samples at baseline, 2 months and 6 months were analyzed side-by-side using same reagents. After washing, a pan-tyrosine phosphorylated Abl detection antibody was added to each well to detect captured tyrosine-phosphorylated Bcr-Abl and Abl protein. Samples were incubated with detection antibody for 1 hr at 37°C. After washing, anti-mouse IgG, horseradish peroxidase (HRP)-linked antibody was added and incubated for 10 min at 37°C to recognize the bound detection antibody. The magnitude of the absorbance for developed color is proportional to the quantity of tyrosine-phosphorylated Bcr-Abl and Abl protein in the samples.
α-synuclein measurement
Solid phase α-synuclein sandwich ELISA (Cat#SIG38974, Biolegend) was performed on CSF and plasma. To avoid freeze-thaw cycles, immediately after LP and blood draws, 15 mL CSF and 5 mL plasma were aliquoted on ice into 0.5 mL tubes and stored at –80°C. Fresh aliquots were used to perform ELISA. All samples at baseline, 2 months and 6 months were analyzed side-by-side using same reagents. Total α-synuclein rabbit monoclonal antibody (amino acids 118–123) was coated on the microwells and 200 μl CSF or plasma was added to designated wells. CSF samples were diluted 1:10 while plasma samples were diluted 1:50. After overnight sample incubation at 4°C, α-synuclein was captured by the coated antibody. After washing, a biotinylated mouse monoclonal α-synuclein (amino acids 103–107) detection antibody was added to each well to detect the captured α-synuclein (amino acids 118–123). Samples were incubated with 50 μl of detection antibody for 2 hrs at room temperature. After washing, 200 μl of streptavidin HRP was added and incubated for 1 hr at room temperature to recognize the bound biotinylated detection antibody. Samples were then washed and incubated with 100 μl of chemiluminescent substrates. Plates were shaken for 10–15 seconds and read immediately by a luminometer.
HVA measurement
A 100 μl CSF and plasma samples were incubated with 100 μl HRP-conjugate reagent and incubated for 1 hr at 37°C using solid phase sandwich ELISA (MyBioSource, Cat# MBS064661). All samples at baseline, 2 months and 6 months were analyzed side-by-side using same reagents. After washing, 50 μl of chromogen solution A and 50 μl of chromogen solution B were added to the solution and incubated for 15 min at 37°C. The reaction was stopped with 50 μl stop solution and the optical density was read at 450 nM. The magnitude of the absorbance is proportional to the quantity of CSF HVA.
Human neurodegenerative disease magnetic bead panels
A multiplex Xmap technology that uses magnetic microspheres internally coded with two fluorescent dyes was used to measure markers of neurodegeneration. All samples at baseline, 2 months and 6 months were analyzed side-by-side using same reagents. Through precise combinations of these two dyes, multiple proteins are measured within the sample. Each of these spheres is coated with a specific capture antibody. The capture antibody binds to the detection antibody and a reporter molecule, completing the reaction on the surface of the bead. 25 μL of CSF or plasma was incubated overnight at 4°C with 25 μL of a mixed bead solution, containing human NSE and DJ-1 (Millipore, Cat#: HND1MAG-39K) or S100B, total tau, p-tau181, Aβ42, and Aβ40 (CSF Aβ40 is diluted 1:10). After washing, samples were incubated with 25 μL detection antibody solution for 1.5 hrs at room temperature (Millipore, CAT#: HND4MAG-36K), 25 μL of Streptavidin-Phycoerythrin was added to each well containing the 25 μl of detection antibody solution. Samples were then washed and suspended in 100 μl of sheath fluid. Samples were then run on MAGPIX with Xponent software. The Median Fluorescent Intensity (MFI) data was analyzed using a 5- parameter logistic or spline curve-fitting method for calculating analyte concentrations in samples.
Statistical data analysis
Data are summarized as raw values, range as appropriate, and mean±SD for n = 5 in 150 mg group and n = 7 in 300 mg group, unless otherwise indicated. All graphs and statistical analyses were performed in Graph Pad Prism Software version 5.01 (Graph Pad Prism Software, Inc. CA. USA). To account for large differences between groups at baseline, all estimates used for means and SD were based on mean of relative changes- not the mean value changes. As each group has less than 10 subjects and the normality of biomarkers is unclear, non-parametric tests such as Wilcoxon signed test and Mann-Whitney test were performed to compare between baseline, two and six months treatment with Nilotinib for both 150 mg and 300 mg treatment groups for biomarkers. As non-parametric tests may be underpowered, a two tailed paired t-test was also used to examine differences between baseline and six months treatment with Nilotinib for both 150 mg and 300 mg treatment groups for biomarkers and clinical outcomes. The significance level was adjusted using the Bonferroni correction. The sample size n and p-values from each test are indicated in each table or figure. No comparison is made in this pilot study between 150 mg and 300 mg due to large baseline differences and randomization of most DLB patients into the 150 mg group and PDD patients into 300 mg group.
Study approvals
The protocol was approved by the Institutional Review Board (IRB #2014-0006) at Georgetown University Medical Center as well as by Georgetown-Howard Universities Center for Clinical and Translational Science (GHUCCTS) scientific review board. This study was performed in consultation with the FDA. The study was listed on clinicaltrials.gov (NCT02281474). All participants were recruited from the movement disorders clinic at MedStar Georgetown University Hospital and were consented at the GHUCCTS Clinical Research Unit (CRU). Eligible participants were computer randomized to either 150 mg or 300 mg groups and enrolled in the study. Patients were de-identified and a Pad-Id was included (e.g. NIL) in the patient’s clinical chart. An independent safety and monitoring board (DSMB) that included a cardiologist, hematologist, clinical pharmacologist, neurologist and biostatistician monitored safety signals in patients in the study.
RESULTS
Screening, enrollment and retention
Thirty participants were screened and twelve PDD or DLB participants (Table 1) were randomized into 150 mg (n = 5) or 300 mg (n = 7) groups and received oral daily doses of Nilotinib for 24 weeks with an additional 12 weeks follow up (Fig. 1). Eighteen patients failed screening due to cardiovascular disease, infarcts, QTc interval >450 ms or excluded medications (i.e. Coumadin). One patient (NIL 9) was withdrawn from the study due to serious adverse events (SAEs) and another (NIL 8) discontinued at 5 months due to increased caregiver burden. Ten patients completed the 24-week study and returned for a follow up visit (week 36). One patient (NIL 12) did not follow up at week 36.
Serious Adverse Events (SAEs)
Adverse Events (AEs) that required or resulted in hospitalization were classified as an SAE and were listed in Supplementary Table 1. One participant in the 300 mg Nilotinib group (NIL 9) was withdrawn at week 4 and diagnosed with myocardial infarct and left bundle block. One participant in the 300 mg Nilotinib group was hospitalized with urinary tract infection (UTI) and one participant in the 150 mg group was hospitalized with pneumonia and UTI (Supplementary Table 1).
Non-serious AEs
Non-serious AEs, which did not require hospitalization were classified per system and/or preferred term and summarized in Supplementary Table 2 as number of events and number of affected participants in each group. One participant in the 150 mg group and one in the 300 mg Nilotinib group had transient QTc prolongation >450 ms but returned to a normal QTc range in subsequent visits (detailed in Supplementary Table 3). Participants in the 150 mg group reported three UTIs, two cases of pneumonia, one cold virus, one mild back pain, one mild headache, one mild dysgraphia, one mild left foot drag, one mild confusion, one mild hallucination, one mild paranoia, one mild agitation, one moderate anxiety, one mild incontinence, one moderate itching and one skin irritation. Participants in the 300 mg group reported one incident of blurry vision, one diarrhea, one nausea, one mild fatigue, two generalized weakness, three UTIs, one pneumonia, one weight loss, one tooth extraction, one dizziness, two mild hallucinations, one mild paranoia, one mild crying episode, one mild urinary urgency, one mild cough and one eczematous lesion.
QTc prolongation
One participant (NIL 9) in the 300 mg was withdrawn due to moderate cardiac ischemia and myocardial infarct and was double-stented for a left bundle block (Supplementary Table 3) and this was classified as an SAE in Table 2. NIL 8 had slight QTc prolongation >450 ms at week 8, and NIL 15 had two episodes of QTc prolongation >450 ms at week 2 and week 8 but QTc returned to normal range in subsequent visits. NIL 8 withdrew from the study at week 24 due to increased caregiver burden, but returned for follow up (week 36) and NIL 12 did not return for follow up at week 36.
Blood chemistry
Laboratory tests (Supplementary Table 4) were performed throughout eleven visits according to protocol. Laboratory results of some participants were outside the normal range at baseline (less than 100% (<1 fold) difference from baseline) due to comorbidities that were not exclusionary. A total of three AEs below normal range of alanine aminotransferase (ALT) level (<100%) were observed in the 150 mg Nilotinib group. Two AEs above normal range (>100%), including one ALT and one bilirubin elevation were observed in the 150 mg Nilotinib group. Two AEs with transient increase of ALT and one AST above normal range (>100%) were observed in the 300 mg Nilotinib group but returned to normal by end of the study.
Nilotinib pharmacokinetics
Blood and CSF were collected from twelve participants at baseline prior to treatment (n = 12, control) and at 2 months treatment (n = 12). Blood and CSF were collected from nine patients at six months (n = 9) of Nilotinib treatment (total n = 33 samples) and collection time via lumbar puncture (LP) was staggered at 0, 1, 2, 3, 4 or 5 hrs after oral administration of Nilotinib. Blood was collected 30 min prior to LP. Two CSF samples were not tested because they had >25 ng/ml hemoglobin. Pharmacokinetic analysis demonstrated that Nilotinib (Fig. 2A and E) peaked in the plasma 2 hrs (Tmax) after dosing at 55 nM and 86 nM (Cmax) in the 150 mg and 300 mg Nilotinib groups, respectively. Nilotinib (Fig. 2B and E) also peaked in the CSF 2 hrs (Tmax) after dosing at 5 nM and 11 nM (Cmax) in the 150 mg and 300 mg groups, respectively. Area under the curve (AUC) was 157 and 232 ng/ml*h for plasma and 8 and 14 ng/ml*h for CSF in 150 mg and 300 mg groups, respectively. Nilotinib was quantified in reference to 13C Nilotinib standard and samples were precipitated and dialyzed to obtain unbound Nilotinib. Nilotinib was not detected in the CSF (t1/2 ∼1.8) 3 hrs after dosing suggesting short bioavailability of unbound or free Nilotinib compared to plasma t1/2 = 12.4 (Fig. 2E). The CSF:plasma ratio of Nilotinib (Fig. 2C) is 12% and 5% with 300 mg and 150 mg Nilotinib, respectively.
Target engagement
To demonstrate whether Nilotinib inhibits Abl via de-phosphorylation, we measured pan-tyrosine CSF Abl relative to total Abl via ELISA. Phosphorylated Abl was reduced (30%) with 150 mg and 300 mg Nilotinib (Fig. 2D), suggesting that Nilotinib may inhibit CNS Abl phosphorylation. The absorbance level of Abl phosphorylation in the CSF was maximal (100%) at baseline prior to Nilotinib administration (Fig. 2F and G). However, pan-tyrosine Abl absorbance levels were reduced in all patients in the 150 mg group (Fig. 2F) and 300 mg groups(Fig. 2G).
Unified Parkinson Disease Rating Scale (UPDRS)
Motor symptoms were monitored with UPDRS at all clinic visits (Table 2). The UPDRS scores were obtained at 1–4 hrs after oral dosing with Nilotinib in each participant. An average decrease of 3.4 points and 3.6 points in UPDRS-III (motor) was observed at six months (week 24) compared to baseline with 150 mg and 300 mg Nilotinib, respectively. These effects were reversed at the 36-week follow up visit in all participants. An average decrease of 7 points and 11.1 points in UPRDS I-IV was also observed at 6 months in the 150 mg and 300 mg groups, respectively. The change in UPDRS was progressive throughout the 6 months (24-week) trial, and was reversed in participants in the follow up visit at 36 weeks. Most participants experienced increased psychotic symptoms (hallucination, paranoia, agitation) and some dyskinesia whilst on Nilotinib suggesting an increase in CNS DA levels, which required lowering or discontinuation of monoamine oxidase (MAO)-B inhibitor, Azilect or Rasagiline(Table 1).
Mini Mental Status Examination (MMSE)
Cognitive performance was monitored with MMSE at all clinic visits (Table 3). An average increase of 3.85 and 3.5 points in MMSE was observed at six months (24-week) compared to baseline with 150 mg and 300 mg Nilotinib, respectively. The increase in MMSE scores was incremental during the 24-week treatment, and returned to baseline at the 36-week follow up visit. The Scales for Outcomes in Parkinson’s Disease-Cognition (SCOPA-Cog) test also show an average increase of 1.85 and 2 points at six months compared to baseline with 150 mg and 300 mg Nilotinib, respectively.
PD-related biomarkers
Because of the small sample size (n < 10), normal distribution is uncertain, thus a non-parametric Wilcoxon signed and Mann-Whitney tests were performed to compare biomarker changes between baseline and two and six months treatment with 150 mg and 300 mg Nilotinib. However, as non-parametric tests may be underpowered, a two tailed paired t-test was also used to examine differences between groups at baseline and after Nilotinib treatment. CSF homovanillic acid (HVA), a DA metabolite, was significantly increased (Supplementary Table 5) in the 150 mg group at 2 months (t-test) and remained elevated (non-significant) at 6 months compared to baseline. CSF HVA also significantly increased in the 300 mg group at 6 months compared to baseline (Supplementary Table 5). Abl activation as well as DJ-1 are up-regulated in response to oxidative stress [25–27] but CSF DJ-1 trended towards a decrease in the 150 mg group, and was significantly reduced in the 300 mg group at six months compared to baseline and at 2 months compared to 6 months (Supplementary Table 5).
CSF α-synuclein (Supplementary Table 5) was slightly reduced at 2 and 6 months compared to baseline in the 150 mg Nilotinib group, but the level of α-synuclein was significantly (t-test) lower at 2 months compared to 6 months. However, α-synuclein (Supplementary Table 5) was unaltered in the 300 mg Nilotinib group between baseline, 2 and 6 months. Data from the Parkinson’s Progression Markers Initiative (PPMI) suggest that CSF α-synuclein does not change over six months in de novo or mid-stage PD. However, the slight decrease in CSF α-synuclein in the 150 mg Nilotinib group over six months in the current PDD and DLB cohort suggests that a placebo group is needed to interpret the data definitively. Plasma α-synuclein was slightly reduced at 2 months compared to baseline in the 150 mg group (Supplementary Figure 1A) but at 6 months it became significantly higher compared to 2 months. Interestingly, plasma levels of α-synuclein in some subjects were elevated 3 months after termination of treatment. Similarly, plasma α-synuclein was significantly reduced at 2 months compared to baseline in the 300 mg group (Supplementary Figure 1B) but returned to baseline at 6 months. Plasma levels of α-synuclein in some subjects were elevated 3 months after termination of treatment. Taken together these data suggest that Nilotinib may stabilize α-synuclein levels in PD, but a larger sample with a placebo group is needed to interpret theseresults.
Surrogate biomarkers
CSF S100B is a marker of glial death in the brain [28, 29] and neuron specific enolase (NSE) is elevated after stroke and brain trauma [30, 31], suggesting cell death. The level of S100B was gradually reduced in the 150 mg and 300 mg groups. However, NSE level was significantly reduced at 6 months compared to baseline in the CSF in both 150 mg and 300 mg groups (Supplementary Table 5). CSF total tau and p-tau are increased in PD and DLB compared to control [32–34]. Total tau and the ratio of total tau/p-tau 181 were significantly reduced at 2 months compared to baseline in the 150 mg group, while total tau was significantly reduced at 6 months compared to baseline in the 300 mg group. No changes in CSF Aβ40 or Aβ42 were detected in 150 mg group, but CSF Aβ40 was significantly reduced at 6 months compared to baseline in the 300 mg Nilotinib group.
DISCUSSION
Collectively, these data suggest that once daily oral administration of 150 mg or 300 mg Nilotinib may be safe and tolerated in subjects with PDD or DLB. A number of AEs were observed but they are not unexpected in this patient population. The SAE recorded in one patient (NIL 9) is due to subclinical myocardial abnormalities that were not detected by EKG at screening; the subject was subsequently diagnosed with left bundle block and T wave changes that required stenting, suggesting that caution must be used with Nilotinib treatment. Eleven study participants reported more frequent bowel movements, supporting anecdotal evidence that Nilotinib may affect constipation.
In this study we show that Nilotinib may enter the CSF and that it may inhibit CNS Abl. These findings are consistent with our preclinical studies, which showed that Nilotinib enters the brain and inhibits Abl, leading to protection of DA neurons [13, 21, 22]. Our data suggest that higher doses of Nilotinib may result in higher concentrations of the drug in the CSF, but the ratio of CSF:plasma is higher with 150 mg compared to 300 mg Nilotinib, leading to similar levels of CSF Abl inhibition. The observed differences in CSF:plasma ratio of Nilotinib is perhaps due to the role of the ATP-binding cassette (ABC) transporters, which facilitate Nilotinib efflux at the BBB [35]. Additionally, Nilotinib peaks at 2 hrs after oral dosing in the CSF and the level of p-Abl is reduced by 30% at 1 hr and remains at this level for several hours after Nilotinib washes out. Nilotinib in the CSF is unbound, whereas Nilotinib protein binding capacity in plasma is 98% and plasma protein binding is irreversible. Therefore, it is possible that the difference between the CSF concentration of free Nilotinib and CSF p-Abl over time is due to Nilotinib binding in brain parenchyma, leading to Abl inhibition and reduction of CSF p-Abl.
Abl activation induces misfolded protein pathology and oxidative stress in PD animal models and Abl inhibition with Nilotinib reduces oxidative stress [13, 21, 22, 24]. These findings are consistent with our results, which show a significant decrease of the PD-related oxidative stress sensor DJ-1 [25, 26] during Nilotinib treatment. Although the role of DJ-1 is not well understood in PD, Abl as well as DJ-1 are up-regulated in response to oxidative stress [25–27] and the reduction in CSF level of DJ-1of Nilotinib treatment suggests a decrease in oxidative stress. Additionally, CSF S100B and NSE have not been well studied in PD, but they are well established CSF biomarkers of neuronal and glial death in several neurological diseases marked by cell loss and oxidative tissue damage, including stroke, trauma and inflammation [28–31].
Candidate CSF biomarkers for PD include DA and its metabolites. CSF HVA is the end product of DA metabolism, which is reduced in PD [36, 37], reflecting diminution of central DA stores. CSF HVA levels were significantly increased at 2 months and this increase was sustained at 6 months after Nilotinib treatment compared to baseline. CSF HVA levels increased despite discontinuation of the MAO-B inhibitor, Azilect (Rasagiline), which was discontinued as a result of increased psychosis in the first 2–4 weeks after Nilotinib administration. These data suggest that caution must be used in late stage PD with Nilotinib. Some participants who were on high daily dose of levodopa, including Nil 8 (stage 5), Nil 11 (stage 3), Nil 3 (stage 3), and Nil 2 (stage 3) had their levodopa reduced by 100 mg, 250 mg, 125 mg and 450 mg, respectively. No other medications were changed throughout the study period. These data support a possible role for Nilotinib in increasing DA levels, in agreement with preclinical findings that Nilotinib protects DA neurons and increases both DA and HVA in MPTP (1-methyl-4-phenyl-1,2,3,6-tetrahydropyridine) and α-synucleinopathy models of PD [13, 19, 21]. The increase in DA may be due to one or more of several potential mechanisms. Firstly, preclinical evidence shows that autophagic clearance of α-synuclein in SN neurons increases DA levels possibly via greater DA synthesis [13]. Secondly, Parkin activation inhibits MAO-B and attenuates DA breakdown, leading to an increase in DA levels in vitro; and our previous studies indicate that Nilotinib inhibits astrocytes, which modulate MAO-B activity [16]. The current results are also consistent with the effect of Nilotinib on increasing Parkin activity in-vivo and in-vitro [13, 19]. Finally, DA may also be derived from non-nigral neurons in ventral tegmental area (VTA) that are part of the mesolimbic dopaminergic system.
In PD, the CSF concentrations of α-synuclein are reduced compared to healthy controls [32, 39–41] and the level of CSF α-synuclein is even lower in patients with more advanced α-synucleinopathies [40]. Several studies suggest that reduction of CSF α-synuclein is associated with an accumulation of misfolded α-synuclein in CNS Lewy bodies [42–44]. Therefore, a drug that may increase or stabilize CSF α-synuclein levels is desirable as it may reflect attenuation of α-synuclein accumulation in the brain. We previously demonstrated that Nilotinib penetrates the BBB and promotes autophagic degradation ofα-synuclein in PD models [13, 14, 18, 19, 35]. In the current study, the absence of a placebo group makes the CSF α-synuclein data difficult to interpret. Similarly, previous reports also suggest that CSF Aβ42 is decreased, while CSF total tau and p-tau are increased in PD and DLB compared to control [32–34]. CSF Aβ40, Aβ42, total tau and p-tau are biomarkers of AD and they were measured as exploratory outcomes in this cohort. CSF tau and Aβ40 were reduced after Nilotinib treatment in agreement with preclinical data demonstrating autophagic clearance of these proteins in animal models of neurodegeneration [13, 14, 18, 19, 35]. Aβ and tau pathologies are also frequently found in the CNS of PD patients and they may be associated with the development of cognitive impairment in PDD and DLB [45–48].
Participants in the Nilotinib trial experienced incremental improvement in motor and non-motor UPDRS I-IV scores, which were decreased, and motor symptoms declined after the end of treatment back to baseline, suggesting a possible beneficial clinical effect. L-Dopa replacement therapies are effective for symptomatic motor management and may worsen non-motor symptoms, including psychosis. Although these clinical outcomes were observed in the absence of a placebo group and blinding procedures, the incremental improvement in both motor and cognitive outcomes provides rationale for a follow-on study. The decrease in UPDRS I-IV suggests improvement at six months compared to baseline. In both PDD and DLB patients, MMSE and SCOPA-Cog progressively improved (3.85 points and 2 points, respectively). However, we cannot rule out placebo effects or learning effects in the absence of a placebo group. The apparent motor and cognitive outcomes may be attributable to increased DA levels. Specifically, motor and cognitive skills may be affected by the increase of DA that ameliorates motor impairment and may affect cognition via mesolimbic signaling to pre-frontal cortex.
In conclusion, this is the first study to treat subjects with advanced PD with a tyrosine kinase inhibitor. The present results tentatively suggest that low doses of Nilotinib are relatively safe in subjects with advanced PD or DLB, supporting that further clinical trials are performed. However, the study was conducted only in a small cohort of patients over 24 weeks and, therefore, any conclusions based on the present results should be made with great caution. Our data also suggest that nilotinib may enter the CSF and that it appears to engage its target Abl. We also obtained preliminary evidence of changes in DA metabolism in the CSF following treatment with nilotinib. However, the participants did not constitute a homogenous cohort, and there were large baseline differences in DA metabolite levels, making a definitive interpretation of these results difficult. Taken together, the data suggest that it is warranted to move forward with clinical trials to determine an appropriate therapeutic dose and evaluate Nilotinib effects in larger, randomized, double-blinded, placebo-controlled trials.
AUTHOR CONTRIBUTIONS
F. P led the clinical study and is the designated Principal Investigator, M. H performed and analyzed biomarkers, E. H. V and Y. T-Y performed clinical exams, X. H performed biomarkers work, R. R. M and B. M, W performed clinical exam, H. H Outreach Nurse Coordinator, C. Dunn and A. C clinical trial coordinators, A. L and S. L. and R (D). F performed clinical exams, J. A Biostatistician, Z. L analyzed data, C. M is designated Co-Principal Investigator who designed and supervised the trial, analyzed the data and wrote the manuscript.
DISCLOSURE
Dr. Charbel Moussa is listed as an inventor on a Georgetown University intellectual property patent application to use Nilotinib and other tyrosine kinase inhibitors for the treatment of neurodegenerative diseases.
ACKNOWLEDGMENTS
This work was supported in part by philanthropy, the Langer Family Charitable Association and Federal funds (Grant #UL1TR0000101 previously UL1RR031975) from the National Center for Advancing Translational Sciences (NCATS), National Institutes of Health (NIH), through the Clinical and Translational Science Awards Program (CTSA), a trademark of DHHS, part of Roadmap Initiative, “Re-Engineering the Clinical Research Enterprise”.
Appendices
The supplementary table is available in the electronic version of this article: http://dx.doi.org/10.3233/JPD-160867.
REFERENCES
[1] | Boland B , Kumar A , Lee S , Platt FM , Wegiel J , Yu WH , & Nixon RA ((2008) ) Autophagy induction and autophagosome clearance in neurons: Relationship to autophagic pathology in Alzheimer’s disease. J Neurosci 28: , 6926–6937. |
[2] | Kegel KB , Kim M , Sapp E , McIntyre C , Castano JG , Aronin N , & DiFiglia M ((2000) ) Huntingtin expression stimulates endosomal-lysosomal activity, endosome tubulation, and autophagy. J Neurosci 20: , 7268–7278. |
[3] | Nixon RA , Wegiel J , Kumar A , Yu WH , Peterhoff C , Cataldo A , & Cuervo AM ((2005) ) Extensive involvement of autophagy in Alzheimer disease: An immuno-electron microscopy study. J Neuropathol Exp Neurol 64: , 113–122. |
[4] | Ravikumar B , Duden R , & Rubinsztein DC ((2002) ) Aggregate-prone proteins with polyglutamine and polyalanine expansions are degraded by autophagy. Hum Mol Genet 11: , 1107–1117. |
[5] | Sabatini DM ((2006) ) mTOR and cancer: Insights into a complex relationship. Nat Rev Cancer 6: , 729–734. |
[6] | Stefanis L , Larsen KE , Rideout HJ , Sulzer D , & Greene LA ((2001) ) Expression of A53T mutant but not wild-type alpha-synuclein in PC12 cells induces alterations of the ubiquitin-dependent degradation system, loss of dopamine release, and autophagic cell death. J Neurosci 21: , 9549–9560. |
[7] | Webb JL , Ravikumar B , Atkins J , Skepper JN , & Rubinsztein DC ((2003) ) Alpha-Synuclein is degraded by both autophagy and the proteasome. J Biol Chem 278: , 25009–25013. |
[8] | Nixon RA ((2013) ) The role of autophagy in neurodegenerative disease. Nat Med 19: , 983–997. |
[9] | Deremer DL , Ustun C , & Natarajan K ((2008) ) Nilotinib: A second-generation tyrosine kinase inhibitor for the treatment of chronic myelogenous leukemia. Clin Ther 30: , 1956–1975. |
[10] | Skorski T ((2011) ) BCR-ABL1 kinase: Hunting an elusive target with new weapons. Chem Biol 18: , 1352–1353. |
[11] | Mahon FX , Hayette S , Lagarde V , Belloc F , Turcq B , Nicolini F , Belanger C , Manley PW , Leroy C , Etienne G , Roche S , & Pasquet JM ((2008) ) Evidence that resistance to nilotinib may be due to BCR-ABL, Pgp, or Src kinase overexpression. Cancer Res 68: , 9809–9816. |
[12] | Salomoni P , & Calabretta B ((2009) ) Targeted therapies and autophagy: New insights from chronic myeloid leukemia. Autophagy 5: , 1050–1051. |
[13] | Hebron ML , Lonskaya I , & Moussa CE ((2013) ) Nilotinib reverses loss of dopamine neurons and improves motor behavior via autophagic degradation of alpha-synuclein in Parkinson’s disease models. Hum Mol Genet 22: , 3315–3328. |
[14] | Lonskaya I , Hebron ML , Desforges NM , Franjie A , & Moussa CE ((2013) ) Tyrosine kinase inhibition increases functional parkin-Beclin-1 interaction and enhances amyloid clearance and cognitive performance. EMBO Mol Med 5: , 1247–1262. |
[15] | Hebron ML , Lonskaya I , Sharpe K , Weerasinghe PP , Algarzae NK , Shekoyan AR , & Moussa CE ((2013) ) Parkin ubiquitinates Tar-DNA binding protein-43 (TDP-43) and promotes its cytosolic accumulation via interaction with histone deacetylase 6 (HDAC6). J Biol Chem 288: , 4103–4115. |
[16] | Hebron ML , Lonskaya I , Olopade P , Selby ST , Pagan F , & Moussa CE ((2014) ) Tyrosine Kinase Inhibition Regulates Early Systemic Immune Changes and Modulates the Neuroimmune Response in alpha-Synucleinopathy. J Clin Cell Immunol 5: , 259. |
[17] | Lonskaya I , Hebron M , Desforges NM , Schachter JB , & Moussa CE ((2014) ) Nilotinib-induced autophagic changes increase endogenous parkin level and ubiquitination, leading to amyloid clearance. J Mol Med 92: , 373–386. |
[18] | Lonskaya I , Desforges NM , Hebron ML , & Moussa CE ((2013) ) Ubiquitination increases parkin activity to promote autophagic alpha-synuclein clearance. e. PLoS One 8: , 83914. |
[19] | Lonskaya I , Hebron ML , Desforges NM , Schachter JB , & Moussa CE ((2014) ) Nilotinib-induced autophagic changes increase endogenous parkin level and ubiquitination, leading to amyloid clearance. J Mol Med (Berl) 92: , 373–386. |
[20] | Lonskaya I , Hebron M , Chen W , Schachter J , & Moussa C ((2014) ) Tau deletion impairs intracellular beta-amyloid-42 clearance and leads to more extracellular plaque deposition in gene transfer models. Mol Neurodegener 9: , 46. |
[21] | Karuppagounder SS , Brahmachari S , Lee Y , Dawson VL , Dawson TM , & Ko HS ((2014) ) The c-Abl inhibitor, nilotinib, protects dopaminergic neurons in a preclinical animal model of Parkinson’s disease. Sci Rep 4: , 4874. |
[22] | Mahul-Mellier AL , Fauvet B , Gysbers A , Dikiy I , Oueslati A , Georgeon S , Lamontanara AJ , Bisquertt A , Eliezer D , Masliah E , Halliday G , Hantschel O , & Lashuel HA ((2014) ) c-Abl phosphorylates alpha-synuclein and regulates its degradation: Implication for alpha-synuclein clearance and contribution to the pathogenesis of Parkinson’s disease. Hum Mol Genet 23: , 2858–2879. |
[23] | Ko HS , Lee Y , Shin JH , Karuppagounder SS , Gadad BS , Koleske AJ , Pletnikova O , Troncoso JC , Dawson VL , & Dawson TM ((2010) ) Phosphorylation by the c-Abl protein tyrosine kinase inhibits parkin’s ubiquitination and protective function. Proc Natl Acad Sci U S A 107: , 16691–16696. |
[24] | Imam SZ , Zhou Q , Yamamoto A , Valente AJ , Ali SF , Bains M , Roberts JL , Kahle PJ , Clark RA , & Li S ((2011) ) Novel regulation of parkin function through c-Abl-mediated tyrosine phosphorylation: Implications for Parkinson’s disease. J Neurosci 31: , 157–163. |
[25] | Lev N , Ickowicz D , Melamed E , & Offen D ((2008) ) Oxidative insults induce DJ-1 upregulation and redistribution: Implications for neuroprotection. Neurotoxicology 29: , 397–405. |
[26] | Taira T , Saito Y , Niki T , Iguchi-Ariga SM , Takahashi K , & Ariga H ((2004) ) DJ-1 has a role in antioxidative stress to prevent cell death. EMBO Rep 5: , 213–218. |
[27] | Wang JY ((2014) ) The capable ABL: What is its biological function? Mol Cell Biol 34: , 1188–1197. |
[28] | Petzold A , Groves M , Leis AA , Scaravilli F , & Stokic DS ((2010) ) Neuronal and glial cerebrospinal fluid protein biomarkers are elevated after West Nile virus infection. Muscle Nerve 41: , 42–49. |
[29] | Petzold A , Michel P , Stock M , & Schluep M ((2008) ) Glial and axonal body fluid biomarkers are related to infarct volume, severity, and outcome. J Stroke Cerebrovasc Dis 17: , 196–203. |
[30] | Jauch EC , Lindsell C , Broderick J , Fagan SC , Tilley BC , Levine SR , & Group Nr-PSS ((2006) ) Association of serial biochemical markers with acute ischemic stroke: The National Institute of Neurological Disorders and Stroke recombinant tissue plasminogen activator Stroke Study. Stroke 37: , 2508–2513. |
[31] | Persson L , Hardemark HG , Gustafsson J , Rundstrom G , Mendel-Hartvig I , Esscher T , & Pahlman S ((1987) ) S-100 protein and neuron-specific enolase in cerebrospinal fluid and serum: Markers of cell damage in human central nervous system. Stroke 18: , 911–918. |
[32] | Mollenhauer B , Locascio JJ , Schulz-Schaeffer W , Sixel-Doring F , Trenkwalder C , & Schlossmacher MG ((2011) ) alpha-Synuclein and tau concentrations in cerebrospinal fluid of patients presenting with parkinsonism: A cohort study. Lancet Neurol 10: , 230–240. |
[33] | Parnetti L , Chiasserini D , Bellomo G , Giannandrea D , De Carlo C , Qureshi MM , Ardah MT , Varghese S , Bonanni L , Borroni B , Tambasco N , Eusebi P , Rossi A , Onofrj M , Padovani A , Calabresi P , & El-Agnaf O ((2011) ) Cerebrospinal fluid Tau/alpha-synuclein ratio in Parkinson’s disease and degenerative dementias. Mov Disord 26: , 1428–1435. |
[34] | Tateno F , Sakakibara R , Kawai T , Kishi M , & Murano T ((2012) ) Alpha-synuclein in the cerebrospinal fluid differentiates synucleinopathies (Parkinson Disease, dementia with Lewy bodies, multiple system atrophy) from Alzheimer disease.. Alzheimer Dis Assoc Disord 26: , 213–216. |
[35] | Bakhsheshian J , Wei BR , Chang KE , Shukla S , Ambudkar SV , Simpson RM , Gottesman MM , & Hall MD ((2013) ) Bioluminescent imaging of drug efflux at the blood-brain barrier mediated by the transporter ABCG2. Proc Natl Acad SciU S A 110: , 20801–20806. |
[36] | Zubenko GS , Marquis JK , Volicer L , Direnfeld LK , Langlais PJ , & Nixon RA ((1986) ) Cerebrospinal fluid levels of angiotensin-converting enzyme, acetylcholinesterase, and dopamine metabolites in dementia associated with Alzheimer’s disease and Parkinson’s disease: A correlative study. Biol Psychiatry 21: , 1365–1381. |
[37] | Goldstein DS , Holmes C , & Sharabi Y ((2012) ) Cerebrospinal fluid biomarkers of central catecholamine deficiency in Parkinson’s disease and other synucleinopathies. Brain 135: , 1900–1913. |
[38] | Ren Y , Jiang H , Ma D , Nakaso K , & Feng J ((2011) ) Parkin degrades estrogen-related receptors to limit the expression of monoamine oxidases. Hum Mol Genet 20: , 1074–1083. |
[39] | Mollenhauer B , Trautmann E , Otte B , Ng J , Spreer A , Lange P , Sixel-Doring F , Hakimi M , Vonsattel JP , Nussbaum R , Trenkwalder C , & Schlossmacher MG ((2012) ) alpha-Synuclein in human cerebrospinal fluid is principally derived from neurons of the central nervous system. J Neural Transm 119: , 739–746. |
[40] | Mollenhauer B , Cullen V , Kahn I , Krastins B , Outeiro TF , Pepivani I , Ng J , Schulz-Schaeffer W , Kretzschmar HA , McLean PJ , Trenkwalder C , Sarracino DA , Vonsattel JP , Locascio JJ , El-Agnaf OM , & Schlossmacher MG ((2008) ) Direct quantification of CSF alpha-synuclein by ELISA and first cross-sectional study in patients with neurodegeneration. Exp Neurol 213: , 315–325. |
[41] | Mollenhauer B , Trautmann E , Taylor P , Manninger P , Sixel-Doring F , Ebentheuer J , Trenkwalder C , & Schlossmacher MG ((2013) ) Total CSF alpha-synuclein is lower in de novo Parkinson patients than in healthy subjects. Neurosci Lett 532: , 44–48. |
[42] | Hong Z , Shi M , Chung KA , Quinn JF , Peskind ER , Galasko D , Jankovic J , Zabetian CP , Leverenz JB , Baird G , Montine TJ , Hancock AM , Hwang H , Pan C , Bradner J , Kang UJ , Jensen PH , & Zhang J ((2010) ) DJ-1 and alpha-synuclein in human cerebrospinal fluid as biomarkers of Parkinson’s disease. Brain 133: , 713–726. |
[43] | Ohrfelt A , Grognet P , Andreasen N , Wallin A , Vanmechelen E , Blennow K , & Zetterberg H ((2009) ) Cerebrospinal fluid alpha-synuclein in neurodegenerative disorders-a marker of synapse loss? Neurosci Lett 450: , 332–335. |
[44] | Kasuga K , Tokutake T , Ishikawa A , Uchiyama T , Tokuda T , Onodera O , Nishizawa M , & Ikeuchi T ((2010) ) Differential levels of alpha-synuclein, beta-amyloid42 and tau in CSF between patients with dementia with Lewy bodies and Alzheimer’s disease. J Neurol Neurosurg Psychiatry 81: , 608–610. |
[45] | Lleo A , Cavedo E , Parnetti L , Vanderstichele H , Herukka SK , Andreasen N , Ghidoni R , Lewczuk P , Jeromin A , Winblad B , Tsolaki M , Mroczko B , Visser PJ , Santana I , Svenningsson P , Blennow K , Aarsland D , Molinuevo JL , Zetterberg H , & Mollenhauer B ((2015) ) Cerebrospinal fluid biomarkers in trials for Alzheimer and Parkinson diseases. Nat Rev Neurol 11: , 41–55. |
[46] | Mollenhauer B , Bibl M , Wiltfang J , Steinacker P , Ciesielczyk B , Neubert K , Trenkwalder C , & Otto M ((2006) ) Total tau protein, phosphorylated tau (181p) protein, beta-amyloid(1-42), and beta-amyloid(1-40) in cerebrospinal fluid of patients with dementia with Lewy bodies. Clin Chem Lab Med 44: , 192–195. |
[47] | Parnetti L , Tiraboschi P , Lanari A , Peducci M , Padiglioni C , D’Amore C , Pierguidi L , Tambasco N , Rossi A , & Calabresi P ((2008) ) Cerebrospinal fluid biomarkers in Parkinson’s disease with dementia and dementia with Lewy bodies. Biol Psychiatry 64: , 850–855. |
[48] | Kang JH , Irwin DJ , Chen-Plotkin AS , Siderowf A , Caspell C , Coffey CS , Waligorska T , Taylor P , Pan S , Frasier M , Marek K , Kieburtz K , Jennings D , Simuni T , Tanner CM , Singleton A , Toga AW , Chowdhury S , Mollenhauer B , Trojanowski JQ , Shaw LM , & Parkinson’s Progression Markers I ((2013) ) Association of cerebrospinal fluid beta-amyloid 1-42, T-tau, P-tau181, and alpha-synuclein levels with clinical features of drug-naive patients with early Parkinson disease. JAMA Neurol 70: , 1277–1287. |
Figures and Tables
Fig.1
Design and milestones of an open-label, phase I clinical trial to evaluate the safety and efficacy of 150 mg and 300 mg Nilotinib for 24 weeks in patients with Parkinson’s disease (PD) with dementia (PDD) or PD with mild cognitive impairment (PD-MCI) or dementia with Lewy bodies (DLB). Cerebrospinal fluid (CSF), Mini Mental State Examination (MMSE), Abelson (Abl), homovanillic acid (HVA), β-amyloid (Aβ), Scales for Outcomes in Parkinson’s Disease-Cognition (SCOPA-Cog), Neuron Specific Enolase (SNE).
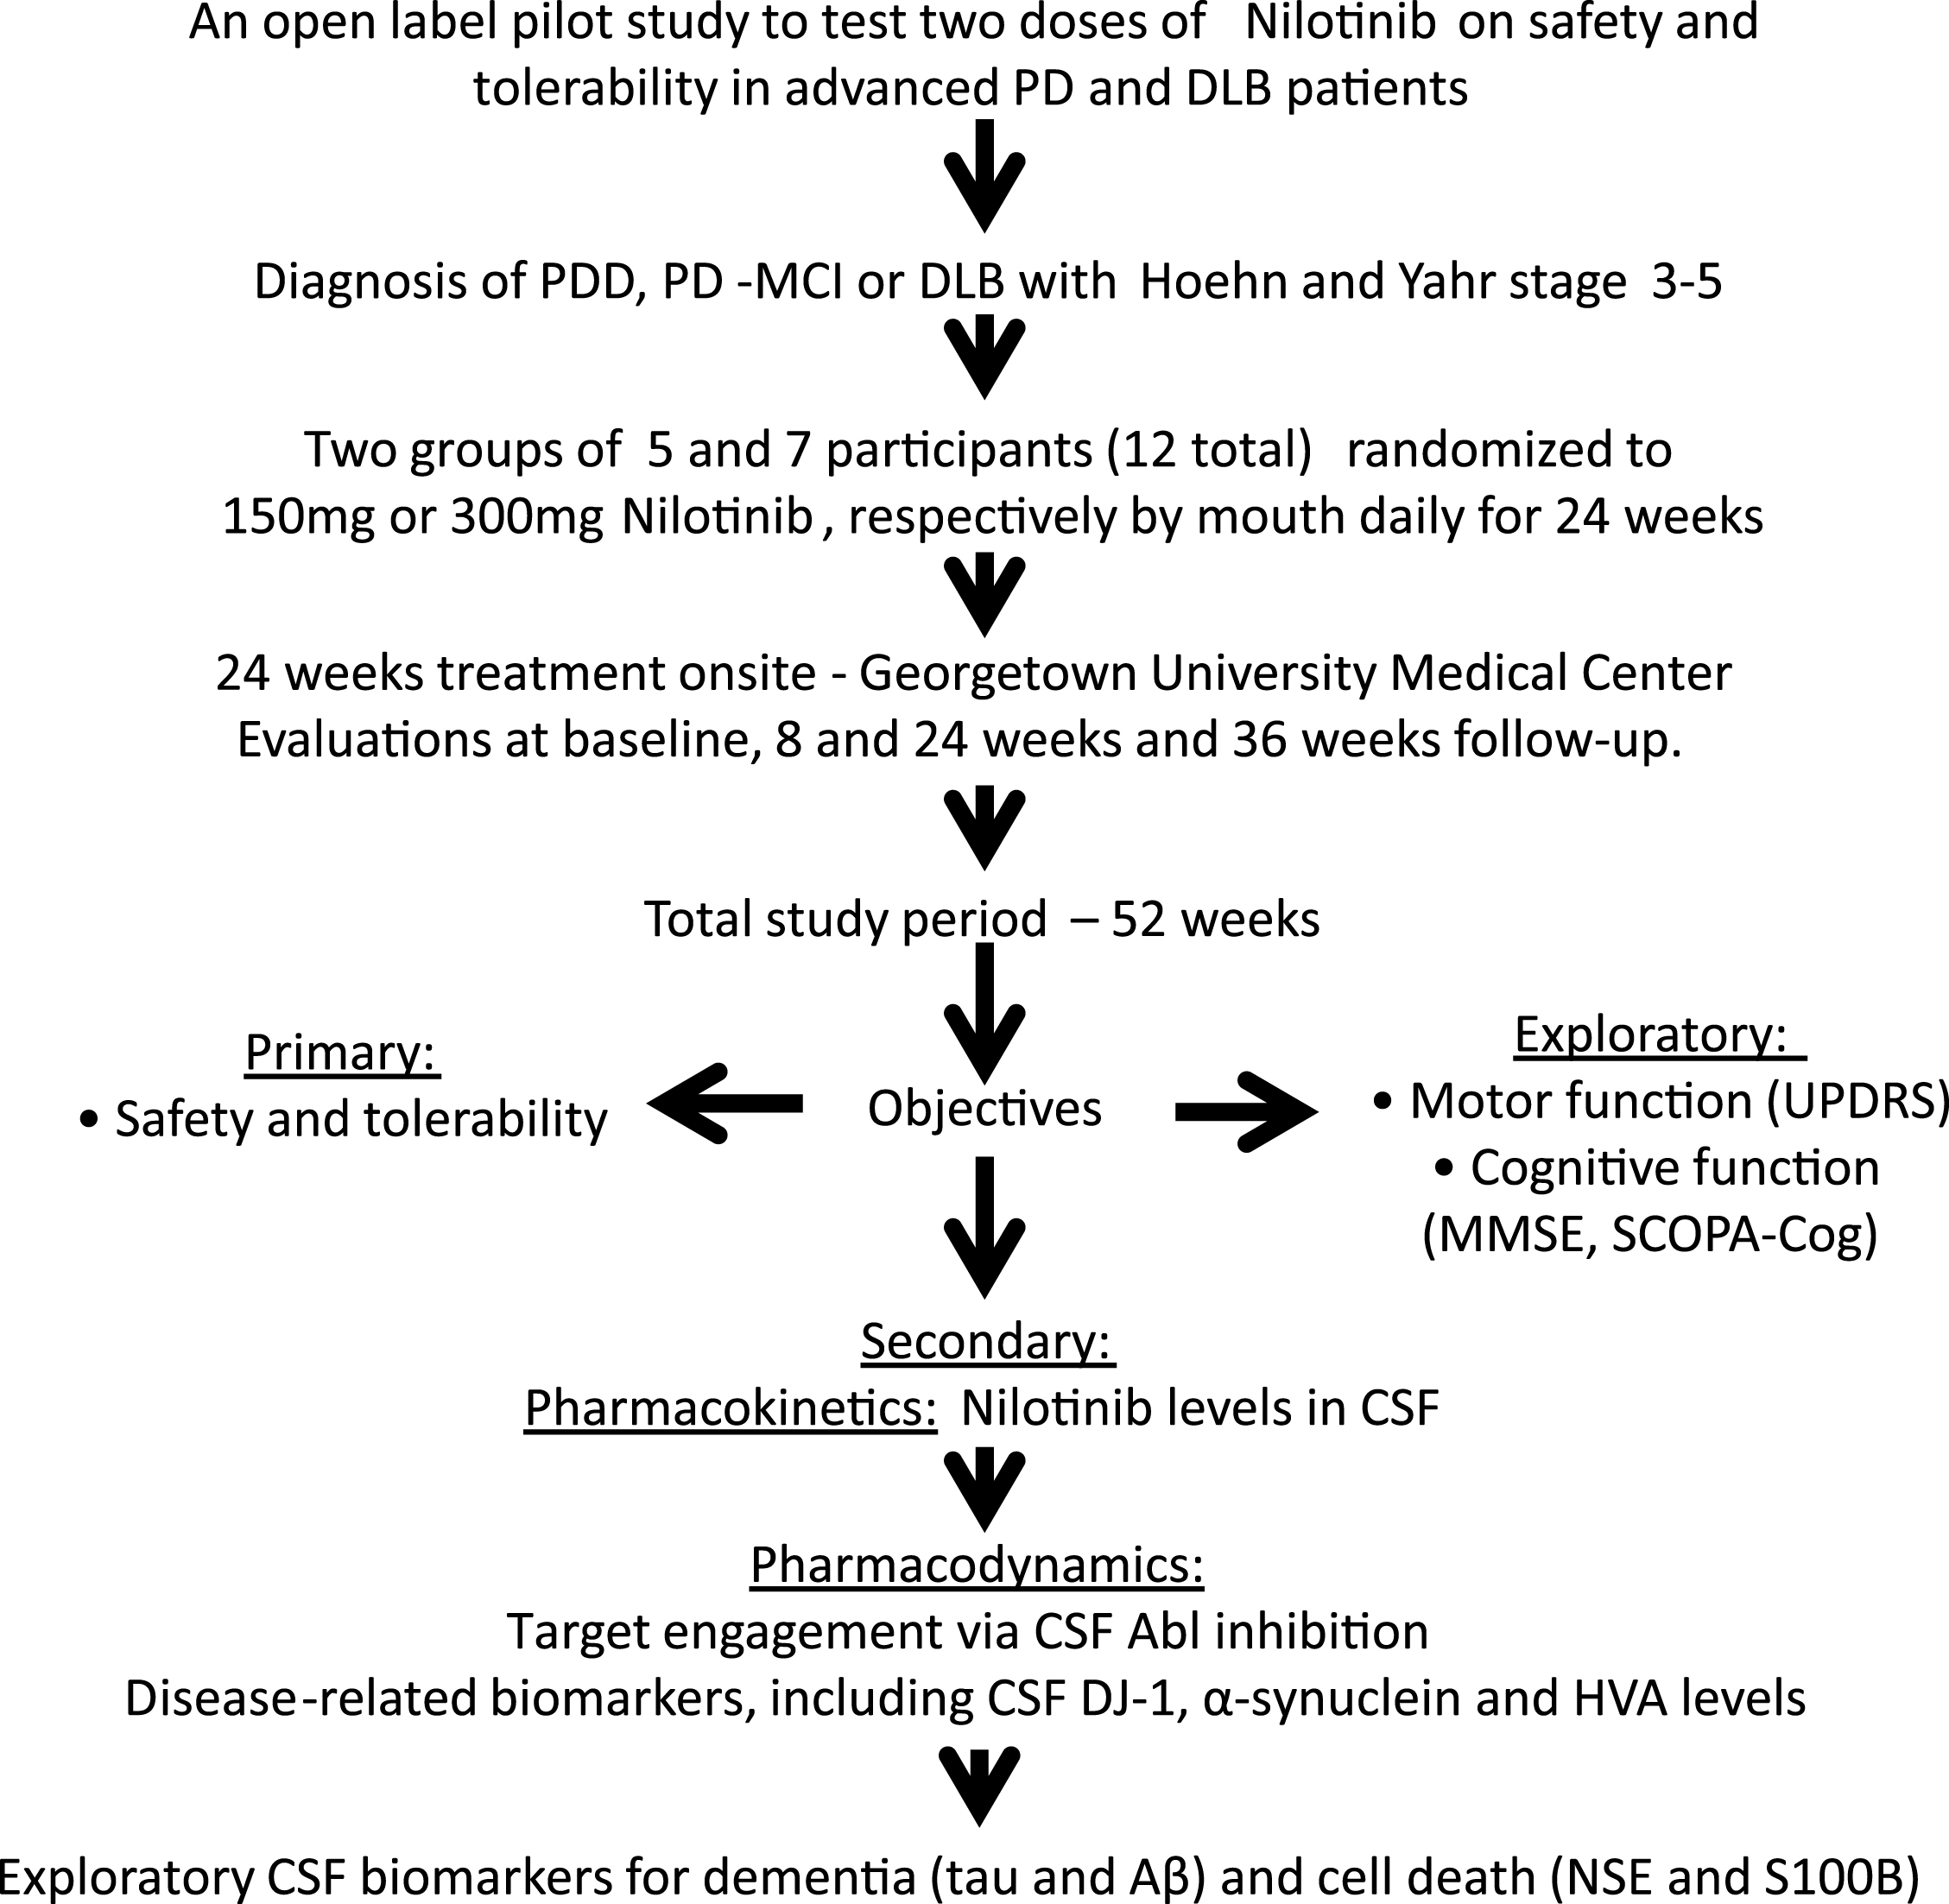
Fig.2
Pharmacokinetics and pharmacodynamics. Graph shows Nilotinib levels in (A) plasma, (B) CSF and (C) ratio of CSF: plasma of Nilotinib in a population analysis (N = 33 data points) collected at baseline, 1, 2, 3, 4 or 5hrs after oral administration. Plasma was collected 30 min before CSF. Graph (D) is level of Abl inhibition via de-phosphorylation in the same sample population showing the level of pan-tyrosine phosphorylated Abl (active) in the CSF. (E) is non-compartmental analysis of 150 mg and 300 mg of CSF and plasma Nilotinib. Nilotinib was quantified in reference to 13C Nilotinib standard and biological samples were centrifuged to obtain unbound Nilotinib. Cerebrospinal fluid (CSF), Abelson (Abl). Graph shows absorbance levels (ABS) of pan-tyrosine phosphorylated Abl in the CSF of individual participants at baseline and after oral dosing of Nilotinib in the 150 mg (F) and 300 mg (G) groups.
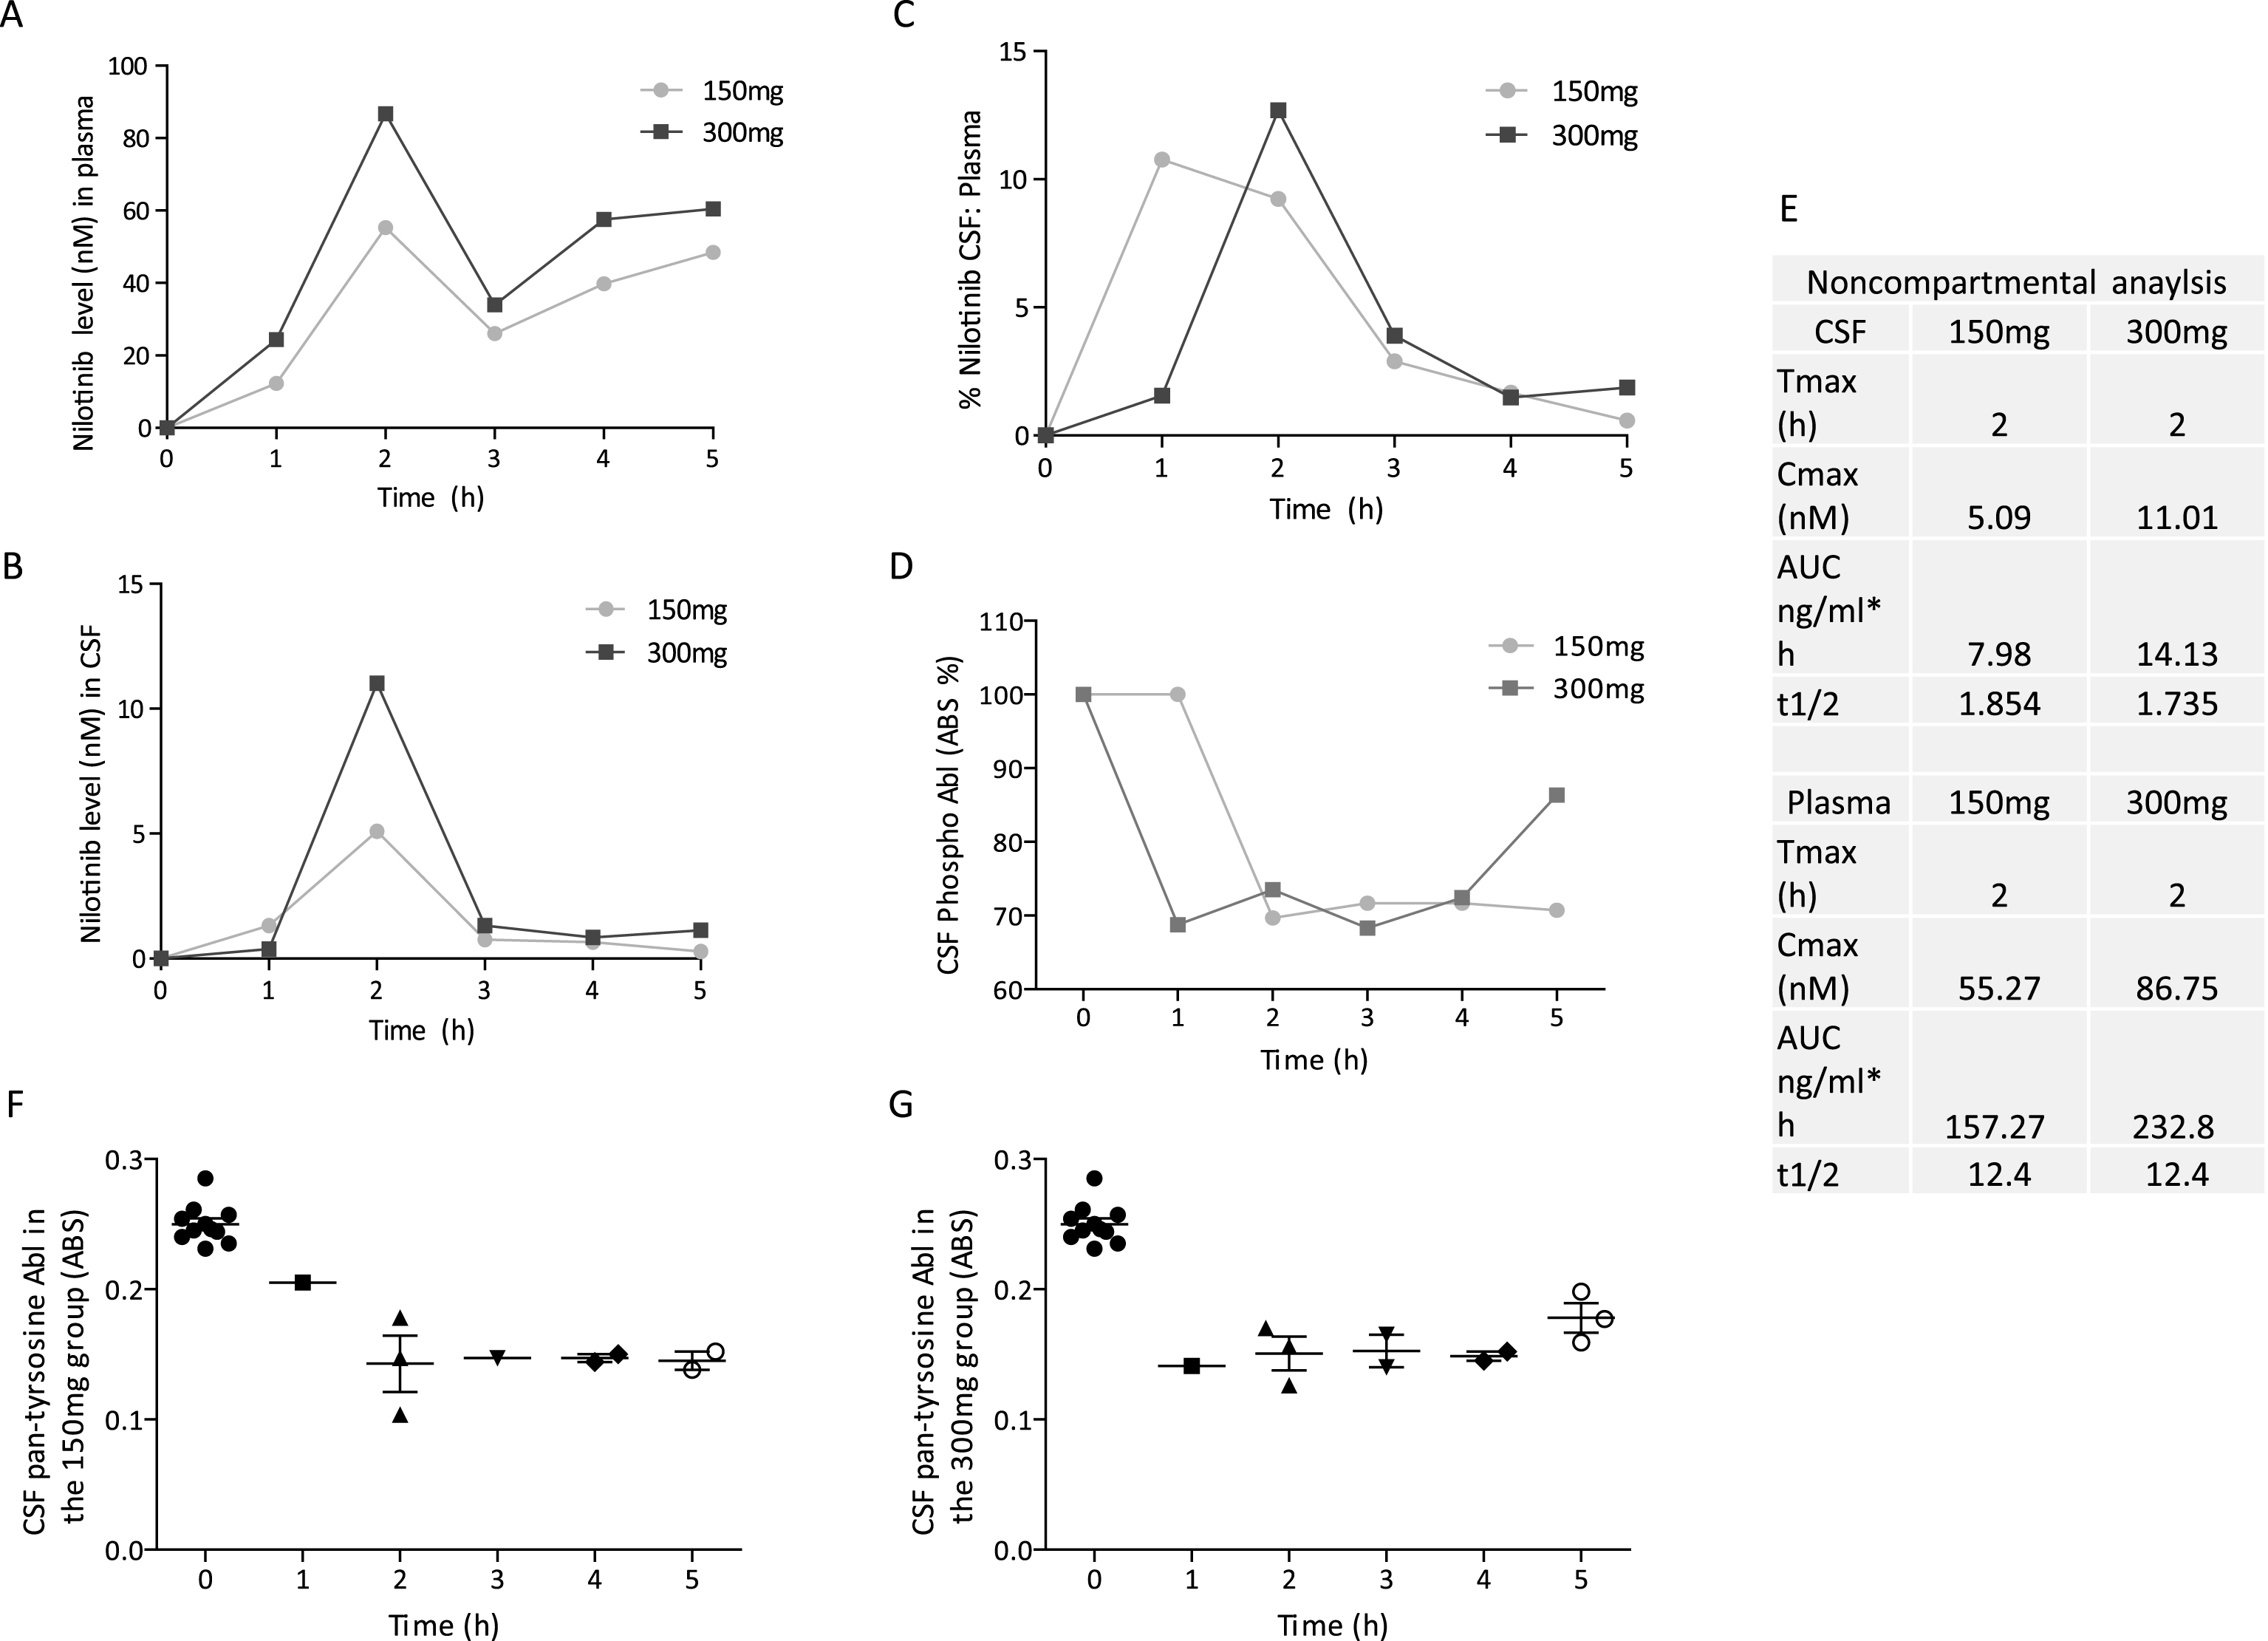
Table 1
Demographics summary of all participants, including 18 “screen fail” and 12 enrolled. PD: Parkinson’s disease; DLB: dementia with Lewy bodies; MCI: mild cognitive impairment; PDD: Parkinson’s disease with dementia; MoCA: Montreal Cognitive Assessment
| Total screened | 30 | |||||||||||
| Total enrolled | 12 | |||||||||||
| Total withdrawal | 1 | |||||||||||
| due to adverse | ||||||||||||
| events | ||||||||||||
| Voluntary | 1 | |||||||||||
| discontinuation | ||||||||||||
| Study duration | 24 weeks | |||||||||||
| Nilotinib study | 150 | 150 | 150 | 150 | 150 | 300 | 300 | 300 | 300 | 300 | 300 | 300 |
| group (mg) | ||||||||||||
| NIL-01 | NIL05 | NL-08 | NIL-14 | NIL-11 | NIL-06 | NIL-09 | NIL-12 | NIL-13 | NIL-03 | NIL-15 | NIL-02 | |
| Age | 69 | 72 | 73 | 74 | 74 | 67 | 81 | 49 | 65 | 74 | 89 | 75 |
| Gender | M | M | F | M | M | M | M | M | M | F | F | M |
| Weight tkgs,) | 60.1 | 71.9 | 52.3 | 63.2 | 76 | 83.2 | 78.9 | 110.2 | 54.5 | 69.8 | 46.7 | 75.7 |
| Heighi (cm) | 165.8 | 170.2 | 142 | 166.6 | 175.1 | 175.1 | 178.4 | 170.4 | 177 | 168.1 | 160 | 178.2 |
| BMI | 21.9 | 24.8 | 25.9 | 22.8 | 24.8 | 27.1 | 24.8 | 38 | 17.4 | 24.7 | 18.2 | 23.8 |
| Levodopa ai | 450 | 500 | 750 | 400 | 1000 | 500 | 400 | 550 | 500 | 1150 | 1160 | 950 |
| baseline | ||||||||||||
| Levodopa 24 | 450 | 500 | 650 | 400 | 750 | 500 | 400 | 550 | 500 | 1025 | 1160 | 500 |
| ai week | ||||||||||||
| Azilect at | 0.5 mg | 0.5mg | 0.5mg | none | 1mg | 1mg | 1mg | 1mg | 1mg | 1mg | 1mg | 0.5nig |
| baseline | ||||||||||||
| Azilect | none | 0.5mg | none | none | 1mg | 0.5mg | 1mg | none | 0.5mg | none | 0.5mg | none |
| at week 24 | ||||||||||||
| Years since | 10 | 9 | 13 | 3 | 18 | 13 | 20 | 15 | 8 | 11 | 13 | 7 |
| diagnosis | ||||||||||||
| Race | Caucasian | Caucasian | Caucasian | Caucasian | Caucasian | Other | Asian | Caucasian | Caucasian | Caucasian | Caucasian | Other |
| Diagnosis | DLB | DLB | DLB | DLB | PD-MCI | PDD | PD-MCI | PD,MCI | DLB | PD | PDD | PD-MCI |
| MoCA | 11 | Unable | 9 | None | 21 | 14 | 19 | 23 | 22 | 28 | 16 | 22 |
| Stage | Stage 3 | Stage 5 | Stage 5 | Stage 3 | Stage 3 | Stage 3 | Stage 4 | Stage 3 | Stage 5 | Stage 3 | Siage 5 | Stage 3 |
Table 2
Detailed UPDRS scores of all participants during every visit. PD: Parkinson’s disease; DLB: dementia with Lewy body; MCI: mild cognitive impairment; PDD: Parkinson’s disease with dementia; UPDRS: Unified Parkinson’s Disease Rating Score
| UPDRS-III 150mg | ||||||||||
| Screening | Week-4 | Week-8 | Week-12 | Week-16 | Week-20 | Week-24 | Week-36 | Diagnosis | Stage | |
| NIL-01 | 38 | 29 | 32 | 32 | 33 | 29 | 23 | 27 | DLB | 3 |
| NIL-05 | 52 | 55 | 56 | 59 | 59 | 60 | 60 | 64 | DLB | 5 |
| NIL-08 | 42 | 4 | 39 | 40 | 43 | 42 | 42 | 54 | DLB | 5 |
| NIL-11 | 33 | 33 | 28 | 30 | 33 | 31 | 29 | 38 | PD-MCI | 3 |
| NIL-14 | 24 | 26 | 23 | 22 | 22 | 19 | 18 | 26 | DLB | 3 |
| AVG | 37.8 | 29.4 | 35.6 | 36.6 | 38 | 36.2 | 34.4 | 41.8 | ||
| UPDRS-I-IV 150mg | ||||||||||
| Screening | Week-4 | Week-8 | Week-12 | Week-16 | Week-20 | Week-24 | Week-36 | Diagnosis | Stage | |
| NIL- 01 | 65 | 54 | 57 | 56 | 58 | 53 | 44 | 58 | LBD | 3 |
| NIL-05 | 100 | 103 | 104 | 107 | 107 | 108 | 108 | 124 | LBD | 5 |
| NIL-08 | 79 | 43 | 76 | 77 | 80 | 83 | 83 | 95 | LBD | 5 |
| NIL-11 | 71 | 71 | 63 | 60 | 63 | 57 | 53 | 74 | PD-MCI | 3 |
| NIL-14 | 48 | 50 | 45 | 47 | 43 | 38 | 40 | 45 | DLB | 3 |
| AVG | 72.60 | 63.60 | 69.00 | 69.40 | 70.20 | 67.80 | 65.60 | 79.2 | ||
| UPDRS-III 300mg | ||||||||||
| Screening | Week-4 | Week-8 | Week-12 | Week-16 | Week-20 | Week-24 | Week-36 | Diagnosis | Stage | |
| NIL-02 | 16 | 11 | 9 | 9 | 13 | 7 | 9 | 10 | PD-MCI | 3 |
| NIL-03 | 12 | 14 | 11 | 11 | 16 | 16 | 12 | 21 | PD | 3 |
| NIL-06 | 11 | 7 | 11 | 8 | 6 | 7 | 6 | 16 | PDD | 3 |
| NIL-12 | 16 | 22 | 18 | 18 | 21 | 21 | 21 | out | PD-MCI | 3 |
| NIL-13 | 77 | 67 | 70 | 67 | 67 | 69 | 70 | 70 | DLB | 5 |
| NIL-15 | 52 | 47 | 49 | 47 | 44 | 41 | 44 | 42 | PDD | 5 |
| AVG | 30.6 | 28 | 28 | 26.6 | 27.8 | 26.8 | 27 | 31.8 | ||
| UPDRS-I-IV 300mg | ||||||||||
| Screening | Week-4 | Week-8 | Week-12 | Week-16 | Week-20 | Week-24 | Week-36 | Diagnosis | Stage | |
| NIL-02 | 36 | 31 | 28 | 26 | 33 | 23 | 20 | 30 | PD-MCI | 3 |
| NIL-03 | 33 | 45 | 41 | 41 | 46 | 41 | 28 | 54 | PD | 3 |
| NIL-36 | 28 | 21 | 25 | 19 | 17 | 16 | 15 | 30 | PDD | 3 |
| NIL-12 | 43 | 49 | 45 | 46 | 49 | 54 | 45 | out | PD-MCI | 3 |
| NIL-13 | 126 | 116 | 118 | 115 | 113 | 106 | 107 | 109 | DLB | 5 |
| NIL-15 | 109 | 103 | 105 | 97 | 95 | 92 | 95 | 92 | PDD | 5 |
| AVG | 62.5 | 60.8 | 60.3 | 57.3 | 58.8 | 55.3 | 51.6 | 63 | ||
Table 3
Detailed MMSE and SCOPA-Cogscores during even visit. PD: Parkinson’s disease; DLB: dementia with Lewy body; MCI: mild cognitive impairment; PDD: Parkinson’s disease with dementia; MMSE: Mini Mental State Examination. SCOPA-Cog: Scales for Outcomes in Parkinson’s Disease-Cognition
| MMSE | ||||||||||
| 150 mg | ||||||||||
| Subjects | Screening | Week-4 | Week-8 | Week-12 | Week-16 | Week-20 | Week-24 | Week-36 | Diagnosis | Stage |
| NIL-01 | 17 | 20 | 22 | 21 | 26 | 26 | 23 | 15 | DLB | 3 |
| NIL-05 | 0 | 0 | 1 | 1 | 1 | 1 | 2 | 0 | DLB | 5 |
| NIL-08 | 9 | 11 | 11 | 11 | 8 | 10 | out | 4 | DLB | 5 |
| NIL-11 | 26 | 28 | 29 | 29 | 30 | 30 | 29 | 29 | PD-MCI | 3 |
| NIL-14 | 25 | 28 | 27 | 28 | 28 | 25 | 23 | 30 | DLB | 3 |
| AVG | 15.4 | 17.4 | 18 | 18 | 18.6 | 18.4 | 19.25 | 15.6 | ||
| MMSE | ||||||||||
| 300 ng | ||||||||||
| Screening | Week-4 | Week-8 | Week-12 | Week-16 | Week-20 | Week-24 | Week-36 | Diagnosis | Stage | |
| NIL-02 | 26 | 27 | 28 | 29 | 27 | 26 | 28 | 25 | PD-MCI | 3 |
| NIL-03 | 30 | 28 | 23 | 26 | 29 | 30 | 30 | 30 | PD | 3 |
| NIL-06 | 22 | 24 | 24 | 25 | 25 | 25 | 25 | 15 | PDD | 3 |
| NIL-12 | 23 | 28 | 24 | 28 | 14 | 24 | 26 | out | PD-MCI | 3 |
| NIL-13 | 0 | 5 | 2 | 1 | 6 | 2 | 5 | 0 | DLB | 5 |
| NIL-15 | 1 | 10 | 8 | 6 | 12 | 6 | 9 | 7 | PDD | |
| AVG | 17 | 20.3 | 18.1 | 19.1 | 18.8 | 18.8 | 20.5 | 15.4 | ||
| SCOPA-Cog (**/43) | ||||||||||
| 150 mg | ||||||||||
| Screening | Week-8 | Week-20 | Week-24 | Diagnosis | Stage | |||||
| NIL-01 | 5 | 5 | 3 | 4 | LBD | 3 | ||||
| NIL-05 | 0 | 0 | 1 | 0 | LBD | 5 | ||||
| NIL-08 | 1 | 4 | 0 | out | LBD | 5 | ||||
| NIL-11 | 22 | 23 | 26 | 23 | PD-MCI | 3 | ||||
| NIL-14 | 19 | 18 | 18 | 18 | LBD | 3 | ||||
| AVG | 9.4 | 10 | 9.6 | 11.25 | ||||||
| SCOPA-Cog (**/43) | ||||||||||
| 300 mg | ||||||||||
| Screening | Week-8 | Week-20 | Week-24 | Diagnosis | Stage | |||||
| NIL-02 | 15 | 22 | 21 | 22 | PD-MCI | 3 | ||||
| NIL-03 | 28 | 30 | 30 | 31 | PD | 3 | ||||
| NIL-06 | 13 | 11 | 19 | 10 | PDD | 3 | ||||
| NIL-12 | 6 | 9 | 10 | 10 | PD-MCI | 3 | ||||
| NIL-13 | 0 | 0 | 0 | 0 | DLB | 5 | ||||
| NIL-15 | 0 | 1 | 0 | 1 | PDD | |||||
| AVG | 10.33 | 12.17 | 13.3 | 12.33 | ||||||

