
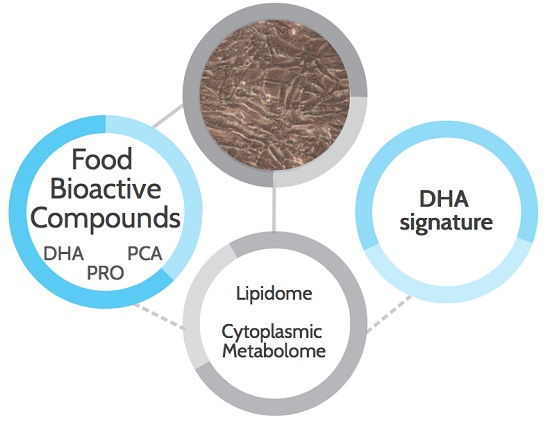
Evidence of a DHA Signature in the Lipidome and Metabolome of Human Hepatocytes

 , ,
, ,  ,
,  ,
,
Abstract
:
1. Introduction
2. Results
2.1. Lipidome
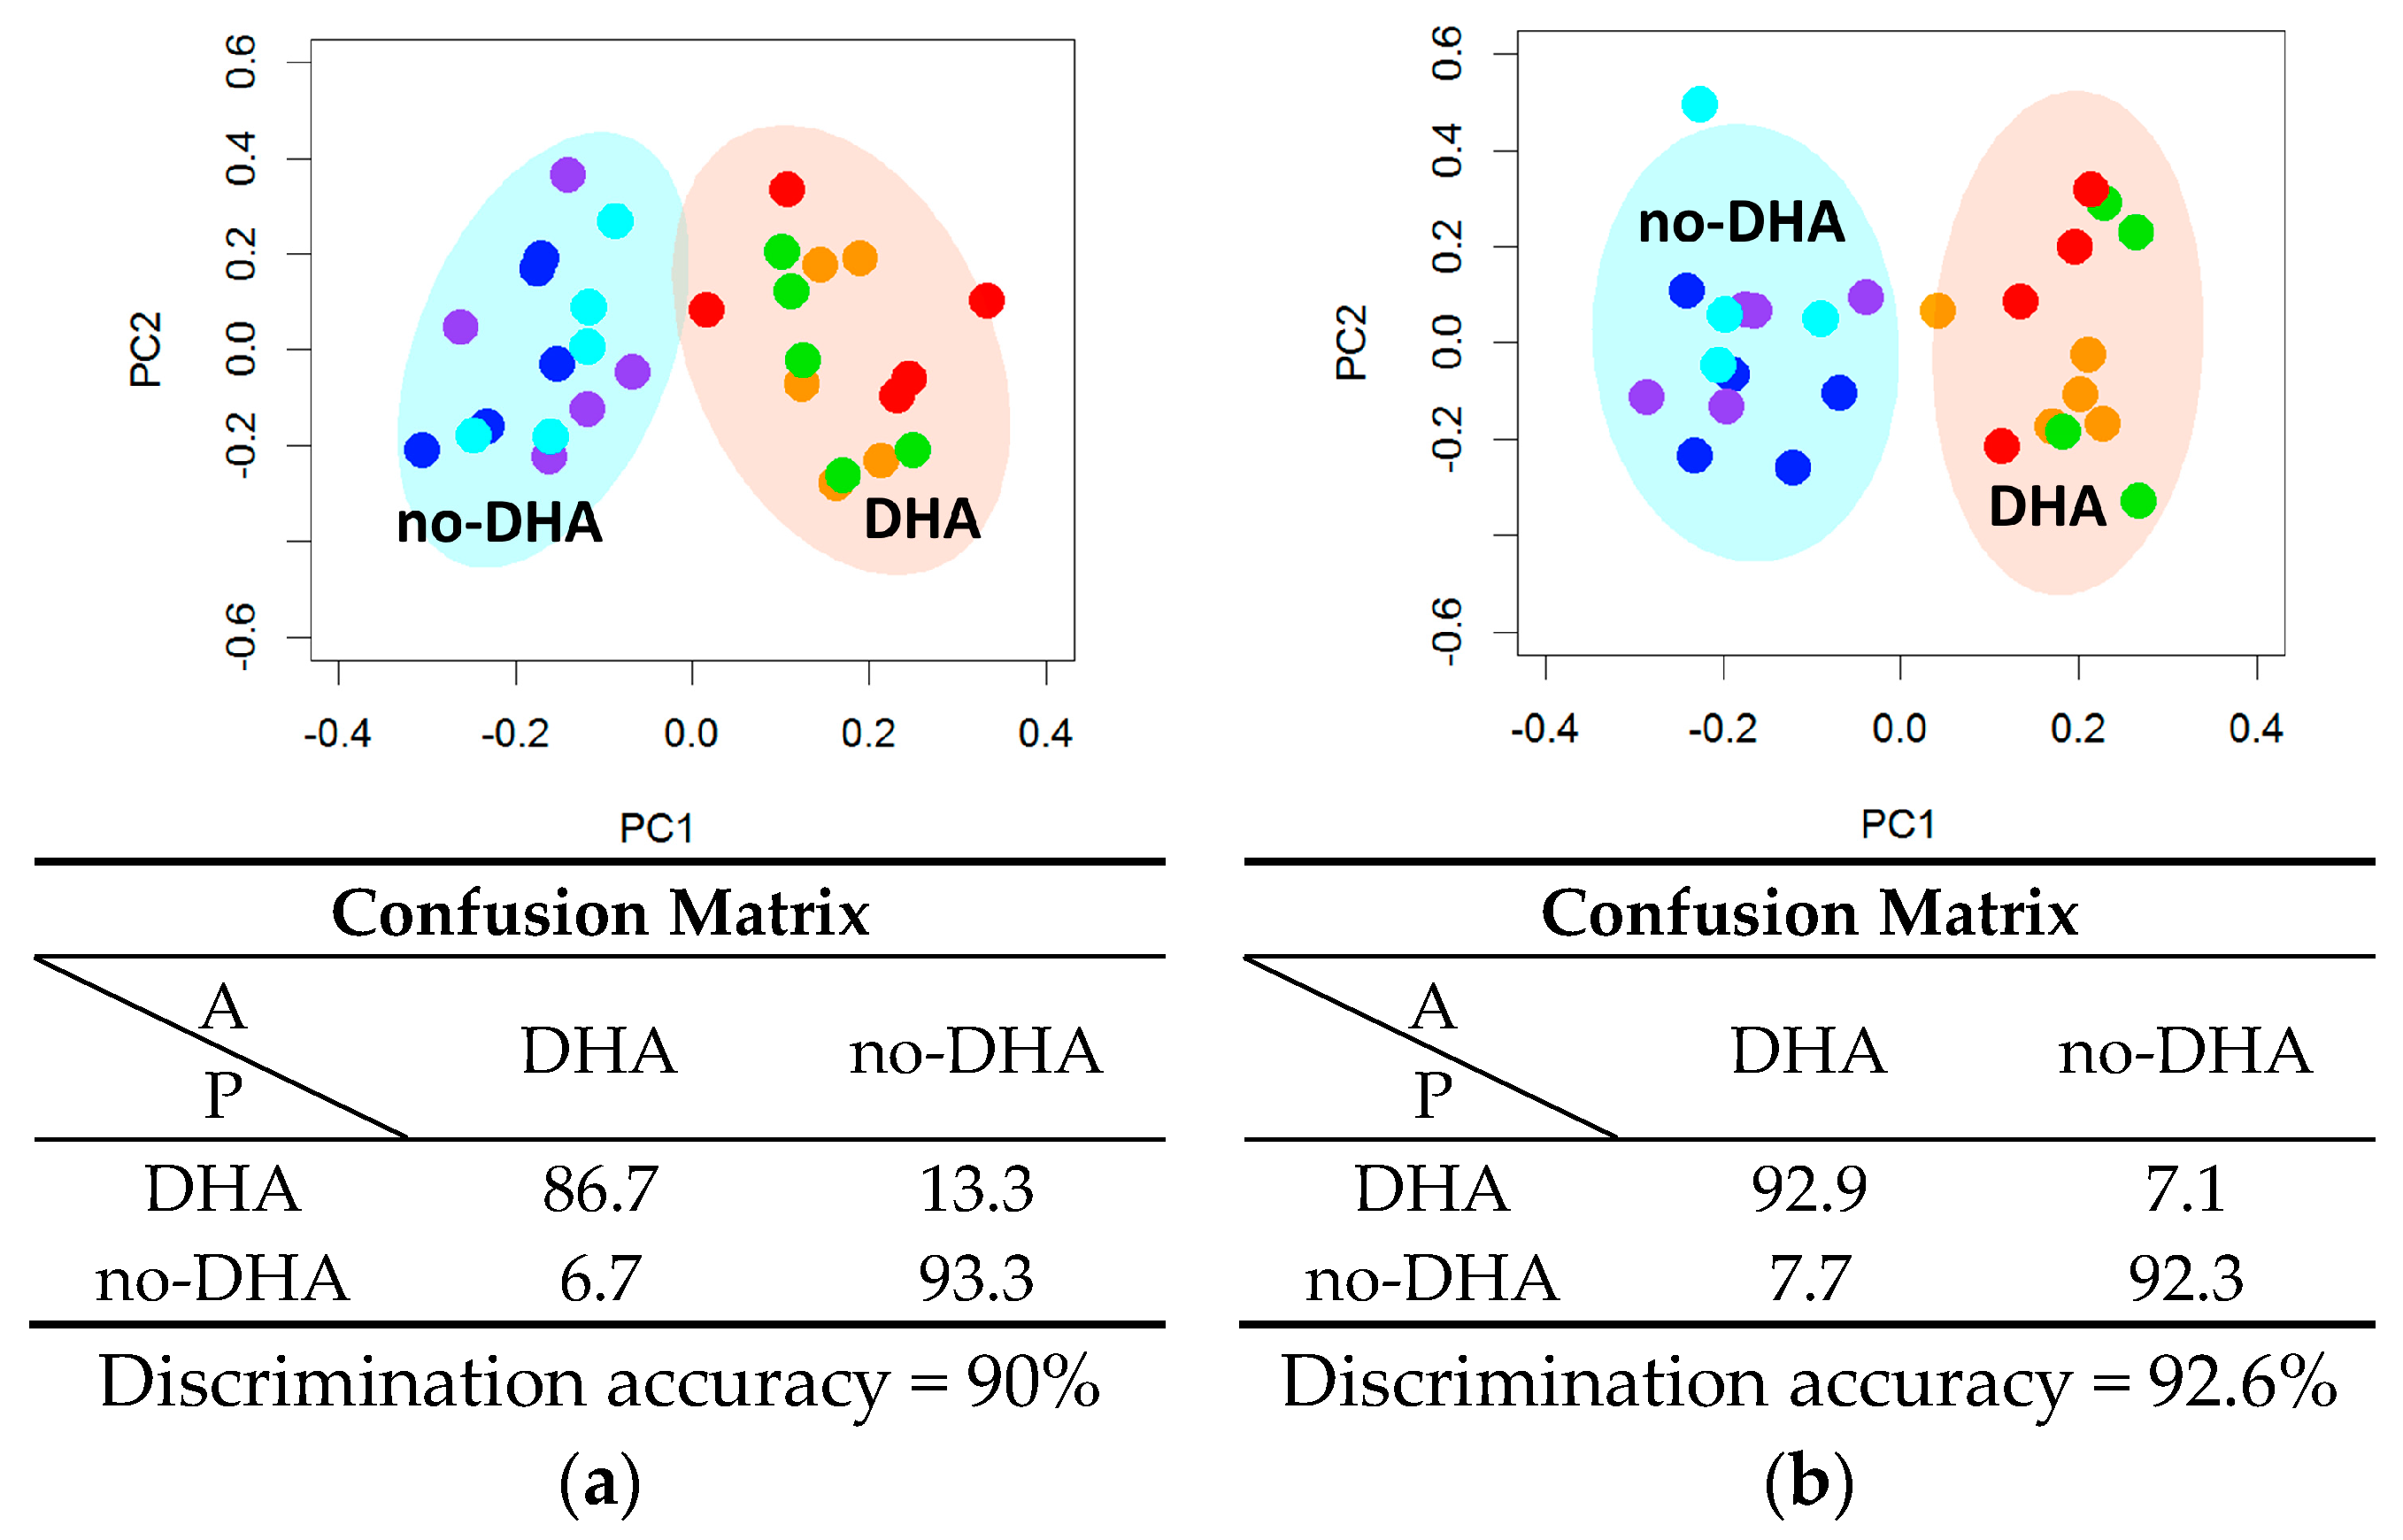
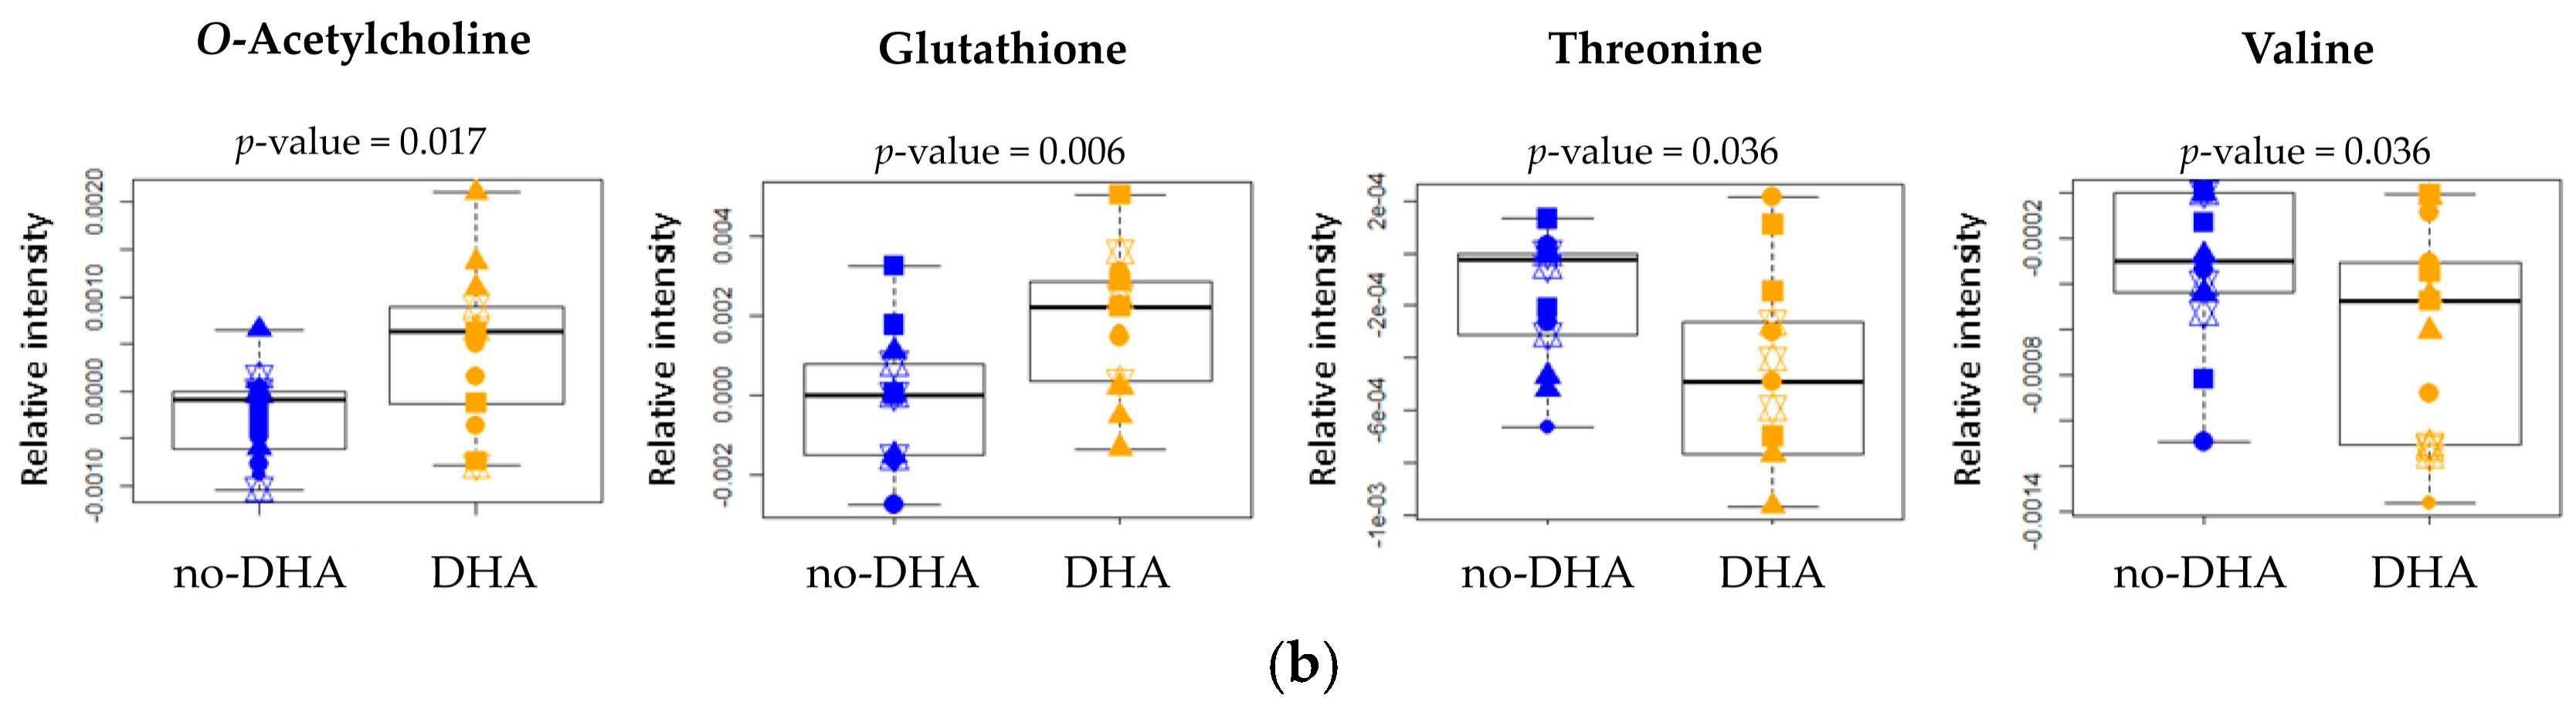
2.2. Metabolome
3. Discussion
4. Materials and Methods
4.1. Materials
4.2. Cell Culture and Supplementation
4.3. Lipid Extraction and Fatty Acid Composition Analysis
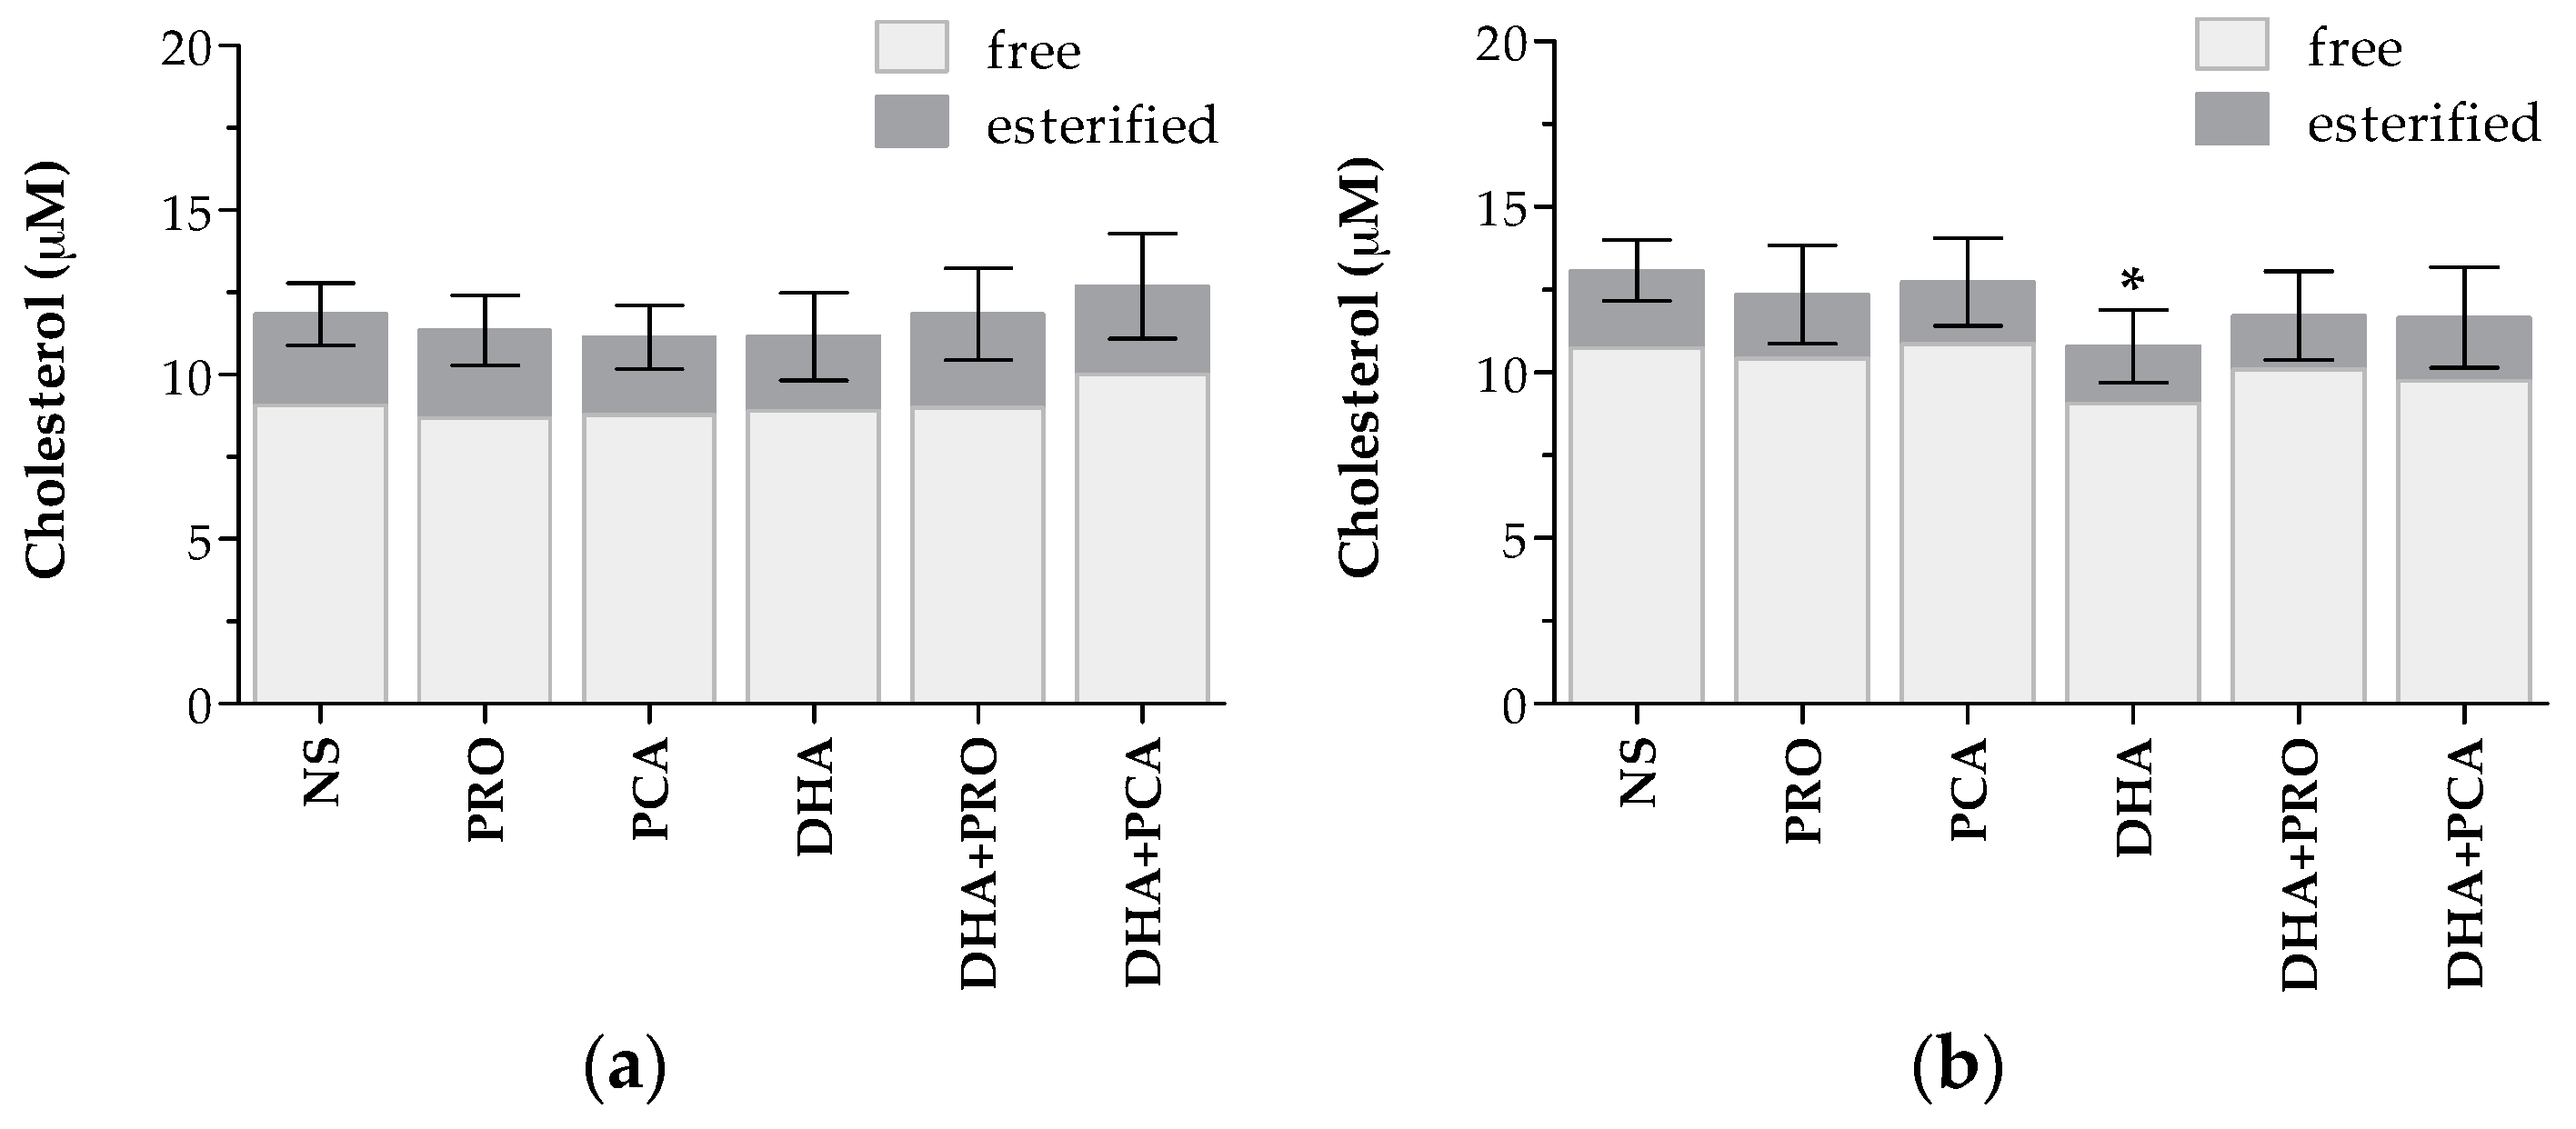
4.4. Evaluation of Lipid Accumulation and Cholesterol Concentration
4.5. Nuclear Magnetic Resonance (NMR) Sample Preparation
4.6. NMR Sample Acquisition
4.7. NMR Spectra Processing and Spectral Analysis
4.8. Statistical Analysis
4.9. Data Deposition
5. Conclusions
Supplementary Materials
Acknowledgments
Author Contributions
Conflicts of Interest
Abbreviations
| A | Actual classes |
| AMP | Adenosine monophosphate |
| ANOVA | Analysis of variance |
| ApoB | Apolipoprotein B |
| AST | Aspartate aminotransferase |
| ATM | Automatic tuning-matching |
| BSA | Bovine serum albumin |
| Cd | Cliff’s delta |
| CRP | C-reactive protein |
| DHA | Docosahexaenoic acid |
| DMEM | Dulbecco’s modified Eagle’s medium |
| DMSO | Dimethyl sulfoxide |
| DPBS | Dulbecco’s phosphate-buffered saline |
| DRD | Diet related diseases |
| EDTA | Ethylenediaminetetraacetic acid |
| EFSA | European Food Safety Authority |
| FA | Fatty acids |
| FBS | Fetal bovine serum |
| FDA | Food and Drug Administration |
| GC | Gas chromatography |
| GSH | Reduced glutathione |
| H NMR | Proton nuclear magnetic resonance |
| HDL | High-density lipoproteins |
| HMBD | Human metabolic database |
| HMG-CoA | 3-Hydroxy-3-methylglutaryl-coenzyme A |
| IMP | Inosine monophosphate |
| l | Large |
| LC-MS/MS | Liquid chromatography-tandem mass spectrometry |
| LC-PUFA | Long-chain polyunsaturated fatty acids |
| LD | Lipid droplets |
| LDL | Low-density lipoproteins |
| m | Medium |
| MUFA | Monounsaturated fatty acids |
| NMR | Nuclear magnetic resonance |
| NOESY | Nuclear Overhauser effect spectroscopy |
| n | Negligible |
| NS | Not supplemented |
| P | Predicted classes |
| PCA | Protocatechuic acid |
| PL | Phospholipids |
| PCA-CA | Principal component analysis and canonical analysis |
| PRO | Propionic acid |
| PUFA | Polyunsaturated fatty acids |
| RCT | Randomized controlled trial |
| s | Small |
| SD | Standard deviation |
| SDBS | Spectra database for organic compounds |
| SFA | Saturated fatty acids |
| TG | Triglycerides |
| TMSP | Trimethylsilylpropanoic acid |
| UI | Unsaturation index |
| UMP | Uridine 5′-monophosphate |
| VLDL | Very low-density lipoproteins |
References
- Weaver, C.M. Bioactive foods and ingredients for health. Adv. Nutr. 2014, 5, 306S–311S. [Google Scholar] [CrossRef] [PubMed]
- Gaine, P.C.; Balentine, D.A.; Erdman, J.W., Jr.; Dwyer, J.T.; Ellwood, K.C.; Hu, F.B.; Russell, R.M. Are dietary bioactives ready for recommended intakes? Adv. Nutr. 2013, 4, 539–541. [Google Scholar] [CrossRef] [PubMed] [Green Version]
- Gil, A.; Serra-Majem, L.; Calder, P.C.; Uauy, R. Systematic reviews of the role of ω-3 fatty acids in the prevention and treatment of disease. Br. J. Nutr. 2012, 107, S1–S2. [Google Scholar] [CrossRef] [PubMed]
- Di Nunzio, M.; van Deursen, D.; Verhoeven, A.J.; Bordoni, A. n-3 and n-6 polyunsaturated fatty acids suppress sterol regulatory element binding protein activity and increase flow of non-esterified cholesterol in HepG2 cells. Br. J. Nutr. 2010, 103, 161–167. [Google Scholar] [CrossRef] [PubMed]
- Li, Q.; Wang, M.; Tan, L.; Wang, C.; Ma, J.; Li, N.; Li, Y.; Xu, G.; Li, J. Docosahexaenoic acid changes lipid composition and interleukin-2 receptor signaling in membrane rafts. J. Lipid Res. 2005, 46, 1904–1913. [Google Scholar] [CrossRef] [PubMed]
- Shaikh, S.R.; Rockett, B.D.; Salameh, M.; Carraway, K. Docosahexaenoic acid modifies the clustering and size of lipid rafts and the lateral organization and surface expression of MHC class I of EL4 cells. J. Nutr. 2009, 139, 1632–1639. [Google Scholar] [CrossRef] [PubMed]
- Rajamoorthi, K.; Petrache, H.I.; McIntosh, T.J.; Brown, M.F. Packing and viscoelasticity of polyunsaturated ω-3 and ω-6 lipid bilayers as seen by 2H NMR and X-ray diffraction. J. Am. Chem. Soc. 2005, 127, 1576–1588. [Google Scholar] [CrossRef] [PubMed]
- Wassall, S.R.; Stillwell, W. Polyunsaturated fatty acid-cholesterol interactions: Domain formation in membranes. Biochim. Biophys. Acta 2009, 1788, 24–32. [Google Scholar] [CrossRef] [PubMed]
- Fan, Y.Y.; Ly, L.H.; Barhoumi, R.; McMurray, D.N.; Chapkin, R.S. Dietary docosahexaenoic acid suppresses T cell protein kinase C theta lipid raft recruitment and IL-2 production. J. Immunol. 2004, 173, 6151–6160. [Google Scholar] [CrossRef] [PubMed]
- Calder, P.C. Mechanisms of action of (n-3) fatty acids. J. Nutr. 2012, 142, 592S–599S. [Google Scholar] [CrossRef] [PubMed]
- Jump, D.B. Dietary polyunsaturated fatty acids and regulation of gene transcription. Curr. Opin. Lipidol. 2002, 13, 155–164. [Google Scholar] [CrossRef] [PubMed]
- Polus, A.; Zapala, B.; Razny, U.; Gielicz, A.; Kiec-Wilk, B.; Malczewska-Malec, M.; Sanak, M.; Childs, C.E.; Calder, P.C.; Dembinska-Kiec, A. ω-3 fatty acid supplementation influences the whole blood transcriptome in women with obesity, associated with pro-resolving lipid mediator production. Biochim. Biophys. Acta 2016, 1861, 1746–1755. [Google Scholar] [CrossRef] [PubMed]
- Soni, N.K.; Nookaew, I.; Sandberg, A.S.; Gabrielsson, B.G. Eicosapentaenoic and docosahexaenoic acid-enriched high fat diet delays the development of fatty liver in mice. Lipids Health Dis. 2015, 14, 74. [Google Scholar] [CrossRef] [PubMed]
- Massaro, M.; Martinelli, R.; Gatta, V.; Scoditti, E.; Pellegrino, M.; Carluccio, M.A.; Calabriso, N.; Buonomo, T.; Stuppia, L.; Storelli, C.; et al. Transcriptome-based identification of new anti-inflammatory and vasodilating properties of the n-3 fatty acid docosahexaenoic acid in vascular endothelial cell under proinflammatory conditions. PLoS ONE 2015, 10, e0154069. [Google Scholar] [CrossRef] [PubMed]
- Zhang, X.; Yang, N.; Ai, D.; Zhu, Y. Systematic metabolomic analysis of eicosanoids after ω-3 polyunsaturated fatty acid supplementation by a highly specific liquid chromatography-tandem mass spectrometry-based method. J. Proteome Res. 2015, 14, 1843–1853. [Google Scholar] [CrossRef] [PubMed]
- Shaikh, S.R.; Kinnun, J.J.; Leng, X.; Williams, J.A.; Wassall, S.R. How polyunsaturated fatty acids modify molecular organization in membranes: Insight from NMR studies of model systems. Biochim. Biophys. Acta 2015, 1848, 211–219. [Google Scholar] [CrossRef] [PubMed]
- Bordoni, A.; Capozzi, F. Foodomics for healthy nutrition. Curr. Opin. Clin. Nutr. Metab. Care 2014, 17, 418–424. [Google Scholar] [CrossRef] [PubMed]
- DiCostanzo, A.; Williams, J.E.; Keisler, D.H. Effects of short- or long-term infusions of acetate or propionate on luteinizing hormone, insulin, and metabolite concentrations in beef heifers. J. Anim. Sci. 1999, 77, 3050–3056. [Google Scholar] [CrossRef]
- Borate, A.R.; Suralkar, A.A.; Birje, S.S.; Malusare, P.V.; Bangale, P.A. Antihyperlipidemic effect of protocatechuic acid in fructose induced hyperlipidemia in rats. Int. J. Pharma Bio Sci. 2011, 2, 456–460. [Google Scholar]
- Liu, W.H.; Lin, C.C.; Wang, Z.H.; Mong, M.C.; Yin, M.C. Effects of protocatechuic acid on trans fat induced hepatic steatosis in mice. J. Agric. Food Chem. 2010, 58, 10247–10252. [Google Scholar] [CrossRef] [PubMed]
- Kang, O.H.; Kim, S.B.; Seo, Y.S.; Joung, D.K.; Mun, S.H.; Choi, J.G.; Lee, Y.M.; Kang, D.G.; Lee, H.S.; Kwon, D.Y. Curcumin decreases oleic acid-induced lipid accumulation via AMPK phosphorylation in hepatocarcinoma cells. Eur. Rev. Med. Pharmacol. Sci. 2013, 17, 2578–2586. [Google Scholar] [PubMed]
- Swanson, D.; Block, R.; Mousa, S.A. ω-3 fatty acids EPA and DHA: Health benefits throughout life. Adv. Nutr. 2012, 3, 1–7. [Google Scholar] [CrossRef] [PubMed]
- Czank, C.; Cassidy, A.; Zhang, Q.; Morrison, D.J.; Preston, T.; Kroon, P.A.; Botting, N.P.; Kay, C.D. Human metabolism and elimination of the anthocyanin, cyanidin-3-glucoside: A 13C-tracer study. Am. J. Clin. Nutr. 2013, 97, 995–1003. [Google Scholar] [CrossRef] [PubMed] [Green Version]
- Al-Lahham, S.H.; Peppelenbosch, M.P.; Roelofsen, H.; Vonk, R.J.; Venema, K. Biological effects of propionic acid in humans; metabolism, potential applications and underlying mechanisms. Biochim. Biophys. Acta 2010, 1801, 1175–1183. [Google Scholar] [CrossRef] [PubMed]
- Al-Lahham, S.H.; Roelofsen, H.; Priebe, M.; Weening, D.; Dijkstra, M.; Hoek, A.; Rezaee, F.; Venema, K.; Vonk, R.J. Regulation of adipokine production in human adipose tissue by propionic acid. Eur. J. Clin. Investig. 2010, 40, 401–407. [Google Scholar] [CrossRef] [PubMed]
- Saccenti, E.; Hoefsloot, H.C.J.; Smilde, A.K.; Westerhuis, J.A.; Hendriks, M.M.W.B. Reflections on univariate and multivariate analysis of metabolomics data. Metabolomics 2014, 10, 361–374. [Google Scholar] [CrossRef]
- Thid, D.; Benkoski, J.J.; Svedhem, S.; Kasemo, B.; Gold, J. DHA-induced changes of supported lipid membrane morphology. Langmuir 2007, 23, 5878–5881. [Google Scholar] [CrossRef]
- Kučerka, N.; Marquardt, D.; Harroun, T.A.; Nieh, M.P.; Wassall, S.R.; de Jong, D.H.; Schäfer, L.V.; Marrink, S.J.; Katsaras, J. Cholesterol in bilayers with PUFA chains: Doping with DMPC or POPC results in sterol reorientation and membrane-domain formation. Biochemistry 2010, 49, 7485–7493. [Google Scholar] [CrossRef] [PubMed]
- Black, S.; Kushner, I.; Samols, D. C-reactive protein. J. Biol. Chem. 2004, 279, 48487–48490. [Google Scholar] [CrossRef] [PubMed]
- Martin, S.; Parton, R.G. Lipid droplets: A unified view of a dynamic organelle. Nat. Rev. Mol. Cell Biol. 2006, 7, 373–378. [Google Scholar] [CrossRef] [PubMed]
- Barber, E.; Sinclair, A.J.; Cameron-Smith, D. Comparative actions of ω-3 fatty acids on in vitro lipid droplet formation. Prostaglandins Leukot. Essent. Fatty Acids 2013, 89, 359–366. [Google Scholar] [CrossRef] [PubMed]
- Varinli, H.; Osmond-McLeod, M.J.; Molloy, P.L.; Vallotton, P. LipiD-QuanT: A novel method to quantify lipid accumulation in live cells. J. Lipid Res. 2015, 56, 2206–2216. [Google Scholar] [CrossRef] [PubMed]
- Chen, L.; Wang, C.; Huang, S.; Gong, B.; Yu, J.; Shi, Q.; Chen, G. Effects of individual and multiple fatty acids (palmitate, oleate and docosahaexenoic acid) on cell viability and lipid metabolism in LO2 human liver cells. Mol. Med. Rep. 2014, 10, 3254–3260. [Google Scholar] [CrossRef] [PubMed]
- Nagao, K.; Nakamitsu, K.; Ishida, H.; Yoshinaga, K.; Nagai, T.; Mizobe, H.; Kojima, K.; Yanagita, T.; Beppu, F.; Gotoh, N. Comparison of the lipid-lowering effects of four different n-3 highly unsaturated fatty acids in HepG2 cells. J. Oleo Sci. 2014, 63, 979–985. [Google Scholar] [CrossRef] [PubMed]
- Bahety, P.; van Nguyen, T.H.; Hong, Y.; Zhang, L.; Chan, E.C.; Ee, P.L. Understanding the cholesterol metabolism-perturbing effects of docosahexaenoic acid by gas chromatography-mass spectrometry targeted metabonomic profiling. Eur. J. Nutr. 2015. [Google Scholar] [CrossRef] [PubMed]
- Maitin, V.; Andreo, U.; Guo, L.; Fisher, E.A. Docosahexaenoic acid impairs the maturation of very low density lipoproteins in rat hepatic cells. J. Lipid Res. 2014, 55, 75–84. [Google Scholar] [CrossRef] [PubMed]
- Smit, M.J.; Verkade, H.J.; Havinga, R.; Vonk, R.J.; Scherphof, G.L.; Tveld, G.I.; Kuipers, F. Dietary fish-oil potentiates bile acid-induced cholesterol secretion into bile in rats. J. Lipid Res. 1994, 35, 301–310. [Google Scholar] [PubMed]
- Pompella, A.; Visvikis, A.; Paolicchi, A.; de Tata, V.; Casini, A.F. The changing faces of glutathione, a cellular protagonist. Biochem. Pharmacol. 2003, 66, 1499–1503. [Google Scholar] [CrossRef]
- Powolny, A.A.; Singh, S.V. Plumbagin-induced apoptosis in human prostate cancer cells is associated with modulation of cellular redox status and generation of reactive oxygen species. Pharm. Res. 2008, 25, 2171–2180. [Google Scholar] [CrossRef]
- Di Nunzio, M.; Valli, V.; Bordoni, A. Pro- and anti-oxidant effects of polyunsaturated fatty acid supplementation in HepG2 cells. Prostaglandins Leukot. Essent. Fatty Acids 2011, 85, 121–127. [Google Scholar] [CrossRef] [PubMed]
- Di Nunzio, M.; Valli, V.; Bordoni, A. PUFA and oxidative stress. Differential modulation of the cell response by DHA. Int. J. Food Sci. Nutr. 2016, 67, 834–843. [Google Scholar] [CrossRef]
- Miyashita, K. Paradox of ω-3 PUFA oxidation. Eur. J. Lipid Sci. Technol. 2014, 116, 1268–1279. [Google Scholar] [CrossRef]
- Li, P.; Kim, S.W.; Li, X.; Datta, S.; Pond, W.G.; Wu, G. Dietary supplementation with cholesterol and docosahexaenoic acid affects concentrations of amino acids in tissues of young pigs. Amino Acids 2009, 37, 709–716. [Google Scholar] [CrossRef] [PubMed]
- Sears, D.D.; Hsiao, G.; Hsiao, A.; Yu, J.G.; Courtney, C.H.; Ofrecio, J.M.; Chapman, J.; Subramaniam, S. Mechanisms of human insulin resistance and thiazolidinedione-mediated insulin sensitization. Proc. Natl. Acad. Sci. USA 2009, 106, 18745–18750. [Google Scholar] [CrossRef] [PubMed]
- Bhaswant, M.; Poudyal, H.; Brown, L. Mechanisms of enhanced insulin secretion and sensitivity with n-3 unsaturated fatty acids. J. Nutr. Biochem. 2015, 26, 571–584. [Google Scholar] [CrossRef] [PubMed]
- Martínez-Fernández, L.; Laiglesia, L.M.; Huerta, A.E.; Martínez, J.A.; Moreno-Aliaga, M.J. ω-3 fatty acids and adipose tissue function in obesity and metabolic syndrome. Prostaglandins Other Lipid Mediat. 2015, 121, 24–41. [Google Scholar] [CrossRef] [PubMed]
- Jump, D.B.; Depner, C.M.; Tripathy, S.; Lytle, K.A. Potential for dietary ω-3 fatty acids to prevent nonalcoholic fatty liver disease and reduce the risk of primary liver cancer. Adv. Nutr. 2015, 6, 694–702. [Google Scholar] [CrossRef] [PubMed]
- Das, U.N. Long-chain polyunsaturated fatty acids in the growth and development of the brain and memory. Nutrition 2003, 19, 62–65. [Google Scholar] [CrossRef]
- Pusceddu, M.M.; Kelly, P.; Stanton, C.; Cryan, J.F.; Dinan, T.G. n-3 polyunsaturated fatty acids through the lifespan: Implication for psychopathology. Int. J. Neuropsychopharmacol. 2016. [Google Scholar] [CrossRef] [PubMed]
- Folch, J.; Lees, M.; Stanley, G.H.S. A simple method for the isolation and purification of total lipids from animal tissues. J. Biol. Chem. 1957, 226, 497–509. [Google Scholar] [PubMed]
- Stoffel, W.; Chu, F.; Ahrens, E.H. Analysis of long-chain fatty acids by gas-liquid chromatography. Micromethod for preparation of methyl esters. Anal. Chem. 1959, 31, 307–308. [Google Scholar] [CrossRef]
- Danesi, F.; Govoni, M.; D’Antuono, L.F.; Bordoni, A. The molecular mechanism of the cholesterol-lowering effect of dill and kale: The influence of the food matrix components. Electrophoresis 2016, 37, 1805–1813. [Google Scholar] [CrossRef] [PubMed]
- McKay, R.T. How the 1D-NOESY suppresses solvent signal in metabonomics NMR spectroscopy: An examination of the pulse sequence components and evolution. Concepts Magn. Reson. Part A 2011, 38A, 197–220. [Google Scholar] [CrossRef]
- Wishart, D.S.; Jewison, T.; Guo, A.C.; Wilson, M.; Knox, C.; Liu, Y.; Djoumbou, Y.; Mandal, R.; Aziat, F.; Dong, E.; et al. HMDB 3.0—The Human Metabolome Database in 2013. Nucleic Acids Res. 2013, 41, D801–D807. [Google Scholar] [CrossRef] [PubMed]
- Vinaixa, M.; Rodriguez, M.A.; Rull, A.; Beltran, R.; Blade, C.; Brezmes, J.; Canellas, N.; Joven, J.; Correig, X. Metabolomic assessment of the effect of dietary cholesterol in the progressive development of fatty liver disease. J. Proteome Res. 2010, 9, 2527–2538. [Google Scholar] [CrossRef] [PubMed]
- Wishart, D.S. Quantitative metabolomics using NMR. Trends Anal. Chem. 2008, 27, 228–237. [Google Scholar] [CrossRef]
- Cliff, N. Ordinal Methods for Behavioral Data Analysis; Lawrence Erlbaum Associates: Mahwah, NJ, USA, 1996; pp. 1–197. [Google Scholar]
- Romano, J.; Kromrey, J.D.; Coraggio, J.; Skowronek, J. Appropriate statistics for ordinal level data: Should we really be using t-test and Cohen’s D for evaluating group differences on the NSSE and other surveys? In Proceedings of the Annual Meeting of the Florida Association of Institutional Research, Cocoa Beach, FL, USA, 1–3 February 2006.
- Haug, K.; Salek, R.M.; Conesa, P.; Hastings, J.; de Matos, P.; Rijnbeek, M.; Mahendraker, T.; Williams, M.; Neumann, S.; Rocca-Serra, P.; et al. MetaboLights—An open-access general-purpose repository for metabolomics studies and associated meta-data. Nucleic Acids Res. 2013, 41, D781–D786. [Google Scholar] [CrossRef] [PubMed]
- Andersen, M.B.; Rinnan, Å.; Manach, C.; Poulsen, S.K.; Pujos-Guillot, E.; Larsen, T.M.; Astrup, A.; Dragsted, L.O. Untargeted metabolomics as a screening tool for estimating compliance to a dietary pattern. J. Proteome Res. 2014, 13, 1405–1418. [Google Scholar] [CrossRef] [PubMed]
- O’Sullivan, A.; Gibney, M.J.; Brennan, L. Dietary intake patterns are reflected in metabolomic profiles: Potential role in dietary assessment studies. Am. J. Clin. Nutr. 2011, 93, 314–321. [Google Scholar] [CrossRef] [PubMed]


| Metabolites | Moieties Assignment | “DHA” vs. “No-DHA” | “PRO” vs. “No-PRO” | “PCA” vs. “No-PCA” | |||
|---|---|---|---|---|---|---|---|
| p-Value 6 h | p-Value 24 h | p-Value 6 h | p-Value 24 h | p-Value 6 h | p-Value 24 h | ||
| Total cholesterol | C18-H3 | 0.308 (s) | 7.2 × 10⁻⁶ ***↓ (l) | 0.895 (n) | 0.566 (n) | 0.537 (s) | 0.825 (n) |
| FA, ω-CH3 | FA chain CH3(CH2)n | 0.00268 **↓ (l) | 0.780 (n) | 0.453 (s) | 0.964 (n) | 0.311 (s) | 0.894 (n) |
| ω-3, (e.g., DHA * + EPA + linoleic) | ω-3 CH3–CH2-C=C | 2.9 × 10⁻⁶ ***↑ (l) | 2.9 × 10⁻⁶ ***↑ (l) | 0.757 (n) | 0.860 (n) | 0.724 (n) | 0.453 (s) |
| Free cholesterol | C19–H3 | 0.755 (n) | 9.5 × 10⁻⁶ ***↓ (l) | 0.628 (n) | 0.825 (n) | 0.233 (s) | 0.537 (n) |
| Esterified cholesterol | C19–H3 | 0.070 (m) | 0.119 (s) | 0.691 (n) | 0.453 (s) | 0.597 (n) | 0.537 (n) |
| FA (total fatty acyl chains) | FA chain –(CH2)n– | 0.015 *↓ (l) | 0.0235 *↓ (l) | 0.724 (n) | 0.537 (n) | 0.310 (s) | 0.272 (s) |
| FA, βH2 | βH2 R–CH2–CH2–CO–OR | 0.467 (s) | 0.0034 **↑ (l) | 0.402 (s) | 0.929 (n) | 1 (n) | 0.158 (s) |
| FA | –CH=CH–CH2– | 0.205 (s) | 0.00032 ***↓ (l) | 0.791 (n) | 0.354 (s) | 0.354 (s) | 1 (n) |
| FA, αH2 | αH2 –CH2–CO–OR | 0.467 (s) | 0.0057 **↑ (l) | 0.354 (s) | 0.172 (s) | 0.825 (n) | 0.0275 *↓ (l) |
| FA (e.g., DHA *) | αH2 and βH2 –CH=CH–CH2–CH2–CO–OR | 2.9 × 10⁻⁶ ***↑ (l) | 2.9 × 10⁻⁶ ***↑ (l) | 0.566 (n) | 0.791 (n) | 0.453 (s) | 0.480 (s) |
| FA (e.g., linoleic) | –CH=CH–CH2–(CH=CH–CH2–)n, n = 1 | 0.0396 *↑ (m) | 0.0038 **↓ (l) | 0.791 (n) | 0.481 (s) | 0.402 (s) | 0.757 (n) |
| FA, PUFA (e.g., DHA *) | –CH=CH–CH2–(CH=CH–CH2–)n, n > 1 | 2.9 × 10⁻⁶ ***↑ (l) | 2.9 × 10⁻⁶ ***↑ (l) | 0.965 (n) | 0.825 (n) | 0.480 (s) | 0.929 (n) |
| Phosphatidylcholine | CH2–N–(CH3)3 | 0.852 (n) | 0.693 (n) | 0.758 (n) | 0.480 (s) | 0.217 (s) | 0.627 (n) |
| Triglycerides | glycerol (C1-Hu) and (C3-Hu) | 0.164 (s) | 4.4 × 10⁻⁶ ***↑ (l) | 0.659 (n) | 0.427 (s) | 0.965 (n) | 0.427 (s) |
| FA, MUFA and PUFA | –CH=CH– | 2.9 × 10⁻⁶ ***↑ (l) | 2.9 × 10⁻⁶ ***↑ (l) | 1 (n) | 0.724 (n) | 0.481 (s) | 0.895 (n) |
| FA | NS | 70 µM PRO | 20 µM PCA | 50 µM DHA | 50 µM DHA + 70 µM PRO | 50 µM DHA + 20 µM PCA |
|---|---|---|---|---|---|---|
| 3:0 | 0.06 ± 0.07 | 0.13 ± 0.09 | 0.03 ± 0.03 | 0.09 ± 0.10 | 0.04 ± 0.07 | 0.03 ± 0.04 |
| 14:0 | 1.30 ± 0.62 | 1.07 ± 0.64 | 1.11 ± 0.53 | 1.91 ± 1.23 | 1.63 ± 0.13 | 1.61 ± 0.09 |
| 16:0 | 22.37 ± 7.28 | 21.71 ± 4.67 | 21.08 ± 3.40 | 24.71 ± 8.04 | 26.6 ± 4.85 | 23.65 ± 1.32 |
| 16:1n-7 | 1.63 ± 0.28 | 1.85 ± 0.76 | 1.93 ± 0.39 | 2.04 ± 0.62 | 2.21 ± 0.59 | 2.21 ± 0.15 |
| 18:0 | 19.95 ± 7.96 | 18.9 ± 3.58 | 17.70 ± 2.65 | 19.90 ± 6.87 | 21.87 ± 3.89 | 19.19 ± 2.41 |
| 18:1n-9 | 5.85 ± 1.13 | 7.30 ± 2.47 | 6.76 ± 1.76 | 7.74 ± 2.59 | 7.48 ± 2.17 | 6.81 ± 1.00 |
| 18:1n-7 | 6.84 ± 1.09 | 7.60 ± 2.28 | 7.56 ± 1.64 | 6.30 ± 1.46 | 7.65 ± 2.36 | 6.84 ± 0.84 |
| 18:2n-6 | 0.26 ± 0.11 | 0.27 ± 0.08 | 0.26 ± 0.06 | 0.36 ± 0.28 | 0.33 ± 0.05 | 0.28 ± 0.05 |
| 18:3n-3 | 0.37 ± 0.13 | 0.32 ± 0.13 | 0.31 ± 0.15 | 0.53 ± 0.25 | 0.44 ± 0.11 | 0.37 ± 0.05 |
| 20:4n-6 | 6.19 ± 1.36 | 7.43 ± 1.96 | 7.52 ± 0.89 | 6.77 ± 1.37 | 8.93 ± 1.47 | 7.94 ± 1.32 |
| 20:5n-3 | 0.25 ± 0.06 | 0.24 ± 0.05 | 0.29 ± 0.21 | 0.32 ± 0.16 | 0.53 ± 0.52 | 0.24 ± 0.02 |
| 22:6n-3 | 0.92 ± 0.46 | 0.61 ± 0.37 | 0.67 ± 0.23 | 6.16 ± 1.07 *** | 6.98 ± 2.48 *** | 6.31 ± 0.80 *** |
| UI | 45.87 ± 9.08 | 50.97 ± 13.88 | 51.32 ± 7.67 | 81.99 ± 16.46 *** | 97.38 ± 22.80 *** | 86.17 ± 4.30 *** |
| n-3/n-6 | 0.24 ± 0.09 | 0.15 ± 0.02 | 0.16 ± 0.06 | 1.00 ± 0.15 *** | 0.87 ± 0.28 *** | 0.87 ± 0.25 *** |
| ΣSFA | 43.68 ± 15.7 | 41.81 ± 8.68 | 39.92 ± 6.29 | 46.61 ± 16.08 | 50.13 ± 8.88 | 44.48 ± 3.61 |
| ΣMUFA | 14.32 ± 1.06 | 16.75 ± 5.45 | 16.25 ± 3.70 | 16.09 ± 4.59 | 17.34 ± 5.09 | 15.87 ± 1.70 |
| ΣPUFA | 8.00 ± 1.91 | 8.87 ± 2.22 | 9.05 ± 1.07 | 14.14 ± 2.87 ** | 17.21 ± 3.41 *** | 15.15 ± 0.88 *** |
| Total FA | 66.00 ± 16.66 | 67.42 ± 15.73 | 65.21 ± 10.15 | 76.83 ± 23.03 | 84.69 ± 17.18 | 75.49 ± 4.13 |
| FA | NS | 70 µM PRO | 20 µM PCA | 50 µM DHA | 50 µM DHA + 70 µM PRO | 50 µM DHA + 20 µM PCA |
|---|---|---|---|---|---|---|
| 3:0 | 0.35 ± 0.10 | 0.21 ± 0.05 | 0.41 ± 0.51 | 0.56 ± 0.55 | 0.61 ± 0.79 | 0.38 ± 0.21 |
| 14:0 | 1.65 ± 0.28 | 1.12 ± 0.17 | 1.16 ± 0.12 | 1.75 ± 0.64 | 1.94 ± 0.37 | 2.07 ± 0.39 |
| 16:0 | 15.82 ± 2.64 | 9.45 ± 0.81 ** | 9.30 ± 1.70 ** | 14.61 ± 2.86 | 14.13 ± 2.39 | 16.17 ± 3.81 |
| 16:1n-7 | 2.40 ± 0.16 | 1.83 ± 0.11 | 1.77 ± 0.43 | 1.98 ± 0.28 | 2.14 ± 0.39 | 2.29 ± 0.45 |
| 18:0 | 14.54 ± 4.45 | 6.06 ± 2.05 ** | 5.46 ± 0.92 *** | 11.21 ± 3.57 | 8.85 ± 1.68 * | 10.00 ± 3.19 |
| 18:1n-9 | 8.96 ± 0.74 | 6.98 ± 0.81 | 6.68 ± 1.55 | 7.34 ± 0.53 | 7.81 ± 1.40 | 8.79 ± 1.99 |
| 18:1n-7 | 5.68 ± 0.40 | 4.46 ± 0.66 | 4.33 ± 0.99 | 3.93 ± 0.23 * | 4.22 ± 0.65 | 4.63 ± 0.85 |
| 18:2n-6 | 0.43 ± 0.07 | 0.31 ± 0.04 * | 0.30 ± 0.07 * | 0.21 ± 0.01 *** | 0.22 ± 0.04 *** | 0.23 ± 0.05 *** |
| 18:3n-3 | 0.45 ± 0.05 | 0.35 ± 0.07 | 0.34 ± 0.09 | 0.33 ± 0.02 | 0.34 ± 0.07 | 0.40 ± 0.09 |
| 20:4n-6 | 0.84 ± 0.17 | 0.69 ± 0.20 | 0.67 ± 0.13 | 0.70 ± 0.19 | 0.93 ± 0.18 | 1.09 ± 0.05 |
| 20:5n-3 | 0.35 ± 0.31 | 0.26 ± 0.30 | 0.24 ± 0.32 | 0.18 ± 0.21 | 0.12 ± 0.21 | 0.38 ± 0.31 |
| 22:6n-3 | 1.36 ± 0.33 | 1.01 ± 0.45 | 0.92 ± 0.42 | 8.28 ± 0.85 *** | 8.92 ± 1.34 *** | 10.45 ± 2.02 *** |
| UI | 30.13 ± 4.21 | 23.20 ± 5.57 | 22.00 ± 7.26 | 66.11 ± 5.39 *** | 71.37 ± 10.36 *** | 84.01 ± 16.55 *** |
| n-3/n-6 | 1.73 ± 0.65 | 1.68 ± 0.98 | 1.49 ± 0.59 | 10.20 ± 3.57 *** | 8.24 ± 1.04 *** | 8.49 ± 1.63 *** |
| ΣSFA | 32.35 ± 7.26 | 16.85 ± 2.70 ** | 16.32 ± 2.99 ** | 28.13 ± 6.78 | 25.53 ± 4.21 | 28.62 ± 6.99 |
| ΣMUFA | 17.05 ± 1.29 | 13.27 ± 1.40 | 12.78 ± 2.85 | 13.26 ± 0.91 | 14.17 ± 2.44 | 15.72 ± 3.29 |
| ΣPUFA | 3.43 ± 0.59 | 2.61 ± 0.78 | 2.46 ± 0.97 | 9.71 ± 0.86 *** | 10.54 ± 1.47 *** | 12.54 ± 2.4 *** |
| Total FA | 52.83 ± 7.20 | 32.73 ± 4.84 ** | 31.56 ± 6.67 ** | 51.09 ± 6.78 | 50.24 ± 7.78 | 56.88 ± 12.36 |
| Metabolites (ppm) | “DHA” vs. “No-DHA” | “PRO” vs. “No-PRO” | “PCA” vs. “No-PCA” | |||||||||
|---|---|---|---|---|---|---|---|---|---|---|---|---|
| 6 h | 24 h | 6 h | 24 h | 6 h | 24 h | |||||||
| p-Value | Cd | p-Value | Cd | p-Value | Cd | p-Value | Cd | p-Value | Cd | p-Value | Cd | |
| Isoleucine (0.945–0.938) | 0.917 | n | 1 | n | 0.112 | s | 0.456 | s | 1 | n | 0.380 | s |
| Valine (1.003–0.981) | 0.662 | n | 0.036 * | m | 0.567 | n | 0.312 | s | 0.691 | n | 0.757 | n |
| Lactate/threonine (1.346–1.320) | 0.950 | n | 0.025 * | l | 0.691 | n | 0.062 | m | 0.047 | m | 0.302 | s |
| Alanine (1.496–1.473) | 0.519 | n | 0.072 | s | 0.112 | m | 0.594 | s | 0.965 | n | 0.718 | n |
| Acetate (1.929–1.917) | 0.755 | n | 0.697 | n | 0.628 | n | 0.099 | m | 0.427 | s | 0.57 | s |
| Glutamate (2.081–2.034) | 0.884 | n | 0.961 | n | 0.252 | s | 0.632 | n | 0.758 | n | 0.099 | m |
| Glutathione (2.584–2.534) | 0.177 | s | 0.006 ** | l | 0.691 | n | 0.632 | n | 0.597 | n | 0.439 | s |
| Creatine (3.044–3.038) | 0.390 | s | 0.098 | m | 0.427 | s | 0.424 | s | 0.354 | s | 0.38 | s |
| Phosphocreatine (3.052–3.044) | 0.152 | s | 0.733 | n | 0.027* | l | 0.221 | s | 1 | n | 0.718 | n |
| Glutamine (2.168–2.109) | 0.662 | n | 0.592 | n | 0.332 | s | 0.338 | s | 0.234 | s | 0.959 | n |
| O-phosphocholine (3.229–3.215) | 0.036 * | m | 0.661 | n | 0.086 | m | 0.958 | n | 0.354 | s | 0.164 | s |
| Methanol (3.373–3.358) | 0.755 | n | 0.013 * | l | 0.724 | n | 0.79 | s | 0.724 | n | 0.164 | m |
| Succinate (2.410–2.403) | 0.467 | s | 0.496 | s | 0.064 | m | 0.11 | m | 0.597 | n | 0.796 | n |
| Formate (8.466–8.451) | 0.983 | n | 0.206 | s | 0.965 | n | 0.632 | n | 1 | n | 0.439 | s |
| Pantothenate (0.903–0.894) | 0.603 | n | 0.206 | s | 0.724 | n | 0.749 | n | 0.186 | s | 0.439 | s |
| Aspartate (2.808–2.793) | 0.036 * | m | 0.088 | m | 0.27 | s | 0.15 | m | 0.965 | n | 0.409 | s |
| Glycine (3.573-3.561) | 0.519 | n | 0.173 | s | 0.481 | s | 0.394 | s | 0.454 | s | 0.409 | s |
| Threonine (4.265–4.256) | 0.493 | n | 0.036 * | m | 0.078 | m | 0.67 | n | 0.311 | s | 0.353 | s |
| AMP/IMP (4.525–4.501) | 0.575 | n | 0.527 | n | 0.217 | s | 0.338 | n | 0.481 | s | 0.235 | s |
| UMP (8.121-8.098) | 0.633 | n | 0.559 | n | 0.234 | s | 0.019 * | m | 0.332 | s | 0.536 | n |
| O-acetylcholine (3.236–3.229) | 2 × 10⁻⁵ *** | l | 0.017 * | l | 0.826 | s | 0.043 | m | 0.930 | n | 0.796 | n |
| Leucine (0.969–0.960) | 0.547 | n | 0.381 | s | 0.332 | s | 0.523 | n | 0.965 | n | 0.256 | s |
© 2017 by the authors. Licensee MDPI, Basel, Switzerland. This article is an open access article distributed under the terms and conditions of the Creative Commons Attribution (CC BY) license ( http://creativecommons.org/licenses/by/4.0/).
Share and Cite
Ghini, V.; Di Nunzio, M.; Tenori, L.; Valli, V.; Danesi, F.; Capozzi, F.; Luchinat, C.; Bordoni, A. Evidence of a DHA Signature in the Lipidome and Metabolome of Human Hepatocytes. Int. J. Mol. Sci. 2017, 18, 359. https://doi.org/10.3390/ijms18020359
Ghini V, Di Nunzio M, Tenori L, Valli V, Danesi F, Capozzi F, Luchinat C, Bordoni A. Evidence of a DHA Signature in the Lipidome and Metabolome of Human Hepatocytes. International Journal of Molecular Sciences. 2017; 18(2):359. https://doi.org/10.3390/ijms18020359
Chicago/Turabian StyleGhini, Veronica, Mattia Di Nunzio, Leonardo Tenori, Veronica Valli, Francesca Danesi, Francesco Capozzi, Claudio Luchinat, and Alessandra Bordoni. 2017. "Evidence of a DHA Signature in the Lipidome and Metabolome of Human Hepatocytes" International Journal of Molecular Sciences 18, no. 2: 359. https://doi.org/10.3390/ijms18020359