Article Text

Abstract
Objective: Treatment with the anti-CD20 monoclonal antibody (mAb) rituximab is effective in rheumatoid arthritis (RA). Marked depletion of circulating B cells, seen in almost all patients, does not correlate with efficacy. The potential synovial immunomodulatory effects of rituximab have not been fully defined.
Methods: The ARISE trial is an open label, serial synovial biopsy (pre-treatment and 8 weeks) study of rituximab, given 1 g intravenously on days 0 and 14 without peri-infusional steroids, in active RA patients on concomitant methotrexate (MTX). Synovial tissue was analysed by immunohistochemistry with digital image analysis and gene expression by real-time PCR.
Results: The mean (SD) baseline DAS28 score was 6.5 (0.4), and mean MTX dose 17.3 mg/week. Of 13 patients, 11 had failed prior tumour necrosis factor (TNF) inhibitor therapy. With treatment, all patients experienced near complete depletion of circulating B cell numbers. During the 6 months after treatment, 7/13 patients achieved an American College of Rheumatology (ACR) 20% improvement (ACR20) response, 3/13 an ACR50 response and 2/13 an ACR70 response. There was a significant decrease in synovial B cells after treatment, but only a small trend towards greater reduction among clinical responders. Among the three patients with ACR50 responses there was a significant decrease in synovial immunoglobulin synthesis.
Conclusions: These data suggest that unlike those in circulation, synovial B cells are decreased but are not eliminated by rituximab therapy. Patients with higher levels of response may have more consistent depletion of synovial B cells, and may also have an alteration in synovial B cell function, as indicated by decreases in synovial immunoglobulin synthesis. Thus, effects on synovial B cells may be necessary but not sufficient for inducing clinical efficacy. Other effects, such as on primary lymph organ B cell antigen presentation or cytokine production, may be operative.
Statistics from Altmetric.com
In recent years, there has been considerable and growing interest in the potential roles played by B lymphocytes in various autoimmune conditions.1–5 Arising in parallel has been the concept of therapeutically targeting B cells in patients with such conditions. To date, the largest experience in autoimmune diseases has been with targeting of the B cell surface antigen CD20 using the chimaeric monoclonal antibody (mAb) rituximab in patients with rheumatoid arthritis (RA). Rituximab selectively targets CD20+ B cells and does not target stem cells or plasma cells. This approach has proven effective in a series of clinical trials, and has lead to the introduction of rituximab into the clinic in a number of countries for the treatment of RA.6–9 A consistent finding across RA trials has been that rituximab rapidly induces a profound selective loss of circulating B cells in virtually all treated patients. However, not all patients respond clinically, therefore depletion of circulating B cells does not show a direct relationship to clinical response. In a transgenic mouse model, it was shown that susceptibility to rituximab therapy varies in tissue, presumably related to factors in the local microenvironment.10 Although a number of studies have addressed various aspects of circulating B cell populations and serum factors in relation to clinical response,11 12 the potential immunomodulatory effects of rituximab therapy on the synovium have not yet been fully defined. One study assessing synovial histopathology 4 weeks after rituximab therapy showed some decrease in synovial B cells at that timepoint, although no clinical responses were evident at that time.13
MATERIALS AND METHODS
Study planning and initiation
This is an open label, investigator initiated study conducted at two centres in the USA. An Investigational New Drug (IND) application was filed with the US Food and Drug Administration (FDA) and an exemption granted to conduct the study. The protocol was registered through ClinicalTrials.Gov (registered 2 September 2005; Registration NCT00147966). Local Institutional Review Board approval was obtained, and all patients signed written informed consent prior to study entry. Medication (rituximab) and partial funding for the conduct of this study was provided by Genentech (South San Francisco, California, USA).
Patients
The study enrolled persons between the ages of 18–70 years with an established diagnosis of RA and a positive serum test for rheumatoid factor (RF). Patients had to have active disease (defined as a tender joint count ⩾8/68, a swollen joint count ⩾6/66, and either early morning stiffness ⩾45 min in duration or an elevation in erythrocyte sedimentation rate (ESR) ⩾28 mm/h or C-reactive protein (CRP) ⩾1.5 mg/dl), despite the concomitant use of methotrexate (MTX) at a dose of ⩾12.5 mg/week for at least 12 weeks. One of the involved joints had to be a knee or a wrist appropriate for arthroscopy. Concomitant use of non-steroidal anti-inflammatory drugs and oral prednisone at doses of 10 mg/day or less were permitted, provided dosing was stable for at least 4 weeks before the study. Patients previously treated with tumour necrosis factor (TNF) inhibitors were permitted to enrol in the study provided they had been off therapy for ⩾2 months for etanercept and ⩾3 months for adalimumab or infliximab.
Exclusion criteria included prior treatment with rituximab, active or recent infections, pre-existing malignancy, and a history of infection with HIV or hepatitis B or C.
Treatment protocol
Patients meeting eligibility criteria underwent baseline arthroscopic synovial biopsy of an affected knee or wrist within 2 weeks of receiving their first treatment with rituximab. Arthroscopy was performed using conscious sedation and sterile technique in an operating room setting. Under direct visualisation, synovial tissue was collected using Automated Motorized Shaver Technology (AMST), a method that rapidly yields >50 synovial tissue fragments rich in synovial lining. The collected tissue fragments were divided and immediately snap frozen in OCT (Miles Laboratories, Elkhart, Indiana, USA) for immunohistochemistry and added to RNAstat 60 (Tel-Test, Friendswood, Texas, USA) for mRNA analysis.
Rituximab at a dose of 1 g was given intravenously over 4–5 h on day 0 and again on day 14. In an effort to obviate any potential immunomodulatory effects of corticosteroids in the synovium, and given that they have been reported to have no effect on clinical outcome and only a modest effect on infusion tolerability,8 no peri-infusional corticosteroids were used in this protocol. Repeat arthroscopy of the same joint and synovial biopsies were performed at the week 8, a timeframe chosen to hypothetically allow maximal observation of immunologic changes. The patients were seen at monthly intervals after the initial treatment period.
Clinical outcomes
The primary clinical outcome was response according to the American College of Rheumatology (ACR) improvement criteria, at a 20% level (ACR20), at 6 months. Secondary clinical outcomes included ACR20 as well as ACR50 and ACR70 responses at monthly timepoints, Disease Activity Score using a 28 joint count (DAS28), and changes in individual disease activity parameters (tender joint count, swollen joint count, physician global assessment of disease, patient global assessment of disease, patient assessment of pain, measure of functional status using the Health Assessment Questionnaire (HAQ), and CRP and ESR at monthly timepoints.
Biomarkers: timing
Biomarkers from the peripheral blood and from synovial tissue were assessed pre-treatment and post-treatment at week 8. CD19 counts, ESR and CRP, and routine haematological and serum chemistry determinations were performed monthly.
Peripheral blood
Circulating CD19+ B cell counts were determined pre- and post-treatment by staining with anti-CD19 mAb (Becton Dickinson, San Jose, California, USA) and detection by fluorescence-activated cell sorting (FACS) using a FACS Calibur flow cytometer according to the manufacturer’s protocol (Becton Dickinson). To increase sensitivity in treated patients, 1×10⁶ lymphocyte events were counted.
Serum was assessed for RF, anti-cyclic citrullinated peptide (CCP) antibodies, quantitative immunoglobulins (IgG, IgA, IgM, total Ig), and rituximab concentrations by enzyme-linked immunosorbent assay (ELISA).
Synovium
Infiltrating cell populations were assessed by immunohistochemistry (IHC) with digital image analysis, including B cells (CD19 and CD20), T cells (CD3), and macrophages (CD68), and plasma cells (CD138). Synovial architecture, specifically the presence of organised lymphoid aggregates, was also assessed using histology and IHC, according to published methods.14
Synovial tissue levels of immunoglobulin (IgM, IgG, total Ig), anti-CCP antibodies, and rheumatoid factor (RF) were measured by tissue ELISA. The specific activity of the protein of interest in the synovium was calculated by dividing synovial concentrations with that of albumin in the synovium, and dividing this by the same ratio for the peripheral blood.
Synovial gene expression analysis
Synovial RNA was extracted from pools of >6 tissue fragments and cDNA was synthesised as previously described.15 TaqMan PCR was performed using predeveloped reagents (Applied Biosystems, Foster City, California, USA). Results were compared to a reference standard curve composed of cDNA from Concavalin-A stimulated peripheral blood mononuclear cells (PBMC) and normalised for content of the housekeeping gene glyceraldehyde 3-phosphate dehydrogenase (GAPDH) as described previously.15
Gene expression, utilising quantitative reverse transcriptase (RT)-PCR, was performed to measure inflammatory mediators and B cell survival factors, including: IgM (heavy chain), IgG (heavy chain), Igκ (light chain), TNFα, interleukin (IL)-1β, IL-6, IL-8, matrix metalloproteinase (MMP)-1, MMP-3, BAFF, stromal cell-derived factor 1 (SDF1), and APRIL. Post-treatment levels were expressed as the percent of the pre-treatment geometric mean with 95% confidence intervals from log-transformed data.16
Synovial immunohistochemistry
DAKO (Glostrup, Denmark) reagents were used for immunohistochemistry according to the manufacturer’s instructions. Frozen sections (5 μM) of >6 pooled synovial tissue fragments were acetone fixed, endogenous peroxidase activity was depleted with 0.3% hydrogen peroxide and serum blocked. Primary and secondary antibodies were incubated for 1 h, followed by development with 3-amino-9-ethglcarbazole (AEC) substrate and counterstaining with Meyer’s haematoxylin.
Staining was quantified by digital image analysis using a Nikon E800 microscope and Image Pro software (AG Heinze, Lake Forest, California, USA).17
Statistical analyses
Comparison of pre-treatment to post-treatment values was performed using the Wilcoxon signed rank test for paired data. Associations between changes in various clinical and biomarker results was performed using Spearman rank correlation coefficient. Biomarker data are presented as the geometric mean of the log transformed values with 95% confidence intervals; confidence intervals that do not cross zero are considered significant.16
RESULTS
Clinical
Patient characteristics at baseline are shown in table 1. Pre-treatment, the arthritis among enrolled patients was active and severe, as shown by the high DAS and HAQ scores. Indeed, 12 of 13 patients (92%) could be classified as having “high” disease activity on the basis of their DAS28 score. In addition, the patients were refractory insofar as the number of previous disease-modifying antirheumatic drug (DMARD) therapies they had failed. Of note, although it was not required for study entry, 85% of patients had failed prior therapy with TNF inhibitors, including two who had failed two agents and one who had failed all three.
Three patients did not remain in the study through 6 months; all are considered non-responders in the efficacy analysis. One patient withdrew at month 2 for personal reasons, and two patients withdrew at months 4 and 5, respectively, due to perceived inefficacy of treatment.
At 6 months, 6 of 13 (46%) patients achieved an ACR20 response, including 2 (15%) with an ACR50 and 1 (8%) with an ACR70 response. Looking at monthly response rates over the first 6 months, 7/13 (54%) achieved an ACR20 response at some timepoint in the 6 months following therapy. For purposes of correlations with biomarker results, these patients are considered “responders”. DAS28 scores for responders and non-responders are shown in fig 1. During the first 6 months, three (23%) also reached ACR50 and two reached an ACR70 level of response (15%) at some point. At 6 months, 7 of 13 (54%) could be classified as European League Against Rheumatism (EULAR) responders, including 1 (8%) achieving a “good” response.

Treatment was generally well tolerated. There was one serious adverse event, a hospitalisation for a reaction to a non-study medication; this was considered unrelated to the study protocol. One patient had a reaction to the drug infusion that resolved upon slowing of the infusion rate.
Biomarker
Synovial samples from one patient were of insufficient quality for analysis, and so were excluded; that patient was a clinical non-responder.
As has been observed in other clinical trials, treatment with rituximab resulted in profound depletion of circulating B cells, with >95% depletion of CD19+ cells in the peripheral blood in all patients (fig 2). As has also been reported, there was no correlation between clinical response and level of B cell depletion. In addition, levels of serum RF decreased consistently, with a median change of approximately 33% after treatment with rituximab (fig 2). There was no correlation between changes in RF after treatment and clinical outcome. Levels of serum antibodies to CCP were more variable, with decreases in about one third, and no change or even slight increases in titre in the remainder; changes in anti-CCP antibody titres did not correlate with clinical outcome.

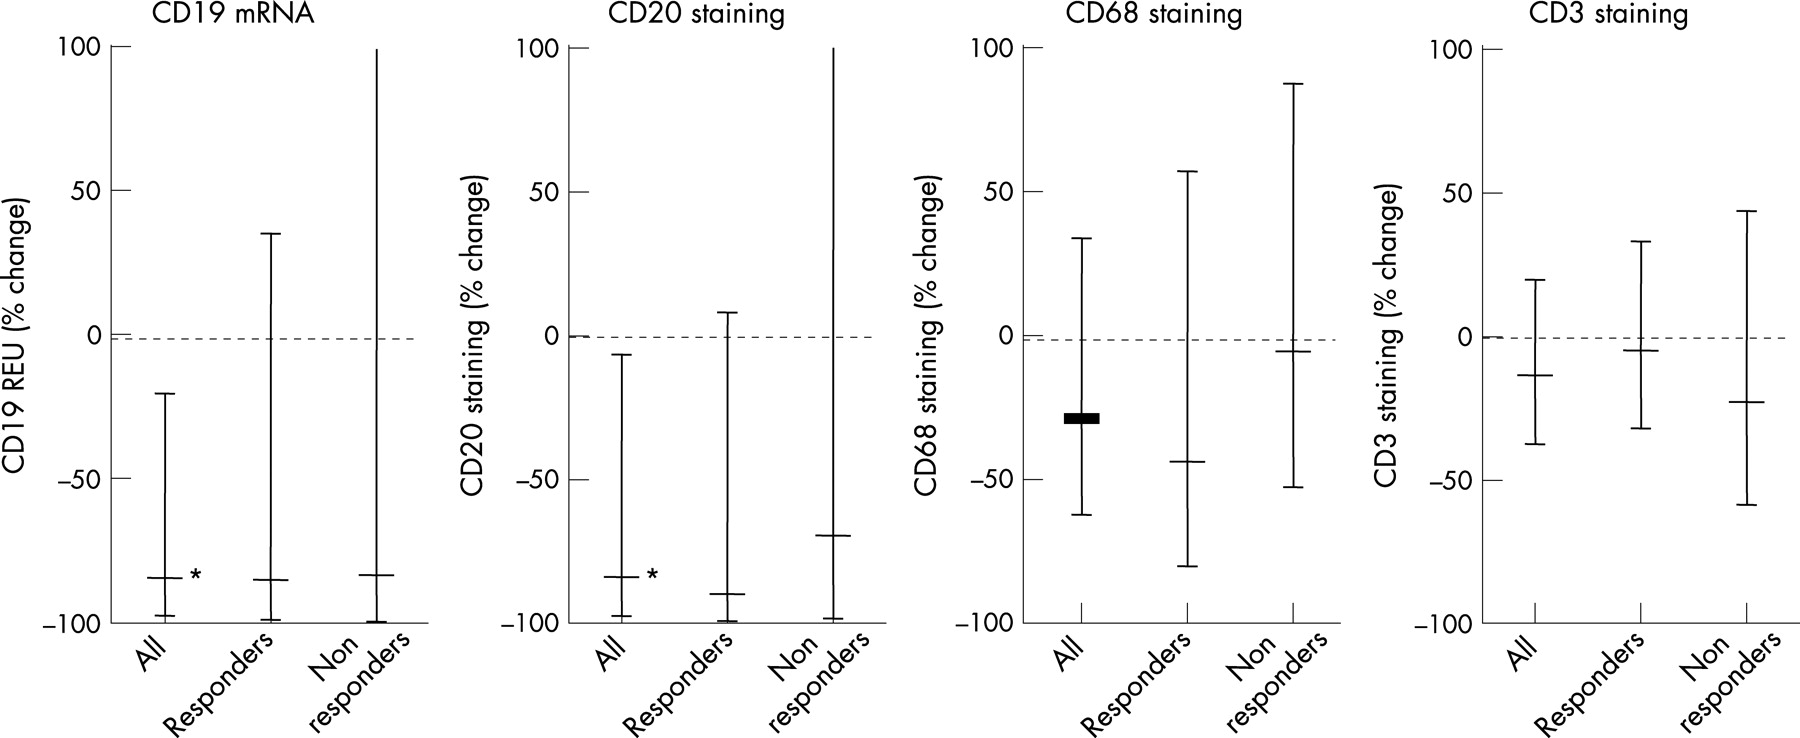
In the synovium, there was no significant change in the numbers of CD3+ T cells or CD68+ macrophages (fig 3) or CD138+ plasma cells (data not shown). However, overall a significant decrease in the numbers of B cells in the synovium was observed, with a mean decrease of approximately 80% (fig 3). There was notable heterogeneity among B cell number at baseline among patients, and there was only a trend towards greater reduction in synovial B cells among responders compared with non-responders (p = 0.08) (fig 3).

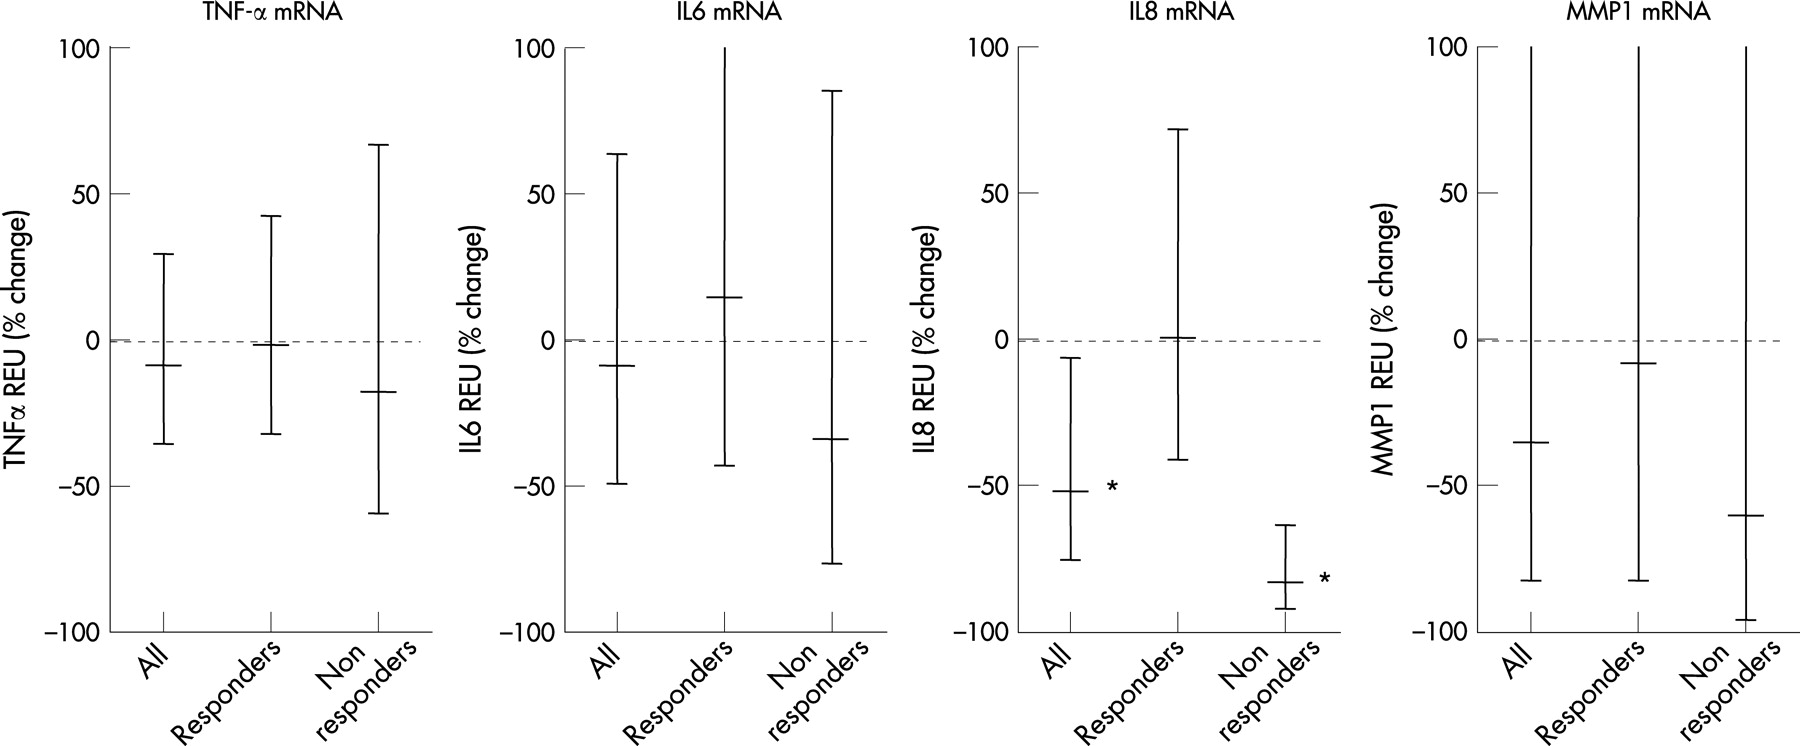
Overall, there was a non-significant trend towards a decrease in synovial IgM and IgG production; however, there was no difference between responders and non-responders (fig 4). Measures of inflammation that are commonly present in the inflamed rheumatoid synovium were examined (fig 5). Following treatment, there was no overall change in the synovial expression of TNFα, Il-6, and MMP-1, and no difference between responders and non-responders. Interestingly, a significant decrease in synovial expression of the chemokine IL-8 was observed following rituximab treatment; however, the decrease appeared to be explained by consistent decreases among non-responders (fig 5). This result would seem almost paradoxical, given the diverse proinflammatory actions mediated by IL-8.
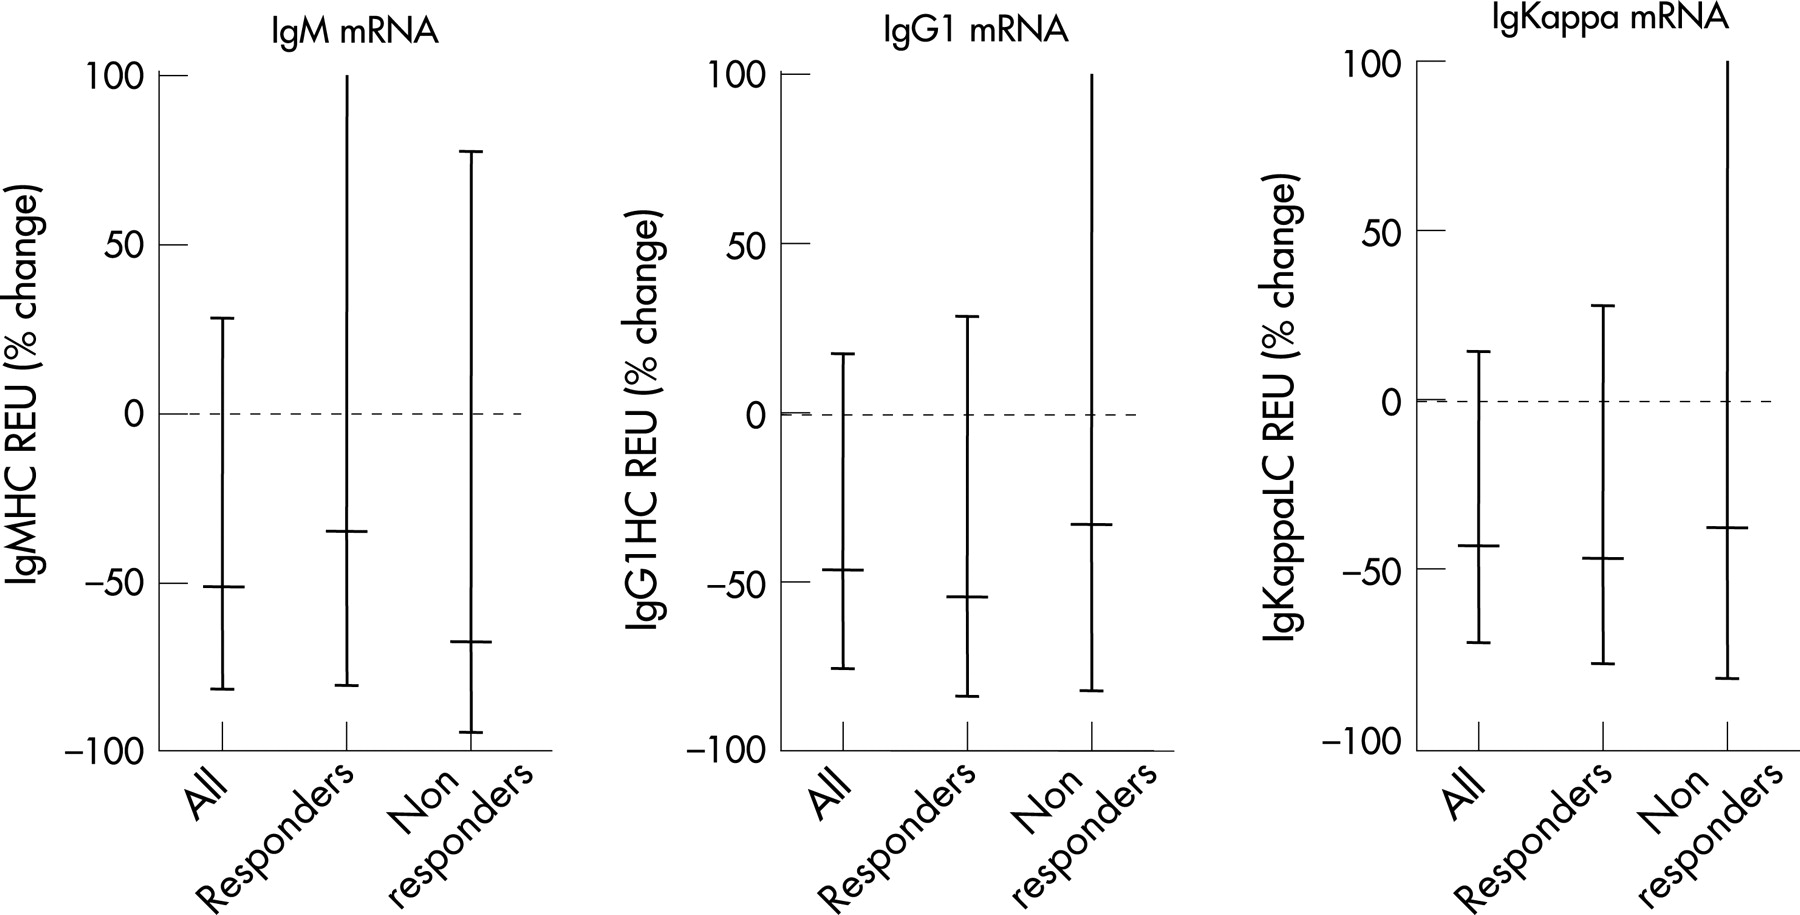
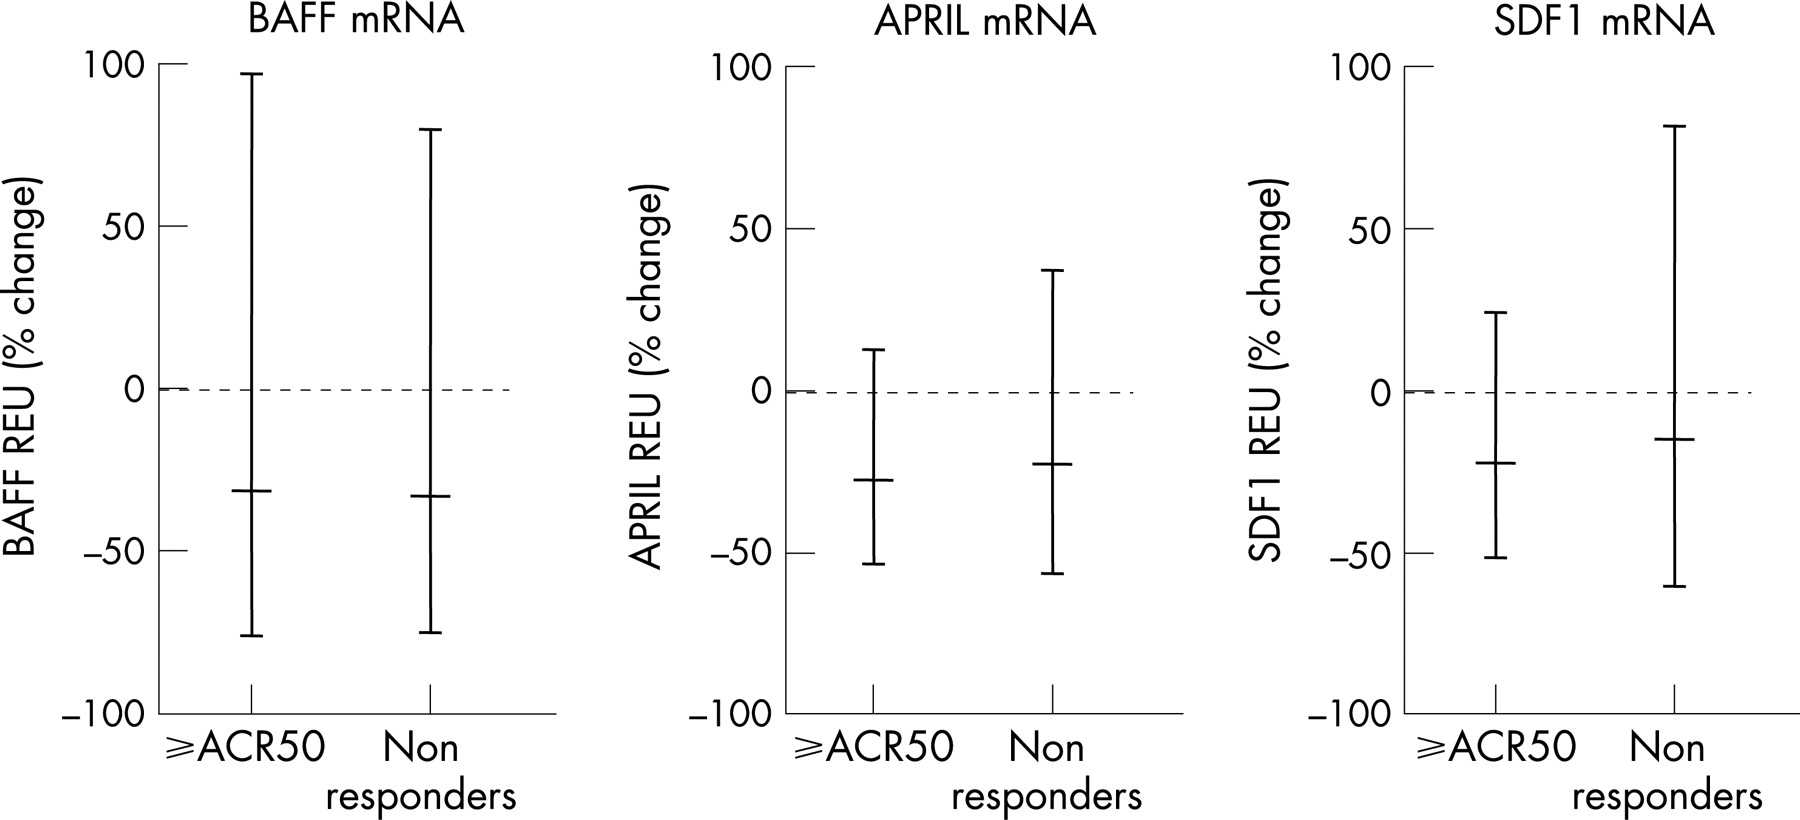
We next looked at biomarker results among those patients experiencing the higher levels of response. Of note, among the three patients who achieved an ACR50 or higher response, there was a significant depletion of synovial B cells that appeared to be more consistent than observed among non-responders (fig 6). Interestingly, this difference could not be explained by variation in B cell survival factors. Thus, synovial expression of BAFF, APRIL and SDF-1 were not significantly altered following rituximab therapy (fig 7). Moreover, there was no correlation between changes in synovial B cell number and synovial survival factors, and no observed differences in synovial B cell survival factor expression between responders and non-responders, or high-level responders and non-responders. That the decrease in synovial B cells among higher-level responders may be relevant to the immunomodulatory mechanisms of rituximab in the RA synovium is suggested by the observation that synovial IgG and IgM synthesis significantly decreased among higher-level responders (fig 8).


Before rituximab therapy, highly organised lymphoid aggregates were seen in 4 of 12 synovial samples. Although treatment resulted in a decrease in cellularity in the aggregates, there was no interruption in the architecture of the aggregates (data not shown). Furthermore, two of the four patients with aggregates pre-treatment ended up being clinical responders and two were non-responders to rituximab therapy. Compared to patients without lymphoid aggregates, those with such aggregates showed higher levels of immunoglobulin and inflammatory mediators. After therapy, patients with lymphoid aggregates showed greater decreases in these measures. However, these did not correlate with clinical outcomes.
DISCUSSION
B cells may contribute to the initiation and sustenance of autoimmune diseases by a number of mechanisms, including antigen presentation and provision of co-stimulatory signals to T cells, secretion of cytokines and other mediators into the local milieu, and synthesis of pathogenic autoantibodies. In RA, evidence supporting a role for B cells includes the demonstration of abundant plasma cells in the synovium, the presence of organised lymphoid aggregates within the synovium, and the correlation between RF and anti-CCP autoantibodies with clinical outcomes. More recently, the therapeutic efficacy of rituximab, a chimaeric mAb targeting the B cell specific surface molecule CD20, lends further support to a role for B cells in RA.
Although depletion of circulating B cells in RA patients treated with rituximab is profound in almost all treated patients, such depletion does not correlate with clinical efficacy. Therefore, it is of interest to assess whether alterations in the RA synovial immunologic microenvironment might correlate with outcomes following rituximab treatment.
The primary finding of this study is that the simplest potential explanation at the level of the synovium for the heterogeneous clinical effect of rituximab does not appear to be operative. That is, it cannot be said that those patients with significant synovial B cell were always clinical responders or that those with minimal changes in synovial B cells were uniformly non-responders. A potential contributing factor may be the substantial baseline heterogeneity as regards synovial B cells. Of note, there was a trend towards greater reduction of synovial B cell numbers among responders. Thus, if larger numbers of patients were assessed, it is possible that an association would have been found. Additionally, there was a significant and more consistent depletion of synovial B cells among patients with greater levels of clinical response as compared to non-responders. However, analysis of changes in synovial B cells among patients did show profound depletion among some non-responders. Also, neither pre-treatment B cell numbers nor the presence of organised lymphoid aggregates correlated with clinical response. An observation that does suggest a key direct role for synovial B cells as regards the efficacy of rituximab was the significant and striking decrease in synovial immunoglobulin synthesis of IgG and IgM among patients with higher levels of clinical response. Although the population was small, the reduction of IgM mRNA suggests a connection between synovial B cells and clinical response. Thus, depletion of synovial B cells may be necessary but not sufficient for clinical efficacy with rituximab, and examination of highly responsive patients may allow for better dissection of mechanistic relationships.
Assessment of synovial microarchitecture did reveal highly organised lymphoid aggregates in 4 of 12 patients. While changes in several markers were greater among those with such aggregates than those without, there was no correlation with clinical outcome observed.
Interestingly, analysis of B cell survival factors in the periphery as well as in the synovium did not show marked changes after therapy, and did not correlate with clinical response. Also, there were minimal changes in inflammatory markers within the synovium. An interesting exception was Il-8. Unexpectedly, decreases in synovial IL-8 were observed among clinical non-responders.
A factor that may have affected the results observed in this study is the time of assessment chosen. In the design of the protocol, 8 weeks post-treatment was selected to allow for changes that may take time to develop, but not so long as to miss important changes due to recovery post-treatment. It is possible that different findings would have been observed at alternate timepoints. Recently, preliminary results from another study assessing synovial alterations related to rituximab therapy were published.13 In that report, a decrease in the number of synovial B cells was observed 4 weeks after rituximab therapy. No clinical response was noted at the 4-week observation timepoint in that report, so it is not possible to assess correlations between biomarkers and clinical response. Substantial heterogeneity in baseline synovial B cell numbers were also observed in that study.
Another potential caveat of our results was that the study was open labelled or open label single arm. However, in this study, the extent of clinical responses observed closely approximated those at the 6-month timepoint among patients randomised to receive rituximab treatment in the REFLEX study. Comparison of REFLEX and ARISE is probably also appropriate as baseline measures of disease activity among patients were similar, and all patients in both trials had active disease despite concomitant MTX. Furthermore, the vast majority of patients in ARISE had failed prior TNF inhibitor therapy, as had all REFLEX patients. One key difference between the studies was the lack of large peri-infusional corticosteroids in ARISE. Nevertheless, because this is an open study, it is possible that inexactness of clinical outcome may have affected correlation between the clinical and biomarker results. Also, although all patients failing prior TNF inhibitor therapy had been off such treatment for appropriate lengths of time, and all patients had active disease, it is possible that a persistent immunomodulatory synovial effect may have affected the results observed. Given the half lives of the treating agents, and the kinetics of clinical response following TNF inhibitor withdrawal among patients with longstanding refractory RA, this is probably unlikely. A strength of this study, as regards the synovial analysis, is that high dose peri-infusional steroids, which could potentially contribute significant effects within the synovium even within the timeframe assessed, were not used.
In conclusion, data from this study suggest that unlike those in the periphery, synovial B cells may be decreased but are not eliminated by rituximab therapy. Patients with higher levels of response may have more consistent depletion of synovial B cells. There may be also an association between changes in synovial B cells and clinical response, as indicated by decreases in synovial immunoglobulin synthesis. Thus, effects on synovial B cells may be necessary but not sufficient for inducing clinical efficacy, and other effects that were not specifically addressed in this analysis, such as on primary lymph organ B cell antigen presentation or cytokine production, may be operative.
REFERENCES
Footnotes
Competing interests: None declared.