


Abstract
We hypothesised that hypocretin (orexin) plays a role in the determination of ventilatory chemosensitivity. 130 patients with narcolepsy–cataplexy (mean±sd age 20±10 yrs, 69% male) and 117 controls (22±6.9 yrs, 62% male) were recruited and tested for human leukocyte antigen (HLA)-DQB1*0602 status, hyperoxia hypercapnic (change in minute ventilation (δV′E)/carbon dioxide tension (δPCO2) L·min−1·mmHg−1) and hypoxic (δV′E /change in arterial oxygen saturation measured by probe oximetry (δSp,O2) L·min−1 per %Sp,O2) responsiveness, and by spirometry. Hypocretin deficiency was determined either by measures of cerebrospinal fluid hypocretin-1 (37 patients) or by positive HLA-DQB1*0602 status. All patients and 49% of controls underwent polysomnography and multiple sleep latency testing. Despite similar spirometric values, patients had a higher apnoea/hypopnoea index (AHI) (2.8±5.4 versus 0.8±1.6 h−1; p = 0.03) and lower minimal oxygen saturation during sleep (87%±7 versus 91±4%; p = 0.0002), independent of age, sex and body mass index. Patients had depressed hypoxic responsiveness (0.13±0.09 versus 0.19±0.13 L·min−1 per %Sp,O2; p<0.0001), independent of AHI, but hypercapnic responsiveness did not differ. Examined by HLA status, positive (26 out of 117) controls had lower hypoxic but similar hypercapnic responsiveness than those marker-negative (0.13±0.08 versus 0.20±0.14 L·min−1 per %Sp,O2; p<0.0001). Thus, a lower hypoxic responsiveness in the narcolepsy–cataplexy group is a result of DQB1*0602 status rather than the clinical features of disease.
Hypoxic and hypercapnic sensing are processed through neuromuscular circuits resulting in an increase or decrease of tidal volume, respiratory frequency and minute ventilation (V′E). Such chemosensory reflexes operate to influence sleep apnoea, chronic obstructive pulmonary disease (COPD), heart failure, and acute adaptation to high altitude 1. A variation in chemosensitivity across various inbred rodent strains and familial clustering of ventilatory traits in humans provides a strong rationale for gene and protein isolation efforts to unravel molecular mechanisms for these traits operating in health and disease 2.
Hypocretin (orexin) is a hypothalamic neurotransmitter, which, when given intracerebroventricularly in mice, promotes both wakefulness and ventilation 3, 4. Both hypocretin knockout and hypocretin neuron-ablated mice show attenuation of respiratory excitation during fight-or-flight responses 5. Particular to chemoresponsiveness, hypocretin/orexin knockout mice have attenuated hypercapnic ventilatory responses 6; supplementation of hypocretin-1 or -2 partially restores an attenuated response to hypercapnia, while administration of hypocretin receptor-1 antagonist will reduce hypercapnic responsiveness in wild type mice 7. Post-hypoxic long-term facilitation, a physiological feature that is presumed to reduce sleep apnoea, is absent in hypocretin/orexin knockout mice 8.
The human model of hypocretin deficiency is narcolepsy with cataplexy 9, 10. This disorder is also associated with the gene marker, human leukocyte antigen (HLA)-DQB1*0602 11. This disease is also considered to be associated with a higher expression of sleep-disordered breathing 12, 13. Our primary hypothesis was that an impaired chemoresponsiveness would be present in narcolepsy–cataplexy patients who are uniformly HLADQB1*0602 positive and have low hypocretin levels <110 pg·mL−1 in comparison to control subjects without disease or cataplexy or the HLA marker who have normal levels of hypocretin (over 99% >110 pg·mL−1) 9. Results indicate an unexpected finding that the mechanism for differences between patients and controls in hypoxic responsiveness could relate to HLA marker status, rather than disease.
METHODS
Human subjects
130 patients with narcolepsy/hypocretin deficiency and/or cataplexy were prospectively identified from successive patients presenting at the Sleep Center, the Peking University People's Hospital (Beijing, China) in 2006–2007. Diagnosis of narcolepsy with cataplexy was made using International Classification of Sleep Disorders (ICSD)-II criteria 14. All patients completed a validated questionnaire predictive of cataplexy, the Center for Narcolepsy Sleep Inventory (SSI), a validated questionnaire predictive of cataplexy 15. Hypocretin deficiency was documented in 37 patients (all DQB1*0602 positive) through cerebrospinal fluid (CSF) hypocretin-1 evaluation, while the other 93 patients were selected based on DQB1*0602 positivity and the presence of cataplexy, as described in Hong et al. 16. >95% of DQB1*0602-positive narcolepsy–cataplexy patients have hypocretin deficiency 17. Demographic and polysomnography (PSG) results for the subjects are reported in table 1.
117 controls were willing local employees and college students, and were recruited and selected as age- and sex-match to the patient sample. All control subjects provided a blood sample for DQB1*0602 typing, completed a standard sleep questionnaire, and performed spirometry and ventilatory responses. 57 of the 117 controls consented to nocturnal PSG and multiple sleep latency testing (MSLT) testing (table 1).
Informed consent was obtained from patients and controls. The study was approved by the institutional review board of the People's Hospital of Beijing University (Beijing, China).
Sleep study
Overnight nocturnal PSG was followed by MSLT the next day. The overnight recording included electroencephalogram (EEG) (C3/A2 and C4/A1), chin electromyography, anterior tibialis electromyography, microphone recording for snoring, electro-oculography, ECG, nasal–oral airflow, thoracic and abdominal effort, and arterial oxygen saturation measured by pulse oximetry (Sp,O2). An apnoea was defined as the cessation of airflow at the nose and mouth lasting for ≥10 s, and hypopnoea was defined as a decrease in airflow, ribcage excursion or abdominal excursion by >50%, which was associated with an oxygen desaturation of ≥4% below the preceding baseline or with an arousal. The absence of airflow in the upper airway with and without ribcage and abdominal movement was defined as obstructive sleep apnoea and central sleep apnoea (CSA), respectively; in a mixed sleep apnoea (MSA), there were features of both central and obstructive apnoeas/hypopnoeas in the same event. The AHI was calculated as the number of apnoeas and hypopnoeas per hour of total sleep time, and further examined as per hour of rapid eye movement (REM) and non-REM time. Mean Sp,O2 and lowest Sp,O2 during sleep were also calculated.
The MSLT was performed to determine sleep latency and probe for the presence of sleep onset REM sleep (SOREM). The sleep latency was defined as the elapsed time from lights-out to the first epoch scored as sleep. The REM sleep latency was defined as the time from the beginning of sleep onset to the first epoch of REM sleep. Sleep stages of both PSG and MSLT were scored in 30-s epochs following the Rechtschaffen and Kales 18 criteria. In the (unlikely) event that patients or healthy subjects were taking drugs known to affect the MSLT, recordings of the PSG or MSLT and ventilatory testing were performed without these medications for ≥15 days.
Assessment of ventilatory responses
The studies were performed at 10:00–12:00 h. Responses to progressive hyperoxic hypercapnia were assessed using the rebreathing technique of Read 19. Patients were in the seated posture connected to the circuit, wearing a facemask. Hypoxic testing was performed using an anaesthesiology rebreathing circuit, with a carbon dioxide (CO2) absorbent, placed on the inspiratory line. This set-up resulted in a falling end-tidal CO2 value as ventilation increased. Hypoxic testing was concluded when oxygen saturation neared 70%. V′E was regressed linearly against the carbon dioxide tension (PCO2) values (hypercapnic testing) or against the fall in Sp,O2 from 90% (hypoxic testing), and responsiveness reported as the slope of the linear regression: δV′E/δPCO2 and δV′E/δSp,O2, respectively.
ΔV′E/δSp,O2 and δV′E/δPCO2 values were analysed both with and without correction by body surface area (BSA), so as to adjust to size differences due to the range among subjects.
HLA-DQB1*0602 typing and CSF hypocretin-1 evaluation
The HLA-DQB1*0602-specific codon 9 amino acid was determined at Beijing University using a previously described PCR sequence-specific primer method 20. The presence of DQB1*0602 is reported as positive and absence as negative. In a subset of 37 patients, CSF samples were collected by lumbar puncture between 10:00–13:00 h. CSF samples were frozen immediately, and subsequently kept at -80°C until measurements were made. Hypocretin-1 was measured at Beijing University using a 125I radioimmunoassay kit (Phoenix Pharmaceuticals, Belmont, CA, USA) 9. All samples were measured in duplicate, averaged and compared to standard CSF samples with known CSF hypocretin-1 levels.
Statistical analysis
Data are presented as mean±sd. Simple comparisons were performed using a Chi-squared or paired t-test, as appropriate. One-way ANOVA for repeated measures was used to compare differences with regard to end-tidal PCO2 measures over the course of hypoxic testing. Hypoxic and hypercapnic responses, as well as AHI, were log-transformed to fit a normal distribution prior to statistical analysis using paired t-tests or multivariate analysis models (actual values are reported, while p-values are derived from the transformed comparisons). Differences were considered significant at p≤0.05.
RESULTS
Patients with narcolepsy/hypocretin deficiency have increased BMI and a tendency for increased sleep-disordered breathing
Patients and age/sex-matched controls were young and most often male (table 1). As typically reported, BMI was slightly higher than in controls, although BSA values were similar. None of the patients were taking medication for narcolepsy at the time of the study. In this sample of patients, the number with apnoea and hypopnoea was increased (table 1). The prevalence of an AHI >5 was higher (16%) than in the those studied in the control group (5%); the latter prevalence is comparable to the reported value (4–5%) in older (age >30 yrs) Chinese general population 21, 22; 5% of narcoleptic, but no control subjects, had an AHI >15. With regard to the type of sleep-disordered breathing, hypopnoea and obstructive apnoeas were commonly present, accounting for 61±37% and 35±36% of the total events, respectively, and CSA and MSA were less common (1.8±8.8% and 6.8±4.6%, respectively) (table 1). While patients had lower minimum Sp,O2 sleep values than controls, the baseline and mean values of Sp,O2 during sleep did not differ.
AHI was not correlated to BMI. AHI was greater in those with narcolepsy before and after being adjusted for age, sex and BMI (adjusted AHI 2.53±4.23 versus 0.60±0.54; p<0.01). Similarly, the lowest Sp,O2 saturation in narcolepsy was still significantly lower before and after being adjusted for age, sex, BMI and AHI (adjusted lowest Sp,O2: 87.9±4.7 versus 90.6±4.7; p<0.01). In controls who underwent PSG and MSLT testing (n = 57), there was no significant difference in sleep indices during sleep with regard to HLA status; however, those HLA-DQB1*0602 positive had a lower AHI (0.21±0.42 versus 1.10±1.83; p<0.01) and higher Sp,O2 (93.2±3.4 versus 90.1±1.0%; p<0.05) values. These results provide evidence consistent with impaired control of breathing during sleep and of oxygen saturation in patients with narcolepsy–cataplexy.
Patients with narcolepsy/hypocretin deficiency have decreased ventilatory response to hypoxia but not hypercapnia
Spirometry values were within normal limits for controls and patients, and there was no difference between groups. In contrast to findings suggested by animal KO models, we found no group differences with regard to hypercapnic responsiveness, but rather found significant differences in hypoxic responsiveness (table 2 and fig. 1). Reduced hypoxic responsiveness in narcolepsy–cataplexy patients was unrelated to BMI, age and sex; but hypercapnic and hypoxic responsiveness were correlated with BSA (p<0.001). After adjustment for BSA, there remained no difference in hypercapnic responsiveness. However, hypoxic responsiveness was different between groups. During hypoxic rebreathing tests, end-tidal CO2 fell, on average, from 5.4±0.7% at 95% to 4.8±0.6% at 75% saturation (p = 0.005), indicating that the hypoxic testing was poikilocapnic. Values were higher in narcolepsy–cataplexy versus controls at most oxygen saturations (p = 0.035). For instance, at a saturation of 90%, end-tidal values for narcolepsy–cataplexy patients were 5.3±0.5% versus 5.1±0.7% for controls (p = 0.04). Despite the higher value, the slope of the hypoxic response was lower in narcolepsy–cataplexy versus controls (0.13±0.09 versus 0.19±0.13 L·min−1 per %Sp,O2; p = 0.0007).

Comparisons between controls and patients. The a and b) hypercapnic (change in minute ventilation/change in carbon dioxide tension (δV′E/δPCO2)) and c and d) hypoxic (change in minute ventilation/change in oxygen saturation (δV′E/δ Sp,O2)) response. a and c) Boxes show the quartiles, the median (—); whiskers present the 10th and 90th percentiles. b and d) Curves represent the cumulative number of cases as a percentage of the total number of cases. ***: p<0.001.
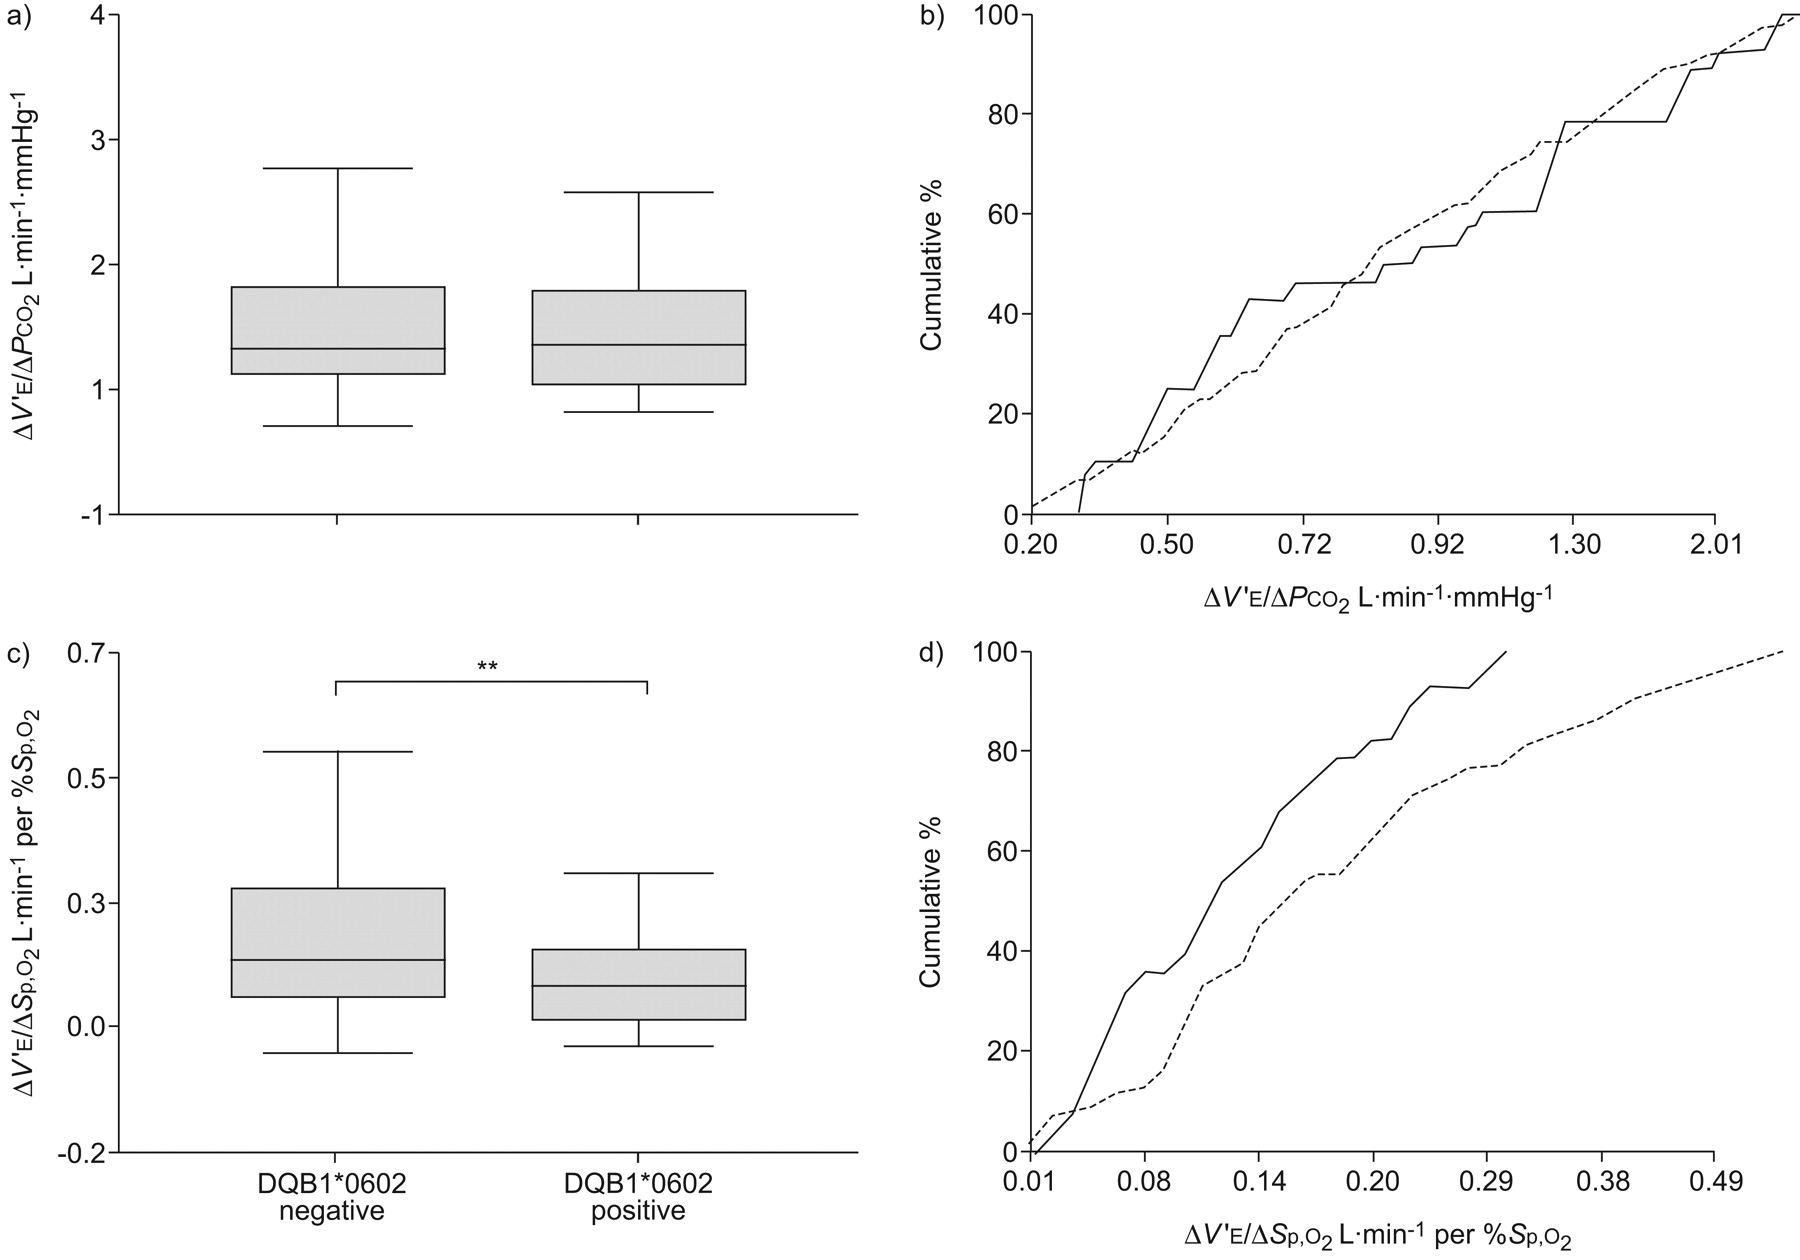
Ventilatory responses to hypoxia are decreased in relation to HLA-DQB1*0602 status, not hypocretin deficiency
As all subjects with narcolepsy–cataplexy were also HLA-DQB1*0602 positive and 22% of the control population was also positive, we considered whether HLA status explained the differences between groups. No differences between these groups were present for hypercapnic responsiveness (1.07±0.75 versus 1.03±0.74 L·min−1·mmHg−1), before or after controlling for BSA (0.64±0.42 versus 0.60±0.42 L·min−1·mmHg−1) (table 2 and fig. 2). We considered whether CO2 levels during hypoxic rebreathing explained the results since end-tidal CO2 fell, on average, from 5.4±0.6% at 95%, to 4.9±0.5% at 75% saturation (p = 0.008). However, end-tidal CO2 during testing was similar in HLA-positive versus HLA-negative controls (p = 0.65). Therefore, the slope of hypoxic responsiveness was lower in HLA-positive versus HLA-negative controls (0.13±0.08 versus 0.20±0.14 L·min−1 per %Sp,O2, p = 0.00004), an effect that remained significant after adjustment for BSA (0.078±0.04 versus 0.120±0.09 L·min−1 per %Sp,O2, p = 0.0001).
Comparisons of human leukocyte antigen (HLA) status in control subjects. The a and b) hypercapnic (change in minute ventilation/change in carbon dioxide tension (δV′E/δPCO2)) and c and d) hypoxic (change in minute ventilation/change in oxygen saturation (δV′E/δ Sp,O2)) between controls with HLA-DQB1*0602 positive (—) and negative (---). Boxes show the quartiles, the median (—); whiskers present the 10th and 90th percentiles. b and d) represent the cumulative number of cases as a percentage of the total number of cases. The y-axis values reflect real values at values >0. **: p<0.01.
Mulitivariate analysis was conducted to assess for significant covariates of hypoxia responses in the entire sample. Entered into a stepwise regression analyses were age, sex, BMI, HLA status, AHI, lowest Sp,O2, hyperecapnic responsiveness, and hypocretin deficiency. Hypoxia responses were significantly correlated with HLA status (independent of hypocretin status, and without interaction by sex) (p<0.00001), and positively correlated hypercapnia response (p<0.001). In subjects with available sleep recordings, hypoxic responsiveness was strongly correlated with DQB1*0602 status (p<0.0001) and weakly but significantly correlated with hypercapnic responsiveness (p = 0.01) and AHI (p = 0.05).
DISCUSSION
The novel findings presented in this study are: 1) a population difference between patients with narcolepsy–cataplexy and age-matched controls with regard to hypoxic chemosensitivity; and 2) an association between DQB1*0602 and acute ventilatory responsiveness to progressive hypoxia. While narcolepsy–cataplexy patients do have different sleep values, AHI and lowest arterial ozygen saturation (Sa,O2) were not defining factors for the group differences in ventilatory chemosensitivity.
Contrary to results obtained in hypocretin gene knockout mice, hypercapnia responses were not affected by disease or marker state. Unlike knockout mice, where both the gene and protein are absent, in patients with narcolepsy, hypocretin-1 is often detected at some level in the CSF 9. We suspect that the effects of hypocretin on chemoresponsiveness, if present, are below a threshold for detection.
Our findings implicate DQB1*0602, or a gene located nearby, as a regulator of hypoxic responses. While DQB1*0602 is an allele present in all patients with narcolepsy and cataplexy, it is not a disease-defining HLA maker, as it is present in the healthy populations 23. Few studies hint at potential relationships between immune markers and hypoxia. Microsatellite markers within the HLA region are reported to correlate with a blunted response to hypoxia in COPD with type II respiratory failure 24 and with the development of altitude-induced pulmonary oedema 25, although correlations specific for the DQB1*0602 allele were not reported in these studies. Intercross studies of C3H/HeJ (C3) and C57BL/6J (B6) mice have mapped potential loci for the hypoxic effect and its modulation by hypercapnia 26; however, these regions are not syntenic to human HLA gene regions. Glomus cell quantity differ across mice strains 27, and expression studies between high- and low-responder strains in carotid bodies suggest a number of potential candidates 28–30, but none reported have direct connections to immune function. With chronic hypoxic exposure, there is activation of the hypoxic inducible factor pathway in the carotid body 31, and hypoxia-inducible factor (HIF) is upstream to many cellular pathways, including some that affect cell-mediated immunity. An association of DQB1*0602 with hypoxic responsiveness might suggest a role for HLA class II molecules in the pathways for oxygen sensing and responses, but additional studies are needed to identify the protein and its function. The region where this allele resides contains genes not only for immune-related molecule, but also for peptide transporters, C450 oxygen-binding metabolic enzymes and transcription factors.
With regard to the impact of sleep-disordered breathing, narcolepsy–cataplexy patients exhibited generally more occurrences, as measured by AHI, and severity, as measured by Sa,O2. These findings establish with greater confidence the contention that patients with narcolepsy could exhibit a higher incidence of sleep-disordered breathing disorders than in the general population 32, 33. The prior literature reported on an older patient sample compared to expected norms, suggested the association might result from obesity, as hypocretin is a factor in metabolism 34. In the present study patients were young, and the increased AHI and decreased minimal oxygen saturation were independent of the range of BMI. This correlation of more events with disease status may be independent of HLA status, as we found a decrease in indices for sleep-disordered breathing in those positive for DQB1*0602. There may, however, be more complexity in the relations among sleep regulation, HLA status and sleep. Two prior reports with large numbers of subjects found significant associations between SOREM during an MSLT and decreased lowest nocturnal oxygen saturation during the prior nocturnal PSG: one clinic-based study in patients with sleep apnoea (n = 1,145) and another in healthy controls (n = 556) 35, 36. The community study reported multiple SOREMs to be associated with DQB1*0602 in males 36. Therefore, the presence of sleep-disordered breathing could be the result of something more than HLA status.
The present study was conducted in a Chinese population, and hence could be ethnically specific. As a limitation, one could consider that this might have reduced genetic heterogeneity, that may influence chemosensitivity, and resulted in a haplotype inheritance that enhanced the likelihood of finding significant correlations. Nonetheless, this study is one of the numerically larger studies of human chemosensitivity, in the healthy population, so it is possible but unlikely that significance is false. We considered whether the poikilocapnic nature of the hypoxic testing resulted in group differences, but considered this unlikely for two reasons. First, poikilocapnic and isocapnic hypoxic responses are similarly informative when measured at the same time in previous studies in humans 37. Second, as end-tidal CO2 values were generally higher in patients versus controls, one would expect the interaction to enhance rather than blunt responses in the patient group. Third, the ventilatory response to CO2 did not associate with disease or marker status, making it less likely that interactions resulted in a spurious finding. Studies in other ethnic groups and of related chemosensitivity traits, such as hypoxic short-term facilitation, are needed.
In conclusion, we found differences in hypoxic responsiveness between controls and HLA-DQB1*0602 narcolepsy patients with cataplexy, while hypercapnic responsiveness was unrelated to disease or hypocretin status. Hypoxic sensitivity correlated weakly with higher AHI values. However, AHI value per se did not explain the hypoxic response differences. An association with reduced hypoxic responsiveness was found to DQB1*0602 status in the healthy, unaffected subjects, and thus explains the difference in hypoxic responsiveness between groups. We propose a novel effect of HLA, or of a gene polymorphism located nearby, on the well-known interindividual variation in hypoxic responsiveness in the Chinese population.
Acknowledgments
The authors would like to thank B. Morgan (University of Wisconsin–Madison, Madison, WI, USA) for her review of the manuscript.
Footnotes
Support Statement
The study was supported by research grants from National Natural Science Foundation of China (NSFC) (C30770938, C30300120) and Ministry of Education China (985-2-084-113) (to F. Han), National Institutes of Health grant NIH 23734 (to E. Mignot), and the VA Research Service (to K.P. Strohl). E. Mignot is an Howard Hughes Medical Institute Investigator.
Statement of Interest
A statement of interest for K.P. Strohl can be found at www.erj.ersjournals.com/misc/statements.dtl
- Received November 3, 2009.
- Accepted January 11, 2010.
- ©2010 ERS
REFERENCES


