


Abstract
Recent studies have suggested that overexpression of the multidrug transporter P-glycoprotein (P-gp) in the hippocampal region leads to decreased levels of antiepileptic drugs and contributes to pharmacoresistance that occurs in a subset of epileptic patients. Whether P-gp expression and function is affected in other brain regions and in organs that are involved in drug metabolism is less studied. Therefore, we investigated P-gp expression in different brain regions and liver of chronic epileptic rats, several months after electrically induced status epilepticus (SE), using Western blot analysis. P-gp function was determined by measuring phenytoin (PHT) levels in these brain regions using high-performance liquid chromatography, in the absence and presence of a P-gp-specific inhibitor, tariquidar (TQD). In addition, the pharmacokinetic profile of PHT was determined. PHT concentration was reduced by 20 to 30% in brain regions that had P-gp overexpression (temporal hippocampus and parahippocampal cortex) and not in brain regions in which P-gp expression was not changed after SE. Inhibition of P-gp by TQD significantly increased the PHT concentration, specifically in regions that showed P-gp overexpression. Despite increased P-gp expression in the liver of epileptic rats, pharmacokinetic analysis showed no significant change of PHT clearance in control versus epileptic rats. These findings show that overexpression of P-gp at the blood-brain barrier of specific limbic brain regions causes a decrease of local PHT levels in the rat brain.
Resistance to medical therapy (pharmacoresistance) occurs in 30 to 50% of all epilepsy patients and is one of the major problems in the treatment of epilepsy (Loscher and Schmidt, 2004). Increasing evidence (Rizzi et al., 2002; Marchi et al., 2004; Rambeck et al., 2006; van Vliet et al., 2006) indicates that overexpression of multidrug transporters in the epileptic brain may play an important role. These transporters are not exclusively expressed in the brain but also in organs that are involved in drug excretion and adsorption (liver, kidney, and intestine) and at blood-tissue barriers (placenta, testis). They are thought to have a protective function against toxic substances. In brain, most transporters are expressed in endothelial cells at the luminal side of blood vessels (Miller et al., 2000) and transport a variety of molecules, including commonly used antiepileptic drugs (AEDs) (Tishler et al., 1995; Potschka and Loscher, 2001a; Potschka et al., 2001, 2002, 2003; Rizzi et al., 2002; Sills et al., 2002; Clinckers et al., 2005). Overexpression of multidrug transporters at the blood-brain barrier has been associated with decreased extracellular AED levels in the brain of chronic epileptic rats (van Vliet et al., 2006) as well as in humans (Marchi et al., 2005a; Rambeck et al., 2006). Until now, most attention has been paid to drug transporter expression and function in temporal lobe or hippocampus (Rizzi et al., 2002; van Vliet et al., 2004a,b, 2005; Volk et al., 2004; Volk and Loscher, 2005). Whether P-gp expression and function are affected in other brain regions and in organs that are involved in drug metabolism is less known. To determine whether changes in P-gp expression affected local drug distribution in brain and/or pharmacokinetics, we investigated P-gp expression in different brain regions and in the liver of chronic epileptic rats and measured phenytoin (PHT) levels in plasma and brain in a rat model for temporal lobe epilepsy, several months after electrically induced status epilepticus. In addition, we determined the plasma pharmacokinetics of PHT in control and chronic epileptic rats using nonlinear mixed-effects analysis.
Materials and Methods
Experimental Animals. Adult male Sprague-Dawley rats (Harlan CPB Laboratories, Zeist, The Netherlands) weighing 500 to 600 g were used in this study, which was approved by the University Animal Welfare committee. The rats were housed individually in a controlled environment (21 ± 1°C; humidity, 60%; lights on, 8:00 AM to 8:00 PM; food and water available ad libitum).
Electrode Implantation and Status Epilepticus Induction. Rats (n = 42) were anesthetized with an i.m. injection of ketamine (57 mg/kg; Alfasan, Woerden, The Netherlands) and xylazine (9 mg/kg; Bayer AG, Leverkusen, Germany), and placed in a stereotactic frame. To record hippocampal EEG, a pair of stainless steel electrodes (70-μm wire diameter, tips 0.8 mm apart) were implanted into the left dentate gyrus under electrophysiological control, as described previously (Gorter et al., 2001). A pair of stimulation electrodes was implanted in the angular bundle. Two weeks after recovery from surgery, each rat was transferred to a recording cage (40 × 40 × 80 cm) and connected to a recording and stimulation system (NeuroData Digital Stimulator; Cygnus Technology, Inc., Delaware Water Gap, PA) with a shielded multistrand cable and electrical swivel (Air Precision, Le Plessis Robinson, France). One week later, rats underwent tetanic stimulation (50 Hz) of the hippocampus in the form of a succession of trains of pulses every 13 s. Each train had a duration of 10 s and consisted of biphasic pulses (pulse duration, 0.5 ms; maximal intensity, 500 μA). Stimulation was stopped when the rats displayed sustained forelimb clonus and salivation for minutes, which usually occurred within 1 h (average stimulation time, 63 ± 5 min; range, 24–90 min). Immediately after termination of the stimulation, periodic epileptiform discharges occurred at a frequency of 1 to 2 Hz and were accompanied by behavioral and EEG seizures (status epilepticus) that lasted for several hours. Control rats (n = 21) were implanted with electrodes and handled like experimental rats, but they were not stimulated.
EEG Monitoring. Continuous EEG recordings (24 h/day) were started in the chronic seizure period (3–4 months after status epilepticus induction), to determine seizure frequency and duration. Differential EEG signals were amplified (10×) via a field effect transistor that connected the headset to a differential amplifier (20×; CyberAmp; Axon Instruments, Burlingame, CA), filtered (1–60 Hz), and digitized by a computer. A seizure detection program (Harmonie; Stellate Systems, Montreal, Canada) sampled the incoming signal at a frequency of 200 Hz per channel. All EEG recordings were visually monitored and screened for seizure activity on a daily basis until the rats were killed.
Drugs. Phenytoin sodium (5,5-diphenylhydantoin sodium salt; Katwijk Chemie, Katwijk, The Netherlands) was dissolved in distilled water alkalinized with NaOH and administered either as a 50 mg/kg i.p. dose (distribution experiment) or infused in 5 min as a 40 mg/kg i.v. dose (pharmacokinetic experiment). Tariquidar (XR9576.14; Xenova Limited, Slough, Berkshire, UK) was dissolved in 5% dextrose solution and orally administered (12 mg/kg). The administration volume was 3 ml/kg. This dose was based on previous reports showing reversal of P-gp-mediated resistance in mice and rats (Mistry et al., 2001; van Vliet et al., 2006).
Phenytoin Distribution. Phenytoin brain/plasma ratios were measured in control and chronic epileptic rats that received PHT only (50 mg/kg i.p.) and were killed 1 (control, n = 6; chronic epilepsy, n = 6) or 2.5 (control, n = 5; chronic epilepsy, n = 5) h after PHT administration, when PHT plasma levels are considered to be within the therapeutic range (10–20 μg/ml). We also included a group of chronic epileptic rats that were pretreated with tariquidar (TQD) (12 mg/kg p.o.) 24 and 4.5 h before they received PHT (50 mg/kg i.p., n = 4) and that were killed 1 h after PHT was administered. The following brain regions were dissected (ipsilateral to the stimulated site): septal and temporal hippocampus, parahippocampal cortex (which included the entorhinal cortex and parts of the perirhinal and posterior piriform cortex), olfactory bulb, and cerebellum. The parahippocampal cortex was removed by incision at the ventrocaudal part underneath the rhinal fissure until approximately 5 mm posterior to bregma. All material was frozen on dry ice and stored at –80°C until use. Samples were weighed and homogenized in methanol/water (60:40, v/v) and processed for HPLC as described previously (van Vliet et al., 2006).
Phenytoin Analysis in Blood. Blood for PHT analysis was collected directly after decapitation (homogenate experiment; see above) or taken from the femoral artery (pharmacokinetic experiment, see below). Blood was centrifuged at 3000 rpm for 10 min to obtain plasma and processed for HPLC as described previously (van Vliet et al., 2006). The extraction recoveries were >95%. Limit of detection was 0.38 μg/ml (variation coefficient <10%), and the assay was calibrated in the range from 0.38 to 48 μg/ml.
P-gp Expression in Brain and Liver. Western blots were made to determine P-gp levels in the contralateral homotypic areas as described for the homogenate experiment and also in the liver. The various brain regions and liver were homogenized in lysis buffer containing (per 20 ml) 200 μl of 1 M Tris, pH 8.0; 1 ml of 3 M NaCl; 2 ml of 10% Nonidet P-40; 4 ml of 50% glycerol; 800 μl of sodium orthovanadate (10 mg/ml); 200 μl of 0.5 M EDTA, pH 8.0; 400 μlof protease inhibitors; 200 μl of 0.5 M NaF; and 11.2 ml of H2O. Fifty micrograms of total protein per lane, as determined using bicinchoninic acid method (Smith et al., 1985), was separated by SDS-polyacrylamide gel electrophoresis (7.5% acrylamide) and transferred to nitro-cellulose by electroblotting (Transblot SD; Bio-Rad, Hercules, CA). Blots were incubated with primary antibodies (monoclonal mouse anti-C219, 1:500; Alexis Biochemicals, San Diego, CA; monoclonal mouse anti-β-actin, clone AC-15, 1:50,000; Sigma-Aldrich, St. Louis, MO) and the secondary antibody, anti-mouse labeled with horseradish peroxidase (1:2500; DakoCytomation Denmark A/S, Glostrup, Denmark). Immunoreactivity was visualized with lumi-light plus Western blotting substrate (Roche Diagnostics, Mannheim, Germany), and the blots were digitized using a Luminescent Image Analyzer, LAS-3000 (Fuji Film, Tokyo, Japan). The optical density of each sample was measured using Scion Image (release beta 3b; Scion Corporation, Frederick, MD) software. For each sample, the optical density of the P-gp was calculated relative to the optical density of β-actin. All data were normalized to control values (control rats treated with PHT).
Statistical Comparisons. All data are expressed as mean ± S.E.M. Statistical comparisons were performed using two-way ANOVA followed by a Dunnett's t test. p < 0.05 was assumed to indicate a significant difference.
Pharmacokinetics of Phenytoin. To determine PHT pharmacokinetics, additional groups of chronic epileptic rats (n = 6) and control rats (n = 10) were cannulated under ketamin/xylazin anesthesia. The cannulas were inserted into the right jugular vein for PHT administration and into the right femoral artery for blood sampling. The arterial cannula consisted of 4.5-cm polyethylene tubing (Portex Limited, Hythe, UK; i.d. 0.28; o.d. 0.61 mm) heat-sealed to 18 cm polyethylene tubing (Portex Limited; i.d., 0.58; o.d., 0.96 mm). The venous cannula consisted of 12-cm polyethylene tubing (i.d., 0.58; o.d., 0.96 mm). The cannulas were s.c. tunneled to the back of the neck. The cannulas were filled with 0.9% saline containing heparin (50 IU/ml) to prevent blood clotting. One day after surgery, 40 mg/kg PHT was infused i.v. (0.1 ml/min) for 5 min. Arterial blood samples (100 μl/sample) were collected in heparinized tubes before and 5, 7.5, 10, 12.5, 15, 20, 30, 40, 60, 90, 120, and 180 min after PHT administration to determine PHT plasma concentrations. Blood was centrifuged at 3000 rpm for 10 min, and plasma was separated for drug analysis.
The plasma concentration-time profile of PHT could be described with a two-compartment model (Fig. 1), containing a blood compartment connected to a virtual tissue compartment. The model was designed and validated for adequate description of the pharmacokinetic response in plasma without identifying the anatomical equivalents of compartment 2 (Della Paschoa et al., 1998). A bolus injection of PHT could be given to compartment 1 from where PHT was cleared with first order Michaelis-Menten kinetics. The following set of coupled differential equations describes the time course of the PHT concentrations C1 and C2 in compartments 1 and 2 as a function of injection, clearance, and exchange: 
 R is the amount of infused PHT/5 min into V1 (distribution volume). Vmax is the maximum rate of PHT elimination, and Km is the Michaelis-Menten constant; based on previous experiments, Km was set to 5.9 μg/ml (Della Paschoa et al., 1998). The forward and backward transfer rate constants (k12 and k21) describe the exchange of PHT between the compartments.
The parameters of the PHT kinetics were estimated using nonlinear mixed-effects modeling in NONMEM software (version V; NON-MEM Project Group, University of California, San Francisco, CA). The population analysis approach, which takes into consideration both intraindividual variability as well as interindividual variability (Sheiner and Grasela, 1991), was undertaken using the first-order conditional estimation method with η-ϵ interaction (Wahlby et al., 2001). Goodness-of-fit was analyzed using minimum objective function value (OFV) and assessment of parameter correlation. Visual inspection concerned two types of diagnostic plots. First, the data of individual observations versus individual or population predictions should be randomly distributed around the line of identity. Second, the weighted residuals versus time or population predictions should be randomly distributed around zero. A reduction of >10 units in OFV was considered as a significant improvement of the fit (likelihood ratio test, p < 0.001). A covariate analysis was used to determine whether statistically significant differences in the pharmacokinetic parameters between control and epileptic rats existed. Using the likelihood ratio test, the significance level was set at α = 0.01, which corresponds to a reduction of 6.6 units in OFV.

The pharmacokinetic model that describes the concentration versus time profile of phenytoin in plasma after bolus injection. This model comprises two compartments; a blood compartment (compartment 1) with PHT concentration C1 and a lumped tissue compartment (compartment 2) with PHT concentration C2. Bolus injection in compartment 1 is described by R as the total amount of PHT infused into volume V1 in 5 min. Elimination of PHT occurs only from compartment 1 according to first order Michaelis-Menten kinetics with a maximum rate of Vmax and a Michaelis-Menten constant Km set to 5.9 μg/ml (Della Paschoa et al., 1998). The exchange between the compartments is described by the forward and backward rate constants k12 and k21.
Results
Spontaneous Seizure Activity. All chronic epileptic rats had frequent daily seizures. The mean seizure frequency was 15 ± 5 seizures/day in the week before the rats were killed. The mean seizure duration was 65 ± 5s.
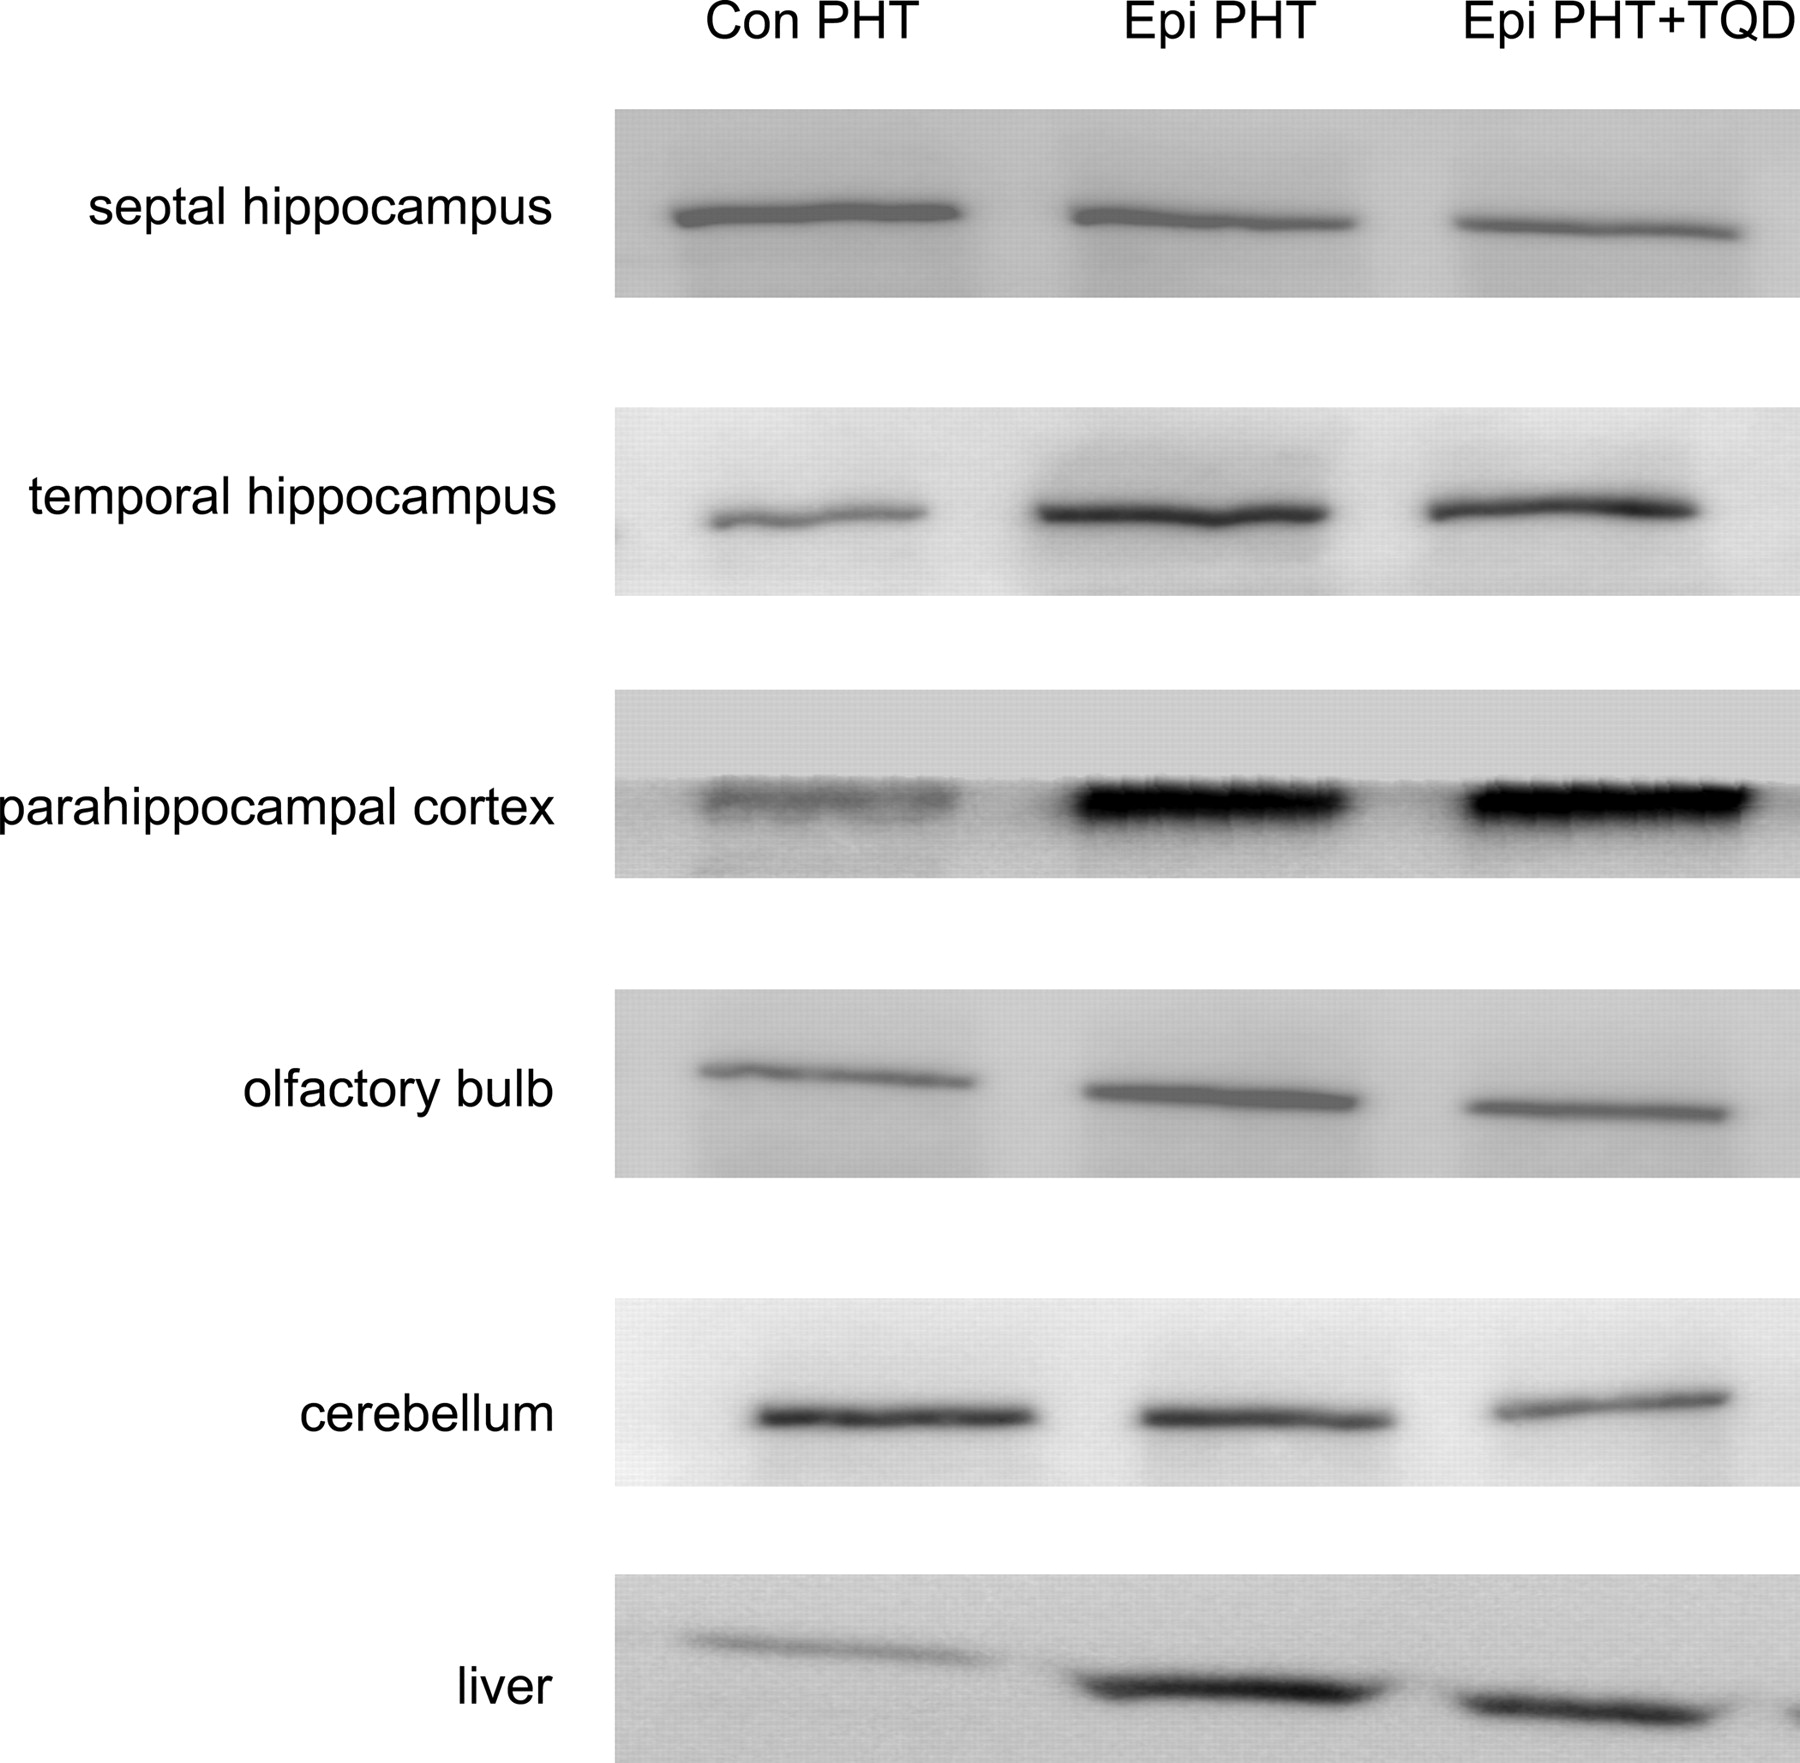
P-gp Expression. Western blots were made to quantify P-gp levels in specific brain regions of control and chronic epileptic rats that received only PHT and also for chronic epileptic rats that received PHT + TQD (Fig. 2). Table 1 shows that P-gp levels were significantly increased in the temporal hippocampus and in the parahippocampal cortex of all chronic epileptic rats as compared with control rats. Other brain regions (septal hippocampus, olfactory bulb, and cerebellum) in these epileptic rats were similar to control values. Since P-gp is also expressed in liver and might affect the pharmacokinetic profile of PHT in the blood compartment, P-gp expression was also determined in this organ. P-gp expression was increased (2.1 ± 0.7 times control value) in the liver of chronic epileptic rats compared with controls.
P-gp expression in brain determined by Western blot
The table shows the normalized (control rats set to 1) mean ratio (±S.E.M.) of the optical density of the P-gp relative to ß-actin expression measured on the Western blot for chronic epileptic rats treated with PHT and chronic epileptic rats treated with PHT + TQD.
Phenytoin Levels in Plasma and Brain. To determine whether PHT distribution changed in various brain regions of chronic epileptic rats, the brain/plasma ratio was measured in both control and chronic epileptic rats that received PHT only and in rats that received PHT + TQD. Interestingly, the brain/plasma ratio of PHT significantly decreased in chronic epileptic rats, specifically in brain regions that had P-gp overexpression: the temporal hippocampus and parahippocampal cortex (Tables 2 and 3). Since PHT plasma levels were within the considered therapeutic range (10–20 μg/ml) and not significantly different between the groups, this indicates that the level of PHT present in these brain regions of epileptic rats was lower compared with control rats. Inhibition of P-gp by TQD significantly increased PHT brain/plasma ratio, particularly in regions that had P-gp overexpression (temporal hippocampus and parahippocampal cortex, Table 2). In regions that did not have P-gp overexpression (septal hippocampus, olfactory bulb, cerebellum), the PHT brain/plasma ratio was not different from control values. PHT plasma levels did not change in these rats (11.0 ± 2.0 μg/ml).
PHT brain/plasma ratio 1 h after PHT injection determined by HPLC
Phenytoin brain/plasma ratio (mean ± S.E.M.) in control rats (PHT), chronic epileptic rats (PHT), and chronic epileptic rats treated with tariquidar (PHT + TQD) 1 h after PHT bolus injection. Plasma levels are given in the bottom row.
PHT brain/plasma ratio 2.5 h after PHT injection determined by HPLC
Phenytoin brain/plasma ratio (mean ± S.E.M.) in control and chronic epileptic rats 2.5 h after PHT bolus injection. Plasma levels are given in the bottom row.

Western blots of P-gp from various brain regions and liver. P-gp expression increased in the temporal hippocampus, parahippocampal cortex, and liver of chronic epileptic rats (epi), compared with control rats (con). P-gp expression was not changed in the septal hippocampus, olfactory bulb, and cerebellum.
Phenytoin Pharmacokinetics. To determine the pharmacokinetics of PHT in control and epileptic rats, a two-compartment model with first order Michaelis-Menten elimination from the central (blood) compartment was used as described under Materials and Methods. Figure 3A shows the observed data and the fit of an individual rat and indicates that the model adequately describes the PHT response after a bolus injection at time 0. The observed PHT concentrations as a function of time of all control and epileptic rats are displayed in Fig. 3B. The population pharmacokinetics of control and epileptic rats are shown as solid and dotted lines in Fig. 3B. Covariate analysis on population data of control and epileptic rats did not detect a difference in any of the estimated pharmacokinetic parameters (Table 4), as evidenced by performing the likelihood ratio test. This indicates that PHT plasma concentrations were comparable between control and epileptic rats and that local P-gp expression changes (e.g., in brain or liver) do not influence PHT kinetics.
Population parameter estimates of PHT pharmacokinetics
Parameter fits (mean ± S.E.M.) of the pharmacokinetic model of PHT plasma concentration after bolus injection (Fig. 1; for details, see Materials and Methods). V1 is the distribution volume into which PHT was injected for 5 min. Vmax represents the maximum elimination rate of PHT from V1; k12 and k21 are the forward and backward transfer rates between compartments 1 and 2. The Michaelis-Menten constant (Km, Fig. 1) was set to 5.9 μg/ml on the basis of previous experiments. The estimated pharmacokinetic parameters between control and chronic epileptic rats using the likelihood ratio test (see Materials and Methods) were not different. The concentration-time curves after bolus injection that can be constructed from these parameters are illustrated in Fig. 3B.
Discussion
The most important finding of this study is that reduced PHT levels as observed in the ventral hippocampus and parahippocampal cortex of chronic epileptic rats were associated with local P-gp overexpression and could specifically be increased via P-gp inhibition. In brain regions that did not have P-gp overexpression, PHT levels were not different and were not sensitive to TQD treatment. Despite P-gp overexpression in the liver of epileptic rats, PHT pharmacokinetics in plasma did not change.
P-gp expression was increased in the epileptic rat brain in ventral limbic brain regions (temporal hippocampus, and parahippocampal cortex, including entorhinal, perirhinal, and piriform cortex). Increased expression of P-gp has been described before in various epilepsy models (Potschka and Loscher, 2002; Rizzi et al., 2002; van Vliet et al., 2004b; Volk et al., 2004; Volk and Loscher, 2005) as well as in temporal lobe epilepsy patients (Aronica et al., 2004). We show in the present study that the overexpression of P-gp is region specific and restricted to the ventral hippocampus and parahippocampal cortex. P-gp expression did not change in the septal hippocampus, olfactory bulb, and cerebellum. Overexpression of P-gp seems to be correlated with seizure activity since the brain regions in which we observed P-gp overexpression are involved in seizure generation and/or seizure spread. This is similar to the observation by Kwan et al. (2002), who showed increased expression of multidrug resistance genes in the regions involved in audiogenic (induced) seizure activity (midbrain and cortex) in the genetically epilepsy-prone rat.
Changes in the permeability of the blood-brain barrier may also contribute to P-gp overexpression. We recently showed that blood-brain barrier permeability is increased during epileptogenesis and in chronic epilepsy when serum albumin can enter specific limbic brain regions (van Vliet et al., 2007). Increased P-gp expression nicely overlapped those regions in which increased BBB permeability was found in our previous study (van Vliet et al., 2007). Overexpression of multidrug transporters could therefore be induced by the passive influx of various serum-derived substances (e.g., albumin or other blood components) that occur as a result of BBB dysfunction. Since these substances do not enter the brain under normal circumstances, the up-regulation of multidrug transporters may act as a compensatory mechanism to protect the brain against these serum-derived proteins. As a consequence, this might contribute to decreased PHT levels.

Pharmacokinetic profile of phenytoin. A, observed data and fitted curve of an individual rat indicate that the two-compartment model (Fig. 1) sufficiently described changes of PHT concentration with time after 5 min i.v. infusion of 40 mg/kg PHT. B, concentration-time profiles for control and epileptic rats predicted by the population pharmacokinetic estimates are shown as solid lines (controls, continuous line, circles, n = 10; chronic epileptic rats, dotted line, triangles, n = 6). Covariate analysis indicated that the plasma pharmacokinetics of control and chronic epileptic rats were not significantly different (for parameters of the fit, see Table 4).
Overexpression of P-gp in liver may also be induced by serum components, the expression of which might have changed epileptic rats (Tang et al., 2001). Moreover, changes in hormonal regulation associated with epilepsy (Hamed et al., 2005; Morris and Vanderkolk, 2005) might also induce P-gp in liver as has been shown in a hyperthyroid rat model (Nishio et al., 2005).
The involvement of P-gp in AED distribution was shown by coadministration of PHT and the P-gp inhibitor TQD; P-gp inhibition significantly increased PHT brain levels (even above control values) in regions with P-gp overexpression. In other regions (with low P-gp expression), PHT levels remained unchanged. The fact that PHT brain levels in epileptic rats increased even above control values during TQD treatment may be due to increased PHT influx during P-gp inhibition, together with increased albumin entry as a result of BBB dysfunction (van Vliet et al., 2007). Since PHT also easily binds to albumin, it can accumulate in regions with a compromised BBB function.
P-gp expression is not increased in all epileptogenic regions; e.g., P-gp expression in the septal hippocampus of chronic epileptic rats was similar to that in control rats. This may explain why pharmacosensitive and pharmacoresistant epilepsy patients exhibit similar side effects to AEDs, which is in accordance with the observation that raising AED plasma levels will ultimately lead to cytotoxic effects, most likely in regions that exhibit “normal” P-gp expression. In addition, the lack of overexpression should be taken into account when strategies will be used that aim at lowering the P-gp expression and/or reducing P-gp function since this will compromise its protective function.
TQD is one of the most potent, selective, and effective modulators of P-gp (Mistry et al., 2001), and in vitro and in vivo reversal of P-gp mediated multidrug resistance in cancer has been observed when TQD was given together with various chemotherapeutic drugs in mice (Mistry et al., 2001). Moreover, inhibition of P-gp improved seizure control in phenytoin and phenobarbital treated chronic epileptic rats (Brandt et al., 2006; van Vliet et al., 2006). Therefore, the application of multidrug transporter inhibitors in combination with AEDs could be a useful therapy for pharmacoresistant patients. Until now, two clinical epilepsy case studies reported improvement of seizure control in two intractable patients when verapamil (a weak and nonspecific P-gp inhibitor, which also effects calcium channels) was added to AED therapy (Summers et al., 2004; Iannetti et al., 2005). We need to gain more insight into the risks and benefits of the use of multidrug transporters inhibitors. The use of TQD may bear a potential risk since harmful substances can enter the brain when multidrug transporters are inhibited. Since P-gp is also present in other organs, inhibition of P-gp function could also lead to toxicity in these organs. Recently, a study in nonsmall cell lung cancer patients was discontinued due to a higher proportion of adverse effects in the TQD group (Pusztai et al., 2005).
Since overexpression of P-gp was evident in the liver of chronic epileptic rats, one might expect differences in clearance of PHT. However, the pharmacokinetic profile of PHT in plasma was not different between control and chronic epileptic rats. Apparently, the enhanced excretion from the liver by P-gp is not sufficient to change the time-plasma concentration profile and does not influence the PHT concentration in this pharmacokinetic experiment (∼10 μg/ml; therapeutic range, 10–20 μg/ml). Although we did not observe changes in kinetics during the 3 h that were studied after PHT administration, we cannot exclude that P-gp overexpression in the liver results in a decreased PHT plasma level during chronic treatment. However, in a previous study, the PHT plasma levels were not different in epileptic and control rats after 1 week of treatment with PHT (van Vliet et al., 2006). Therefore, it is not surprising (given the difference in size of the brain and liver) that overexpression of P-gp at the bloodbrain barrier also does not significantly affect the plasma pharmacokinetics of PHT.
The concentration profile of PHT in plasma is sufficiently described by the two-compartment model, which has been extensively validated (Della Paschoa et al., 1998). The main aim was to accurately evaluate PHT plasma levels so that the plasma/brain ratio could be interpreted. Since the virtual tissue compartment (two) does not exclusively reflect the brain, the model can not be used to predict brain levels of PHT. Instead of modeling the PHT brain levels, we measured PHT brain levels at two different time points after injection (1 and 2.5 h) using HPLC. This analysis revealed a significantly reduced brain/plasma ratio in chronic epileptic rats at both time points, specifically in regions that had P-gp overexpression. This observation, in combination with the fact that absolute PHT plasma values and PHT pharmacokinetics did not change in these rats and that P-gp inhibition increased PHT levels, suggests that P-gp plays an important role in PHT distribution at the level of the blood-brain barrier, as has been proposed previously in animal studies (Potschka and Loscher, 2001a,b; Rizzi et al., 2002) as well as in humans (Marchi et al., 2005b; Rambeck et al., 2006).
In conclusion, the present study indicates that overexpression of P-gp at the blood-brain barrier of specific limbic brain regions, rather than pharmacokinetic alterations in plasma, causes a decrease of local PHT levels in the rat brain. Whether P-gp also plays a role in the distribution of other AEDs is presently under investigation.
Acknowledgments
We thank M.C. de Rijke and W.E. Dieters (Epilepsy Institute of the Netherlands, Heemstede, The Netherlands) for technical assistance with phenytoin analysis in plasma and brain samples; M. Danhof, K.B. Postel-Westra, and G. Santen (Leiden/Amsterdam Center for Drug Research, Leiden, The Netherlands) for advice and technical assistance with pharmacokinetic analysis; and J. Waterfall (Xenova Limited) for providing tariquidar.
Footnotes
-
E.A.v.V. is supported by a Lopes da Silva fellowship from the Epilepsy Institute of the Netherlands. This study was also partly supported by Nationaal Epilepsie Fonds Grant NEF03-03 (to J.A.G.).
-
Article, publication date, and citation information can be found at http://jpet.aspetjournals.org.
-
doi:10.1124/jpet.107.121178.
-
ABBREVIATIONS: AED, antiepileptic drug; P-gp, P-glycoprotein; PHT, phenytoin; TQD, tariquidar; HPLC, high-performance liquid chromatography; ANOVA, analysis of variance; OFV, objective function value; BBB, blood-brain barrier.
- Received February 9, 2007.
- Accepted March 27, 2007.
- The American Society for Pharmacology and Experimental Therapeutics


