


Abstract
Nevirapine treatment can cause a skin rash. We developed an animal model of this rash and determined that the 12-hydroxylation metabolic pathway is responsible for the rash, and treatment of animals with 12-OH-nevirapine also leads to a rash. In the present study, we investigated the specificity of lymphocytes in nevirapine-induced skin rash. Brown Norway rats were treated with nevirapine or 12-OH-nevirapine to induce a rash. Lymph nodes were removed, and the response of lymphocytes to nevirapine and its metabolites/analogs was determined by cytokine production (enzyme-linked immunosorbent assay, enzyme-linked immunosorbent spot assay, and Luminex) and proliferation (alamar blue assay). Subsets of lymphocytes were depleted to determine which cells were responsible for cytokine production. Lymphocytes from animals rechallenged with nevirapine proliferated to nevirapine, but not to 12-OH-nevirapine or 4-chloro-nevirapine. They also produced interferon-γ (IFN-γ) when exposed to nevirapine, significantly less when exposed to 4-chloro-nevirapine, and very little when exposed to 12-OH-nevirapine, even though oxidation to 12-OH-nevirapine is required to induce the rash. Moreover, the specificity of lymphocytes from 12-OH-nevirapine-treated rats was the same, i.e., responding to nevirapine more than to 12-OH-nevirapine, even though these animals had never been exposed to nevirapine. A Luminex immunoassay showed that a variety of other cytokines/chemokines were also produced by nevirapine-stimulated lymphocytes. CD4+ cells were the major source of IFN-γ. The specificity of lymphocytes in activation assays cannot be used to determine what initiated an immune response. This has significant implications for understanding the evolution of an immune response and the basis of the pharmacological interaction hypothesis.
Nevirapine (NVP), marketed under the trade name Viramune (Boehringer Ingelheim GmbH, Ingelheim, Germany), is a non-nucleoside reverse transcriptase inhibitor used in the treatment of human immunodeficiency virus infections. Although effective, its use has been limited because of its propensity to cause skin rash and liver toxicity. In patients, skin rashes vary from mild erythematous, maculopapular rashes to more severe Stevens-Johnson syndrome or toxic epidermal necrolysis (Warren et al., 1998; Fagot et al., 2001). Our group discovered a novel animal model of NVP-induced skin rash in rats. The characteristics of NVP-induced skin rash in Brown Norway rats are very similar to the milder rashes that occur in humans, which suggests that the mechanisms are very similar. Specifically, in both humans and rats there is a 2- to 3-week delay between starting the drug and the onset of rash, and on re-exposure, symptoms are more severe and accelerated (Shenton et al., 2003; Taiwo, 2006). Females are more susceptible to developing rash than males in both Brown Norway rats and humans. Furthermore, the sensitivity to NVP-induced skin rash can be transferred with CD4+ T cells from NVP-rechallenged rats to naive recipients (Shenton et al., 2005). In addition, partial depletion of CD4+ T cells delayed and decreased the severity of rash, whereas depletion of CD8+ T cells did not prevent the development of NVP-induced skin rash (Shenton et al., 2005), which is consistent with the observation that the incidence of rash is lower in patients with a low CD4+ T cell count.
There is circumstantial evidence that many idiosyncratic drug reactions involve reactive metabolites of the drugs rather than the parent drug, but there is rarely definitive evidence for the involvement of a specific reactive metabolite. We recently demonstrated that the NVP-induced skin rash is not caused by NVP itself but requires 12-hydroxylation of NVP, presumably because the 12-hydroxy metabolite is further converted to a more reactive sulfate in the skin. This conclusion was based on experiments in which the 12-methyl hydrogens were replaced by deuterium, which decreases 12-hydroxylation and rash but does not affect other properties of the drug. Furthermore, treatment with 12-OH-NVP also led to a rash (Chen et al., 2008).
In the present study, we determined the specificity of lymphocytes from animals with NVP-induced skin rash by measuring their proliferation and cytokine secretion. The structures of the compounds used in these experiments: NVP, 12-OH-NVP, and 4-Cl-NVP are shown in Fig. 1. A chlorine atom and a methyl group are of approximately the same size and so noncovalent binding of 4-Cl-NVP should be similar to that of NVP, but the chlorine blocks oxidation to the 12-OH-NVP and subsequent formation of the sulfate, which is the putative immunogen. Another analog, 12-Cl-NVP, which is more reactive than the sulfate of 12-OH-NVP, was eliminated from later studies because of its cytotoxicity.

Structures of NVP, 12-OH-NVP, 4-Cl-NVP, and 12-Cl-NVP.
Materials and Methods
Chemicals.
NVP was kindly supplied by Boehringer-Ingelheim GmbH. 12-OH-NVP (Grozinger et al., 1995), 12-Cl-NVP (Kelly et al., 1995), and 4-Cl-NVP (Hargrave et al., 1991; Norman et al., 2000) were synthesized as described previously. Phosphate-buffered saline (pH 7.4, fetal bovine serum (FBS), 1640 RPMI-HEPES modified, Eagle's minimal essential medium nonessential amino acids solution, and penicillin-streptomycin liquid were purchased from Invitrogen Canada, Inc. (Burlington, ON, Canada). Dimethyl sulfoxide (DMSO), indomethacin, phorbol myristate acetate, and ionomycin were purchased from Sigma-Aldrich (St. Louis, MO). β-Mercaptoethanol was purchased from Bio-Rad Laboratories (Missisauga, ON, Canada). Rat CD4 and CD8 MicroBeads were purchased from Miltenyi Biotec (Auburn, CA). Antibodies for flow cytometry studies including anti-rat CD4 phycoerythrin (mouse IgG1), anti-rat CD8a fluorescein isothiocyanate (mouse IgG1), mouse IgG1 phycoerythrin (isotype control), and mouse IgG1 fluorescein isothiocyanate (isotype control) were purchased from Cedarlane Laboratories (Burlington, ON, Canada). Rat cytokine/chemokine Luminex bead immunoassay kit, LINCOplex, 24 Plex, was purchased from Millipore Corporation (Billerica, MA). Alamar blue solution was purchased from AbD Serotec (Oxford, UK). Interferon-γ (IFN-γ) and interleukin-10 (IL-10) ELISA, IFN-γ ELISPOT immunoassay kits and anti-rat CD32 (FcγII receptor) antibody were purchased from BD Biosciences (San Jose, CA).
Animal Care.
Female Brown Norway rats (150–175 g) were obtained from Charles River Canada (Montreal, QC, Canada) and housed in pairs in standard cages with free access to water and Agribrands powdered lab chow diet (Cargill, Inc., Minneapolis, MN). The animal room was maintained at 22°C with a 12:12 h light/dark cycle. After one week of acclimatization, the rats were either continued on the same diet (control) or switched to a diet mixed with NVP (treatment group). Primary-treated animals refer to rats that were treated with NVP at a dose of 150 mg/kg/day for 21 days. Rechallenged animals refer to rats that have recovered (4 weeks off drug) from primary treatment and then re-exposed to the same dose of NVP for 5 days. The amount of NVP mixed with the diet was calculated based on the body weight of the rats and their daily intake of food. All animals were monitored for the development of red ears, skin rash, food intake, and body weight. At the termination of the experiment, rats were killed by CO2 asphyxiation. All of the animal studies were conducted in accordance with the Guidelines of the Canadian Council on Animal Care and approved by University of Toronto's animal care committee.
Preparation of Single-Cell Suspension from ALNs.
Auricular lymph nodes (ALNs) were excised and put into Petri dishes containing culture medium (50 ml of FBS, 5 ml of Eagle's minimal essential medium nonessential amino acids, 5 ml of antibiotics, 5 ml of diluted 2-mercaptoethanol (35 μl of 2-mercaptoethanol in 100 ml of distilled water), and 435 ml of RPMI 1640-HEPES-modified medium. ALN cells were teased out of the nodal capsule by use of the butt end of a sterile 3-ml syringe plunger and filtered twice through a 40-μm nylon mesh cell strainer (BD falcon, BD Biosciences). The cell viability was assessed in 0.4% trypan blue.
Determination of Cell Proliferation by Use of an Alamar Blue Assay.
Single-cell suspensions made from control, primary-treated, or rechallenged animals were resuspended at a density of 106 cells/ml with 1 μg/ml indomethacin. They were then plated at 200 μl/well in a 96-well plate. The cells were incubated with various concentrations of NVP, 12-OH-NVP, or 4-Cl-NVP dissolved in DMSO for 72 h at 37°C in a 5% CO2 atmosphere. For a positive control, cells were incubated with equal volumes (10 μl) of phorbol myristate acetate (50 ng/ml in DMSO) and ionomycin (500 ng/ml in DMSO). Cells treated with DMSO alone served as a negative control. Alamar blue reagent was added to each well in an amount equal to 10% of the volume in the well (20 μl) at 24 h during the incubation. OD values at 570 and 600 nm were read at 72 h. Alamar blue reagent incorporates an oxidation-reduction indicator that changes color in response to the chemical reduction of growth medium resulting from cell growth. The ratio of treated versus control wells in reduction of alamar blue was calculated according to the manufacturer's instructions.
Luminex, ELISPOT, and ELISA Assays.
Single-cell suspensions made from control, primary-treated, and rechallenged animals were incubated in the same manner as in the alamar blue assay, with the exception that the cells were plated at 2 ml/well in a 24-well plate for the ELISA and Luminex assays, and the addition of alamar blue was omitted. After 72 h of incubation, the cell culture supernatant was collected and stored at −20°C. Quantitation of IFN-γ and IL-10 was achieved by use of an ELISA assay, and a broad screening of cytokines was performed by use of a Luminex immunoassay kit from Millipore Corporation. The cytokines/chemokines measured were: IL-1α, IL-1β, IL-2, IL-4, IL-5, IL-6, IL-10, IL-12p70, IL-18, granulocyte-macrophage colony-stimulating factor (GM-CSF), growth related oncogene/keratinocyte chemoattractant (GRO/KC), IFN-γ, monocyte chemoattractant protein-1 (MCP-1), tumor necrosis factor-α (TNF-α), IL-9, IL-13, IL-17, Eotaxin, granulocyte colony-stimulating factor, leptin, macrophage inflammatory protein 1α (MIP-1α), interferon-inducible protein 10, RANTES, and vascular endothelial growth factor. In the case of the ELISPOT assay, cells were resuspended at 2 × 10⁶ cells/ml, and 200 μl was added into each well of the 96-well ELISPOT plate. After 72 h of incubation, the frequencies of cells that produce IFN-γ were analyzed by an automated enzyme-linked immunospot counter (Cellular Technology Ltd., Shaker Heights, OH). All the immunoassays were performed by following the manufacturer's instructions.
Depletion of CD4+ and/or CD8+ Lymphocytes.
To identify which cells produced IFN-γ, CD4+ and/or CD8+ cells were depleted from the single-cell suspensions by labeling CD4+ and/or CD8+ cells with immunomagnetic microbeads coated with anti-CD4 or anti-CD8a antibodies, followed by passage through a magnetic column. The CD4+ and/or CD8+ depleted cells were resuspended at 106 cells/ml, and 2 ml of cells were incubated with 12.5 μg/ml of NVP in DMSO in the same way as the other immunoassays described above. To examine the effect of the depletion procedure itself on cytokine production, a control experiment was performed in which some CD4+- and/or CD8+-depleted cells were combined with CD4+ and/or CD8+ cells (labeled by the corresponding antibodies) in the same portion as they were before the depletion, and then incubated with NVP. A small portion of cells without any processing was also cultured in the same way with NVP as a positive control (before depletion). Cells treated DMSO alone served as negative control. The amount of IFN-γ released into culture medium was determined by ELISA.
Flow Cytometry.
Single-cell suspensions before and after the depletion of CD4+ and/or CD8+ cells were surface-labeled, and one- or two-color immunofluorescence analysis was conducted. In brief, cells were resuspended at a density of 2 × 10⁷ cells/ml in phosphate-buffered saline/3% FBS, and 50 μl of these cell suspensions were aliquoted to wells in a 96-well plate. These cells were first incubated with anti-CD32 antibody for 10 min at room temperature to reduce nonspecific binding. Then, monoclonal antibodies or suitable isotype controls were aliquoted to the appropriate wells and incubated at room temperature for 20 min. The cells were washed twice and finally resuspended in 400 μl of the same buffer. Samples were analyzed immediately with a FACS-Calibur (BD Biosciences) with use of CellQuest software (BD Biosciences). FlowJo (Tree Star, Inc., Ashland, OR) was used to analyze the difference in CD4+ and/or CD8+ cell populations between depleted and undepleted cells.
Results
ALN Cell Specificity as Determined by IFN-γ Production.
Cytokine production was used as a measure of T cell activation. IFN-γ was found to be a sensitive marker of cell activation, and the addition of indomethacin to the culture medium made the assay more sensitive and consistent, presumably because it decreased the inhibitory effects of prostaglandin E production. Drug-specific IFN-γ secretion from lymphocytes gradually increased from 6 h until reaching maximal concentrations on day 3; no IFN-γ could be detected in cultures in the absence of NVP or in cultures of ALN cells from animals after 21 days of primary NVP exposure in the presence of NVP (data not shown). Analysis of cell culture supernatants after 3 days showed that ALN cells from secondary-treatment rats incubated in the presence of NVP or 4-Cl-NVP produced IFN-γ with only a minimal response to 12-OH-NVP and no response to 12-Cl-NVP (Fig. 2). 12-Cl-NVP was found to be cytotoxic, causing morphologic changes in the cells; therefore, it was excluded from the rest of the studies. Likewise, ALN cells from animals in which the rash was induced by 12-OH-NVP and rechallenged with 12-OH-NVP also produced IFN-γ on exposure to NVP with a smaller response to 4-Cl-NVP and even less to 12-OH-NVP (Fig. 2). Again, no IFN-γ production was detected in cells from animals treated for 21 days on primary exposure to 12-OH-NVP (data not shown). The production of IL-10 by these lymphocytes was also quantified and showed similar results. Independent of whether the rash was induced by NVP or 12-OH-NVP, lymphocytes produced IL-10 on exposure to NVP with a smaller response to 4-Cl-NVP and even less to 12-OH-NVP (Fig. 3). As a positive control, the level of IFN-γ produced by cells from 4 NVP-rechallenged animals in response to PMA/I stimulation was 3069 ± 838 pg/ml.

IFN-γ secretion by lymphocytes in response to NVP, 12-OH-NVP, 4-Cl-NVP, and 12-Cl-NVP. A, lymphocytes from NVP-treated animals (n = 6). B, lymphocytes from 12-OH-NVP-treated animals (n = 4). CON indicates control animals; for example, CON/NVP indicates that the lymphocytes were isolated from untreated control animals and incubated with NVP. The data are expressed as the mean ± S.D.

IL-10 secretion by lymphocytes in response to NVP, 12-OH-NVP, 4-Cl-NVP, and 12-Cl-NVP. A, lymphocytes from NVP-treated animals (n = 6). B, lymphocytes from 12-OH-NVP-treated animals (n = 4). CON indicates control animals; for example, CON/NVP indicates that the lymphocytes were isolated from untreated control animals and incubated with NVP. The data are expressed as the mean ± S.D.
The IFN-γ ELISPOT assay showed the same specificity as the ELISA assay. For both control and primary-treated animals, no response was observed (data not shown). The frequency of cells from NVP-rechallenged animals that respond to NVP was approximately 1:4000 compared with 1:40,000 for the frequency of cells responding to 4-Cl-NVP. Virtually no cells responded to 12-OH-NVP (Fig. 4).

Frequencies of lymphocytes responding with the production of IFN-γ when stimulated with 12.5 μg/ml NVP or its analogs/metabolites from NVP-rechallenged rats with use of an ELISPOT assay. Cells incubated with a phorbol myristate acetate/ionomycin mixture served as a positive control, whereas the well treated DMSO alone served as a negative control. The numbers at the left corner of each well represent the number of cells responding to the drug out of a total of 0.4 million cells/well.
ALNs Cell Specificity as Determined by Cell Proliferation.
The alamar blue assay was used to measure cell proliferation in response to NVP, 12-OH-NVP, and 4-Cl-NVP. No increase in proliferation was detected in cells from animals after primary exposure to NVP (data not shown). For rechallenged animals, increased proliferation was detected in NVP-stimulated cells, which was maximal at a NVP concentration of 6.25 μg/ml (Fig. 5). No proliferation was detected in response to 12-OH-NVP or 4-Cl-NVP. Higher concentrations of all drugs seem to be toxic and led to less reduction of the alamar blue reagent compared with control wells. As a positive control, the ratio of PMA/I-treated versus control wells in reduction of alamar blue was 1.68 ± 0.21% for treated animals and 1.63 ± 0.13% for control animals.

Cell proliferation in response to NVP, 12-OH-NVP, and 4-Cl-NVP as determined by the reduction of alamar blue. A, lymphocytes from untreated control animals. B, lymphocytes from NVP-rechallenged animals. The reduction of alamar blue in control wells (treated DMSO alone) was set as 1. The ratio of NVP or its metabolites/analogs versus control wells in reduction of alamar blue was plotted against the concentration of these drugs. The data represent the mean from four rats ± S.D. Statistical significance between treated samples and control samples was determined by use of the Mann-Whitney U test; p values of ≤0.05 were considered statistically significant.
Screening Cytokines/Chemokines Production by Lymphocytes.
The Luminex immunoassay was used to screen for the production of 24 cytokines/chemokines by lymphocytes. In response to NVP, lymphocytes from primary-treated animals produced increased levels of IL-6, IL-10, IL-17, IL-18, GM-CSF, GRO/KC, RANTES, and MIP-1α (Fig. 6). In contrast, rechallenged animals had increased production of IL-17, GM-CSF, GRO/KC, MIP-1α, TNF-α, IL-10, IL-18, RANTES, and IFN-γ. In general, cells from rechallenged animals produced higher levels of cytokines/chemokines than cells from primary-treated animals; however, their cytokine profiles were slightly different. Primary-treated animals produced more IL-18 and produced IL-6, which was not observed in rechallenged animals. In contrast, rechallenged animals produced TNF-α and a large amount of IFN-γ, which were absent in cells from primary-treated animals (Fig. 6). Stimulation of cells from both primary and rechallenged animals with NVP actually seemed to decrease the basal production of MCP-1.

Concentration of cytokines/chemokines produced by lymphocytes from control (n = 4), primary treated (n = 6), and rechallenged (n = 7) animals in response to 12.5 μg/ml NVP as determined by a Luminex assay. The data are separated into A and B based on their different range of concentrations. The levels are expressed as the mean ± S.E.M. Statistical significance between treatment group and control group was determined by use of the Mann-Whitney U test; p values of ≤0.05 were considered statistically significant.
To determine whether the lack of response to 12-OH-NVP was due to toxicity or the suppression of T cell proliferation, lymphocytes isolated from four control animals were incubated with PMA/I and titrated concentrations of NVP or 12-OH-NVP. There was no statistical difference between 12-OH-NVP and NVP in either the cell proliferation assay or the IFN-γ production assay (data not shown).
Production of IFN-γ by CD4+- and/or CD8+-Depleted Lymphocytes.
To identify which cells were responsible for cytokine production, CD4+ and/or CD8+ cells were depleted from ALN cells and then cultured with 12.5 μg/ml NVP. Flow cytometry was used to determine the degree of depletion. In both rats that were tested, the percentage of CD4+ cells after CD4+ depletion decreased to 0.0% compared with the original levels of 40.3% for rat 1 and 56.3% for rat 2. CD4+ levels after double depletion decreased to 0.5% and 0.2%, respectively. The percentage of CD8+ cells before depletion was 10.1% for rat 1 and 5.0% for rat 2. These values decreased to 1.2%, 0.6% after CD8+ depletion, and 1.3%, 0.4% after CD4+/CD8+ double depletion, respectively.
When only CD4+ cells were depleted, the production of IFN-γ decreased to levels similar to the negative control (Fig. 7). When both CD4+ and CD8+ cells were depleted simultaneously, IFN-γ production was virtually eliminated. However, when ALN cells were depleted of CD8+ cells the production level of IFN-γ was only slightly decreased. There was no significant difference in the production level of IFN-γ between undepleted lymphocytes and lymphocytes combined after depletion procedure.
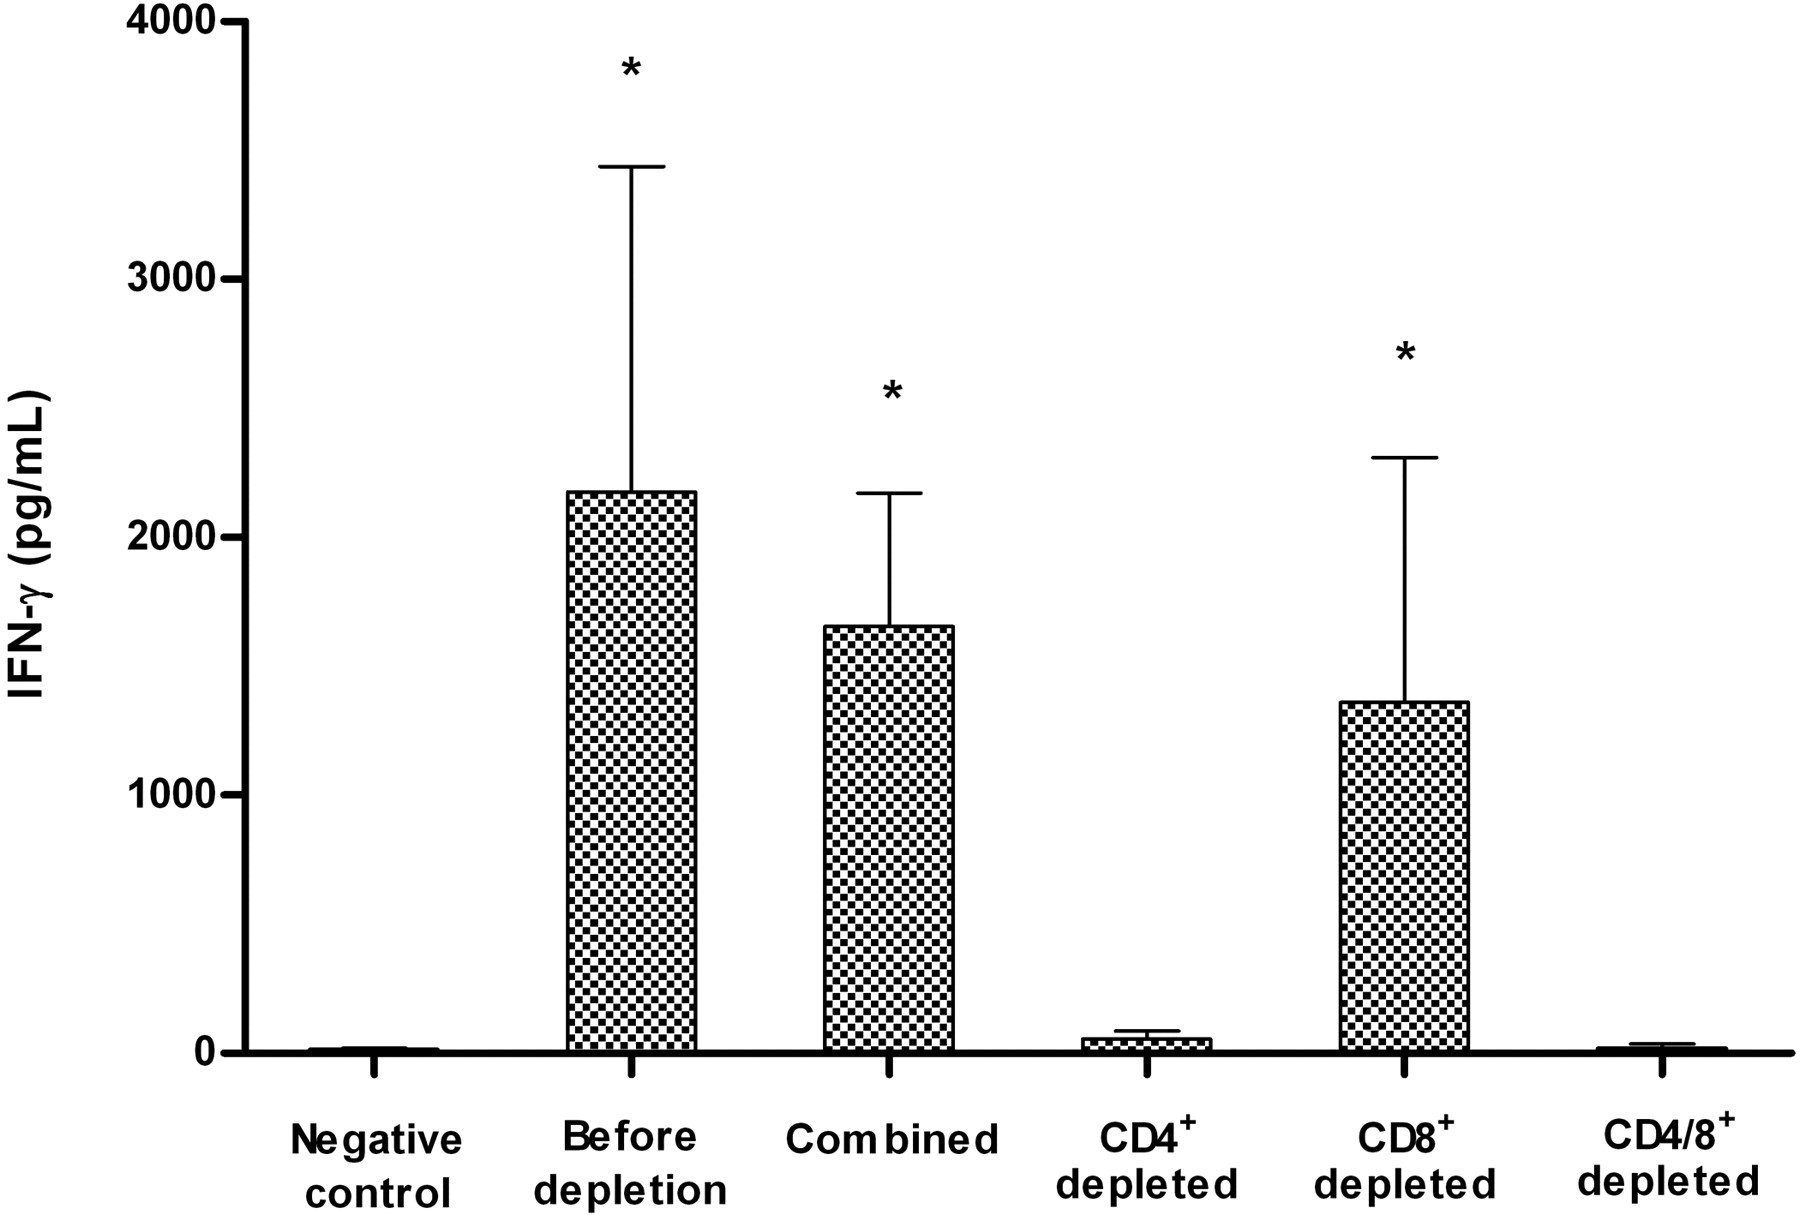
Production of IFN-γ in response to 12.5 μg/ml NVP by lymphocytes from rechallenged rats before and after depletion of CD4+ and/or CD8+ T cells. The negative control was cells treated DMSO alone. Combined samples were obtained by combining CD4+- and/or CD8+-depleted cells with CD4+ and/or CD8+ cells (labeled by the corresponding antibodies) in the same portion as they were before the depletion and then incubated with NVP. The data represent the mean from four rats ± S.E. Statistical significance between depletion groups and negative control group was determined by use of the Mann-Whitney U test; p values of ≤0.05 were considered statistically significant.
Discussion
In the present studies, determined the molecular specificity of lymphocytes from NVP-rechallenged animals. Detection of drug-specific IFN-γ secretion by lymphocytes proved to be a sensitive method for the detection of lymphocyte activation. A recent study of a patient with a history of NVP-induced liver toxicity found that the patient's T cells proliferated in response to NVP but not to 12-OH-NVP, 2-OH-NVP, or descyclopropyl-NVP; they did not test the 4-Cl analog (Drummond et al., 2006). In another study, T cells from a patient with NVP-induced skin rash responded to incubation with NVP by producing IFN-γ (Keane et al., 2007). These clinical findings provide further evidence that the immune response in the animal model is similar to that in NVP-induced idiosyncratic reactions in humans. The finding that CD4+ T cells were the source of IFN-γ is also consistent with the observation that depletion of these cells in both the animal model and humans is protective where, at least in the animal model, depletion of CD8+ T cells actually seemed to make the rash worse. A variety of chemokines were also produced, such as GM-CSF, GRO/KC, MCP-1, MIP-1α, and RANTES. They are chemotactic molecules that recruit other immune cells including monocytes, neutrophils basophils, eosinophils, and T cells to a site of injury or inflammation. Others cytokines are mostly proinflammatory, which can promote an immune response, such as IL-17, TNF-α, IFN-γ, and IL-18. IL-6 is both proinflammatory and anti-inflammatory. IL-10 can inhibit the production of many inflammatory cytokines and down-regulate immune response. Production of IL-10 in both primary and rechallenged animals may suggest a role of regulatory cells in this model. However, descriptions of the cytokines do not adequately represent the function of combinations of cytokines, which can interact in ways that are not well understood, and studies are ongoing to try to better understand how the pattern of cytokines in vivo reflects the mechanism of this immune reaction. The cytokine pattern was different in cells from animals after primary exposure to NVP than in those from rechallenged animals. The rash in animals is mild on initial exposure to NVP, but the reaction is systemic with weight loss and a widespread infiltration of lymphocytes in the skin on rechallenge (Popovic et al., 2006), so it is not surprising that the response and number of responding cells was markedly greater in cells from rechallenged animals.
A quite surprising finding was that there was a complete disconnect between what induced the skin rash and the specificity of the T cells. Not only do we know from independent experiments that oxidation of NVP to 12-OH-NVP is required to cause a skin rash, but even when the skin rash was induced by treatment with 12-OH-NVP and the animals had not been exposed to NVP (12-OH-NVP is not converted to NVP), their T cells responded much better to NVP than to 12-OH-NVP. This has significant implications for understanding how an immune response evolves. It is likely that induction of this immune response requires covalent binding of a reactive metabolite nevirapine derived from 12-OH-NVP because this results in modified protein and/or because it causes cell damage (Danger Hypothesis). However, once induced, there is much more drug present than modified protein and it is possible that some T cells cross-react with parent drug and proliferate, i.e., epitope spreading (Uetrecht, 2007). NVP and 4-Cl-NVP are more lipophilic than 12-OH-NVP, and this may lead to higher affinity binding. The basis for why there is a disconnect between what induces the immune response and the specificity of the T cells is speculation; however, it is clear that the specificity of T cells cannot be used to determine what induced the immune response.
These findings also have implications for the pharmacological interaction (p-i) hypothesis. This hypothesis was originally based on the lymphocyte transformation test results from patients with a history of an idiosyncratic reaction to sulfamethoxazole whose cloned T cells showed a response to the parent drug in the absence of metabolism (Zanni et al., 1998). The unstated assumption is that what T cells respond to is what induced the immune response, which no longer can be considered a valid assumption. This does not mean that the p-i hypothesis is wrong in all cases; there are idiosyncratic drug reactions such as ximelagatran-induced liver failure in which a reactive metabolite does not seem to be involved. Ximelagatran is structurally similar to a small peptide and may be able to initiate an immune response through a p-i type of interaction; in fact, there is evidence that it can bind directly but reversibly to MHC, specifically DRB1*07 and DQA1*02 (Kindmark et al., 2008). However, our study does have significant implications for the interpretation of lymphocyte transformation tests.
Acknowledgments
We thank Boehringer-Ingelheim for supplying nevirapine.
Footnotes
-
This work was supported by the Canadian Institutes of Health Research [Grant MOP-84520]. J.P.U. is the recipient of the Canada Research Chair in Adverse Drug Reactions.
-
Article, publication date, and citation information can be found at http://jpet.aspetjournals.org.
doi:10.1124/jpet.109.157362
-
ABBREVIATIONS:
- NVP
- nevirapine
- 4-Cl-NVP
- 4-chloro-nevirapine
- 12-Cl-NVP
- 12-chloro-nevirapine
- 12-OH-NVP
- 12-hydroxy-nevirapine
- ALN
- auricular lymph node
- DMSO
- dimethyl sulfoxide
- ELISA
- enzyme-linked immunosorbent assay
- ELISPOT
- enzyme-linked immunosorbent spot assay
- FBS
- fetal bovine serum
- GM-CSF
- granulocyte-macrophage colony-stimulating factor
- GRO/KC
- growth related oncogene/keratinocyte chemoattractant
- IFN-γ
- interferon-γ
- IL-10
- interleukin-10
- MCP-1
- monocyte chemoattractant protein-1
- TNF-α
- tumor necrosis factor-α
- RANTES
- regulated on activation, normal T cell expressed and secreted
- p-i
- pharmacological interaction.
- Received June 8, 2009.
- Accepted September 3, 2009.
- © 2009 by The American Society for Pharmacology and Experimental Therapeutics


