

Abstract
In the postnatal subventricular zone (SVZ), S phase entry of neural progenitor cells (NPCs) correlates with a local increase in blood flow. However, the cellular mechanism controlling this hemodynamic response remains unknown. We show that a subpopulation of SVZ cells, astrocyte-like cells or B-cells, sends projections ensheathing pericytes on SVZ capillaries in young mice. We examined whether calcium increases in pericytes or B-cells led to a vascular response in acute slices using the P2Y2/4 receptor (P2Y2/4R) agonist UTP, electrical stimulation, or transgenic mice expressing exogenous Gq-coupled receptors (MrgA1) in B-cells. UTP increased calcium in pericytes leading to capillary constrictions. Electrical stimulation induced calcium propagation in SVZ cells followed by capillary constrictions involving purinergic receptors. In transgenic mice, selective calcium increases in B-cells induced P2Y2/4R-dependent capillary constrictions, suggesting that B-cells release ATP activating purinergic receptors on pericytes. Interestingly, in the presence of a P2Y2/4R blocker, dilation was observed. Intraventricular UTP injection transiently decreased blood flow monitored in vivo using laser Doppler flowmetry. Using neonatal electroporation, we expressed MrgA1 in slow cycling radial glia-derived B1 cells, i.e., NPCs. Intraventricular injection of an MrgA1 ligand increased blood flow in the SVZ. Thus, upon intracellular calcium increases B-cells/NPCs release ATP and vasodilating factors that activate purinergic receptors on pericytes triggering a vascular response and blood flow increase in vivo. Considering that NPCs receive signals from other SVZ cells, these findings further suggest that NPCs act as transducers of neurometabolic coupling in the SVZ.
Introduction
Two neurogenic zones persist in the adult brain of all mammalian species examined, including humans (Sanai et al., 2004, 2011; Curtis et al., 2007; Quiñones-Hinojosa and Chaichana, 2007; van den Berge et al., 2010; Bonfanti and Peretto, 2011), the larger being the subventricular zone (SVZ). The SVZ is located along the wall of the lateral ventricle and contains several cell types, including neural progenitor cells (NPCs), intermediate progenitors, neuroblasts, and specialized astrocytes, as well as a large capillary network (Shen et al., 2008; Tavazoie et al., 2008; Snapyan et al., 2009; Whitman et al., 2009; Lacar et al., 2011, 2012). Both NPCs and specialized astrocytes express glial fibrillary acidic protein (GFAP) and are referred as B-cells (B1 and B2 cells, respectively) (Mirzadeh et al., 2008; Lacar et al., 2011). NPCs occasionally proliferate and generate fast proliferative intermediate progenitors, themselves generating neuroblasts. An acute increase in the number of SVZ cells entering S phase (Lacar et al., 2012), which occurs following insults or drug treatments (Radley and Jacobs, 2003; Banasr et al., 2004; Young et al., 2011), is metabolically demanding (Vander Heiden et al., 2009; Bolaños et al., 2010; Foster et al., 2010) and is accompanied by a local increase in blood flow (Lacar et al., 2012). However, the cellular mechanisms responsible for this neurometabolic coupling remain unknown.
In other brain regions, most studies of local blood flow regulation have focused on the mechanisms of neuro-arteriole coupling. Parenchymal astrocytes regulate arteriole diameters through smooth muscle cells in acute slices (Zonta et al., 2003; Mulligan and MacVicar, 2004; Takano et al., 2006; for reviews, see Iadecola and Nedergaard, 2007; Gordon et al., 2008; Wang et al., 2009; Attwell et al., 2010; Pelligrino et al., 2011). It was also reported that calcium increases in astrocytes in vivo were followed by a hemodynamic response (Takano et al., 2006; Winship et al., 2007). Astrocytes, which share properties with B-cells (Liu et al., 2006; Wang and Bordey, 2008), are thus prime regulators of arteriolar blood flow (Wang et al., 2009; Attwell et al., 2010). However, the SVZ contains mostly capillaries, which are covered by pericytes (Tavazoie et al., 2008; Lacar et al., 2011). Intriguingly, pericytes have contractile properties in vitro and in vivo (Kawamura et al., 2003; Peppiatt et al., 2006; Fernández-Klett et al., 2010). These findings suggest that capillaries may be the site of local blood flow regulation. Neurons regulate capillary tone while the contribution of astrocytes remains unclear (Peppiatt et al., 2006; Itoh and Suzuki, 2012). In the SVZ, B-cells project onto capillaries and are thus prime candidates to control capillary tone. However, their functions on capillary tone and blood flow remain to be explored.
Here, we provide the first evidence that B-cells in the SVZ regulate capillary diameters in acute slices through pericytes and in part through ATP release. Using laser Doppler flowmetry (LDF; Fabricius and Lauritzen, 1996; Lacar et al., 2012), we also found that calcium increases in slow-cycling B1 cells, i.e., NPCs, increase blood flow in vivo.
Materials and Methods
Mice.
Research protocols were approved by the Yale University Institutional Animal Care and Use Committee. Slice experiments were performed in CD1 mice (Charles River Laboratories) and transgenic hGFAP-tTA/TetO-MrgA1 mice of either sex (a gift from Dr. Ken McCarthy, University of North Carolina at Chapel Hill). In the absence of doxycycline, GFAP-expressing cells including B-cells express MrgA1 receptors (Fiacco et al., 2007). All acute slice experiments were performed in postnatal day 17–54 (P17–P54) in at least three mice. Laser Doppler flow in vivo experiments were performed in 25–30 g CD1 mice (∼4 months old) and 4- to 5-week-old Sprague Dawley rats (Charles River Laboratories) of either sex. In these in vivo experiments, mice were used for UTP applications and rats were used for electroporation and FLRFa applications.
Immunofluorescence.
Immunostaining performed in free-floating 100-μm-thick slices was as previously described (Platel et al., 2009). The primary antibodies include: rabbit anti-GFAP (1:1000; Dako), goat anti-DCX (1:100; Santa Cruz Biotechnology), rat anti-PECAM (1:100; BD Biosciences), rabbit anti-NG2 (1:200; Millipore Bioscience Research Reagents), and chicken anti-GFP (1:500; Abcam). Each staining was replicated at least in 4–5 slices from three different mice. Z-section images were acquired on a confocal microscope (FluoView 1000) with a 20× dry objective (NA 0.75) or a 60× oil objective (NA 1.42). Images were analyzed and reconstructed using Imaris 4.0 (Bitplane), ImageJ 1.39t (Freeware, Wayne Rasband, National Institutes of Health), and Photoshop CS3.
Acute brain slice preparation and pericyte labeling.
Mice were deeply anesthetized with pentobarbital (50 mg/kg). After craniotomy and dissection, sagittal brain slices (250–300 μm) were prepared in chilled (4°C) dissection solution (in mm): 25.2 NaCl, 176 sucrose, 2.5 KCl, 5 MgCl2, 1.2 CaCl2, 1.2 NaH2PO4, 10 glucose, and 26 NaHCO3, pH 7.4, bubbled with 95% O2/5% CO2. Slices were incubated for >1 h in artificial CSF (aCSF) at room temperature (in mm): 125 NaCl, 2.5 KCl, 1 MgCl2, 2 CaCl2, 1.25 NaH2PO4, 10 glucose, and 26 NaHCO3, pH 7.4, and bubbled with 95% O2/5% CO2. Slices were then transferred to a flow-through chamber and continuously superfused (∼1 ml/min) with aCSF bubbled with 95% O2/5% CO2. The chamber was mounted on the stage of an upright microscope (Olympus BX61) equipped with laser-scanning confocal microscopy (Olympus Fluoview 300 or Fluoview 1000) and a water-immersion Nomarski phase-contrast and fluorescence 40× or 60× objective. Experiments were performed at 32−34°C unless otherwise noted.
We made a serendipitous observation that pericytes can be labeled with the large fluorescent dye TO-PRO-3. To visualize pericytes in live sections, TO-PRO-3 was either bath applied (1 μm, 5 min in aCSF at room temperature) or pressure applied (2 μm, 60 s). Slices containing labeled pericytes were used for live imaging and/or fixed in 4% paraformaldehyde (PFA) for 3–6 h for costaining with antibody against NG2 as detailed above.
Electrical stimulation.
Electrical stimulation was performed using aCSF-filled theta-borosilicate glass pipettes (World Precision Instruments) pulled to an ∼5 μm tip diameter using a P-97 puller (Sutter Instruments). The tip of these bipolar stimulation electrodes were positioned at ∼30–40 μm away from the vessel. Voltage pulses (200–400 μA; duration, 200–300 μs; rate, 10 Hz for 1–10 s) were applied using an isolated pulse stimulator (2100; A-M Systems).
Imaging and analysis of changes in capillary diameters.
Blood vessels were imaged >20 μm below the surface of the slices and were identified as capillaries rather than arterioles by their small diameter (<10 μm), their lack of smooth muscle cells, and the presence of pericytes (when labeled). Vessels were routinely loaded with a red fluorescent dye such as 70 kDa Texas Red-dextran (TRD) or sulforhodamine 101 (SR101, 200–400 μl at 12.5 mg/ml) by transcardial perfusion before slice preparation. Blood vessels were visualized using fluorescence and differential interference contrast (DIC) confocal imaging using laser illumination at 488 or 543 nm. Using 543 nm laser excitation, blood cells appear dark due to the intrinsic optical signal of hemoglobin, facilitating visualization of the vessel. To rule out a possible laser-induced spontaneous vessel constriction, we also observed capillary constriction while imaging with a CCD-based camera (n = 4).
To measure capillary diameter, we determined the width of SR101 or TRD fluorescence at every time point of a time-lapse movie. To do so, we drew a line perpendicular to the vessel wall of a time-series stack (line scan) and obtained a reslice image using ImageJ (see Fig. 5C, inset). The reslice image gave a representation of the vessel diameters over time (one pixel in the x-axis = one acquisition frame). Using a custom-coded program (written by B.L.) in MATLAB (MathWorks), we determined the capillary diameter over time. The capillary diameter was defined as the distance between the first and last half-maximal points on the intensity plot for a given time point. This procedure was repeated three times for each vessel measurement and the results were averaged. This automatic analysis (line scan and diameter measurement) removed observer bias. For cases in which TRD injections were unsuccessful or the dye detection was poor (∼20% of the movies), we used the optical signal in the DIC images or TO-PRO-3-labeled pericyte processes to trace the vessel walls and assist in measurement. For each measured time point, we divided each length by the baseline, defined as the average of all measurements before the stimulus. MATLAB codes are available upon request.
Narrowing of the vessel diameter was the primary criterion for assessing constriction. However, in some cases constrictions could also be visually confirmed by blood cell movement (see Fig. 3C), red dye movement, or local distortion of the tissue. In cases where these secondary criteria were used, constrictions could be counted but not used for rigorous quantification of constriction and timing measurements since blood vessel diameter could not be monitored accurately throughout the recording. Movies in which Z shifts or other technical obstructions prevented determination of constriction were not analyzed. In the text, we thus report two n values, one for where we observe constrictions and a second where we mention how many we measured the capillary diameter frame by frame using the stringent criteria detailed above.
Calcium activity imaging and analysis.
SVZ cells were loaded by pressure application (<3 psi) of Fluo-4 AM (250 μm in aCSF, 0.4% pluronic acid F-127; Invitrogen) inside the tissue. Time-lapse movies were acquired at 0.30–0.89 Hz with FluoView acquisition software. Most recordings lasted 3.33 min and none were longer than 5.5 min. Calcium activity was analyzed with custom-coded software CalSignal (written by J.C.P.) (Platel et al., 2007). F0 (i.e., baseline) and F are the mean fluorescence intensities measured throughout all of the regions of interest (ROI) and in each ROI, respectively. A change in fluorescence was considered to be a calcium increase if it was >15% F/F0 increase. Fluo-4 and GFP have overlapping optical emissions. Nevertheless, in slices from hGFAP-MrgA1 mice, Fluo-4 fluorescence could be measured in GFP-expressing cells (i.e., B-cells), because GFP is fused to the MrgA1 receptor and thus outlines the cell surface rather than loading the cytoplasm. For quantification of calcium changes in perivascular cells, one ROI per capillary was placed on the cell within 5 μm of capillaries and adjacent to the point of constriction. To measure calcium activity in pericytes, we identified pericytes by TO-PRO-3 loading (as described above).
Neonatal electroporation of pCAG-MrgA1:GFP.
Electroporation was performed as we previously described in P0 animals (Lacar et al., 2010; Platel et al., 2010; Feliciano et al., 2012). Rats were used for the in vivo LDF recordings because the SVZ was larger than in mice and easier to target with the microprobe. Plasmids (1–2 μg/μl) were diluted in PBS containing 0.1% fast green as a tracer. Plasmid solution (0.5–1 μl) was injected into the lateral ventricles of cold-anesthetized neonatal pups using a pulled glass pipette (diameter <50 μm). Five square pulses of 50 ms duration with 950 ms intervals at 100 V were applied using a pulse ECM830 BTX generator and tweezer-type electrodes (model 520; BTX) placed on the heads of P0–P1 pups. The MrgA1:GFP cDNA in the pcDNA3.1/zeo(+) construct was obtained from Dr. Xinzhong Dong (John Hopkins University, Baltimore, MD). The MrgA1:GFP sequence was excised and subcloned into pCAG-GFP (addgene) after removing the GFP sequence.
LDF measurements.
To monitor blood flow in vivo, animals were anesthetized with intraperitoneal injection of 100 mg/kg ketamine–10 mg/kg xylazine and placed on a stereotaxic device (RBM-1T; Kopf). Scalp was retracted and two small burr holes (0.6 mm) were drilled for inserting the LDF microprobe (Oxford Optronics) and a 33G needle with Hamilton syringe containing a drug and CellTracker Green. The probe diameter was 400 μm (two 200 μm diameter glass fibers) and the centered interoptode distance was 200 μm giving an estimated sampling volume of 0.02 μl. The probe was inserted near the SVZ (0.4/1.0 mm anterior to bregma, 2.1/1.29 mm lateral to the midline, 3.0/2.1 mm ventral from the pia at a 7.1/8° angle for rats/mice) and the syringe into the lateral ventricle (0.4/1.0 mm anterior to bregma, 2.75/1.53 mm lateral to midline, 5.4./3.59 mm ventral from the pia at 52.9/42.4° angle for rats/mice). The animal vital signs were monitored with a small animal plethysmograph on the footpad (MouseOx; Starr Life Sciences). Immediately following the experiments, the brains were removed and fixed in 4% PFA to prepare serial sections and visualize penetration tracts and dye diffusion. Recordings were continuous for 2 h. UTP and FLRFa were injected at 1 μl/20 s.
LDF analysis.
The LDF signal was recorded and analyzed with Spike2 program (CED). Control recordings before drug application were >30 min. The LDF signals were recorded at 50 Hz. The final time series were calculated as root mean square values of every 2 min period. The percentage changes were obtained by normalizing values to the baseline mean (2 min before drug injection).
Time-lapse color representation for calcium waves.
Time-lapse color representation (TLCR) allows for temporal coding of a movie in a single image and was performed as previously described following a custom-coded script in MATLAB (written by B.L.) (Lacar et al., 2011).
Drugs.
FLRFa was custom synthesized by GenScript. FLRFa peptide and UTP were pressure applied (<3 psi) above the slice surface using a computer-driven Picospritzer II (General Valve). Antagonists were bath applied and included in the puff pipette during agonist application. Suramin and PPADS were purchased from Tocris Cookson. Fluorescent dyes were purchased from Invitrogen. TOPRO-3 was purchased from Invitrogen (#T3605). All other drugs and chemicals except antibodies were purchased from Sigma. Only one drug was applied per slice.
Statistical analysis.
Data were presented in Origin 8.0. Statistical significance was determined using the Student's t test (p < 0.05) or χ2 test using KyPlot 2.0. Data are presented as mean ± SEM unless otherwise indicated.
Results
B-cells ensheath pericytes hugging SVZ capillaries
Recent studies reported the presence of capillaries running throughout the SVZ neurogenic zone (Shen et al., 2008; Tavazoie et al., 2008; Snapyan et al., 2009; Whitman et al., 2009;Lacar et al., 2011, 2012). Here, we examined the anatomical distribution of pericytes, B-cells, and neuroblasts in relation to blood vessels. Capillaries were visualized by either imaging the fluorescence of a transcardially perfused dye in acute sagittal slices or by immunostaining for the endothelial cell marker PECAM in fixed coronal section (Fig. 1). We preferentially prepared sagittal sections to visualize the capillary network in live tissue because it allowed an “en face” view of the SVZ with the ependymal cell layer on top and the bed of capillaries beneath running in parallel to the surface of the lateral ventricle (Fig. 1A–C, inset). To visualize pericytes in live sections, we found that loading of the nuclear counterstain dye TO-PRO-3 selectively labeled perivascular cells resembling pericytes (Fig. 1B–F). We confirmed their identity as pericytes because they immunostained positive for the chondroitin sulfate proteoglycan NG2 (known to label pericytes and oligodendrocyte precursors; Fig. 1D–F). NG2-labeled oligodendrocyte precursors have a very distinct morphology from pericytes and were not loaded with TO-PRO-3 (Fig. 1E,F). Pericytes were preferentially located on capillaries, especially at branchpoints, and their processes extended along the vessels (Fig. 1B,C).

Pericytes are labeled with TO-PRO-3 and decorate SVZ capillaries. A–C, Z-stack reconstruction of SR101-loaded capillaries (red, A and B) and TO-PRO-3-loaded SVZ cells (green, B and C) in an acute sagittal slice. One Z-optical section illustrates a DIC image (A). Insets, Diagrams illustrating the location of the SVZ in a sagittal and a coronal section. D, E, An acute coronal slice loaded with TO-PRO-3 (blue, D) that was fixed and immunostained for NG2 (green, E). Arrows designate TO-PRO-3-loaded pericytes that immunostain for NG2. The arrowhead denotes an NG2-cell, which did not take up TO-PRO-3 and resembles an oligodendrocyte precursor cell. F, Another example of a TO-PRO-3 labeled cells (blue, arrow) in an acute slice that was then fixed and stained for both NG2 (green) and GFAP. The arrowhead points to an NG2-cell, which did not take up TO-PRO-3 and resembles an oligodendrocyte precursor cell. Scale bars: A–C, F, 30 μm; E, 40 μm. LV, lateral ventricle.
We next examined whether B-cells directly contact capillaries. We used in vivo electroporation of a plasmid encoding GFP or tdTomato into NPCs at P0–P1 located along the lateral ventricle (Lacar et al., 2010; Platel et al., 2010). Radial glial cells act as NPCs in neonates and progressively transform into ependymal cells and B1 cells, i.e., the NPCs of the SVZ during the neonatal period (Merkle et al., 2004; Lacar et al., 2011). Because B1 cells are slow cycling, they are expected to retain the electroporated plasmid while fast-cycling cells dilute it and lose it after successive divisions. As a result, at 3–4 weeks postelectroporation most GFP+ cells (70–80%) displayed a B1 cell morphology characterized by their soma along the lateral ventricle and a long radial glia-like process projecting into the SVZ (Fig. 2A) (Lacar et al., 2011). The B1 cell process projected onto TRD-loaded capillaries running along the SVZ (Fig. 2A,B).

B-cells ensheath pericytes along SVZ capillaries. A, B, TRD-loaded capillaries and GFP+ B1 cells in a sagittal section from 4-week-old mice. The oblique rectangle denotes the plane of the left ventricle (LV) wall to highlight that the soma of the GFP+ B-cells are located adjacent to the ventricle wall and send projections through the SVZ toward capillaries. B1 cells were labeled with GFP using neonatal electroporation of P0 mice. GFP+ ependymal cells were removed from the images. C, Z-stack projection of GFAP (green, B-cells), DCX (blue, neuroblasts), and PECAM (red, blood vessels) immunofluorescence in a coronal section. D, One optical section from the boxed region is enlarged in C. E, An acute sagittal slice from an hGFAP-MrgA1:GFP mouse with TO-PRO-3-labeled pericytes and TRD-filled capillaries. The Y-Z and X-Z projections are shown on the right and bottom of the image, respectively. F, Diagram illustrating a simplified cellular arrangement around capillaries in the SVZ. Scale bars: A–C, 40 μm; D, 15 μm; E, 20 μm.
Remaining GFP+ cells were ependymal cells and are not shown on the images. Immunostaining for the B-cell marker GFAP further showed that B-cells, in particular B1 cells, display their soma near the ventricular surface and send projections terminating in endfeet on capillaries thus bridging the ventricle to capillaries (Fig. 2C,D), consistent with previous literature (Mirzadeh et al., 2008). In addition, coimmunostaining for the neuroblast marker doublecortin (DCX) revealed that B-cells' endfeet separated neuroblasts from the capillary wall (Fig. 2D). We also used transgenic mice, in which B-cells express GFP fused to a membrane receptor (called MrgA1) allowing GFP labeling of B-cell's processes. In acute sagittal slices from these mice, B-cell processes ensheathed TO-PRO-3-loaded pericytes juxtaposed to capillaries (Fig. 2E). Figure 2F illustrates the cellular arrangement around capillaries in the SVZ.
Direct activation of pericytes by UTP leads to constriction
We examined whether activation of SVZ pericytes would lead to changes in capillary diameter in acute slices. We tested the P2Y2/4 receptor (P2Y2/4R) agonist, UTP, which has been shown to directly activate pericytes leading to constriction in other systems (Kawamura et al., 2003; Peppiatt et al., 2006). Pericytes and capillaries were visualized in acute sagittal slices using TO-PRO-3 loading and transcardial perfusion of SR101 or TRD (Fig. 3A,B). SR101 was also taken up by B-cells and ependymal cells presumably due to dye leakage during slice preparation (validation not shown). This finding was previously reported and confirmed using several lines of transgenic mice expressing GFP under the human GFAP (hGFAP) or DCX promoter (Lacar et al., 2011), the former showing positive staining and the latter showing negative. Experiments were performed at 32−34°C. Pressure application of UTP (30–60 s, 100 μm) induced reliable capillary constrictions that could be reproduced two or three times per capillary (n = 47/56 trials, 18/19 capillaries; Fig. 3C–F). Line scans and associated surface plots were used to perform frame-by-frame diameter measurements thus limiting analysis to experiments where the capillary changes occurred and could be accurately measured throughout the movie (n = 9 trials, 6 capillaries; Fig. 3D). Two successive UTP applications induced similar constrictions of the same capillary, allowing us to test purinergic blockers (n = 4; Fig. 3F). We tested the broad-spectrum blocker of purinergic receptors suramin (100 μm) and the preferential P2Y2/4R blocker, PPADS (100 μm) (Lambrecht et al., 1992). Both suramin and PPADS blocked UTP-induced capillary constrictions (n = 3 capillaries each from three different animals; Fig. 3G).

UTP activation of pericytes leads to capillary constriction. A, B, Z-stack reconstruction of SR101-loaded capillaries (red) and TO-PRO-3-loaded pericytes (green) in a live sagittal slice. One Z-optical section in A illustrates a DIC image. C, One SR101 image before and during UTP application. Constrictions occur at several locations. The arrow points to a branchpoint where constriction occurred as evidenced by movement of the blood cells (SR101-negative region). The green line represents the location of a line scan to obtain surface plots before and during UTP application and measure vessel diameter. D, Surface plots before and during UTP application obtained by line scans obtained at the location shown marked by the green line in C. E, %Δ blood vessel (BV) diameter as a function of time. The mean and SEM (black, solid circles) are superimposed on individual traces (gray). F, %ΔBV diameter following two successive UTP application spaced by 15 min. G, Bar graph illustrating the percentage change in BV diameter in response to UTP application under control conditions (black bar) and in the presence of suramin (white bars) or PPADS (hatched bars). **p < 0.01. Scale bars: A–C, 15 μm.
To validate that pericytes were responsible for capillary constriction upon UTP application, we performed time-lapse imaging to monitor blood vessel diameters and calcium activity in pericytes and SVZ cells (Fig. 3G). P2Y2/4R are Gq-coupled receptors, the activation of which leads to intracellular calcium increases. SVZ cells were loaded with the calcium indicator Fluo-4 AM via pressure application inside the tissue (Lacar et al., 2010, 2011). TO-PRO-3-fluorescent pericytes were occasionally labeled with Fluo-4 AM (Fig. 4A–C). Other SVZ cells loaded with Fluo-4 essentially included B-cells and ependymal cells using our dye application method. We previously validated this finding comparing Fluo-4 AM loading to that of SR101 labeling and GFP expression in slices from mice expressing GFP under the hGFAP promoter (Lacar et al., 2011). UTP application induced calcium increases preferentially in pericytes that were followed by capillary constriction (Fig. 4C,D). Calcium increases in pericytes (ΔF/F0 of ∼170%, n = 6 trials, 4 pericytes) were significantly larger than those in SVZ cells (ΔF/F0 of ∼20%, n = 4 trials, 3 capillaries; Fig. 4E). Capillary constrictions followed the onset of Ca2+ increases by 12 s and lasted as long as pericytic Ca2+ remained increased (n = 6 trials; Fig. 4F). These data show that pericytes on SVZ capillaries express functional P2YRs, which upon activation, lead to capillary constrictions (Fig. 4G).

UTP increases calcium selectively in pericytes before capillary constriction. A, B, Images of SR101-loaded capillaries (red) and TO-PRO-3-loaded pericytes (green in A and white in B) in a live sagittal slice (DIC in A). B, Images of SR101-loaded capillaries and Fluo-4 AM loading from the square shown in C. The arrow points to a Fluo-4-loaded pericyte displaying Ca2+ increases during UTP application. D, Calcium activity (ΔF/F0) graph for a SVZ cell (open circles) and a pericyte (filled circles), and percentage change of blood vessel (BV) diameter as a function of time. The shaded box indicates UTP (100 μm) application. E, Peak ΔF/F0 in SVZ cells (green, n = 4 trials, 3 capillaries) and pericytes (blue; n = 6 trials, 4 pericytes) and the resulting mean ΔBV diameter (n = 9 trials, 6 capillaries) upon UTP application. F, Time courses of ΔF/F0 in pericytes and ΔBV diameter relative to the onset of UTP application. G, Diagram illustrating the presence of P2YR selectively in pericytes. UTP application activates these receptors leading to calcium increase in pericytes followed by capillary constriction. Scale bars: A–C, 20 μm.
Electrical stimulation of SVZ cells induces capillary constriction
To examine whether activation of SVZ cells could lead to a vascular response, we monitored intracellular calcium levels and capillary diameters following electrical stimulation in the SVZ (Fig. 5A). Intracellular calcium changes were used as a readout of SVZ cell responses to stimulation because calcium levels increase during cell cycle progression in different cell types and is the means of SVZ cell communication (Berridge, 1995; Owens et al., 2000; Bootman et al., 2001; Lipskaia and Lompré, 2004; Schreiber, 2005). Upon electrical stimulation in the SVZ (10 Hz for 1–10 s), calcium increases propagated across SVZ cells and reached cells or processes adjacent to capillaries (Fig. 5B,C). Such stimulation paradigm was chosen to match the protocol previously used in another study evaluating pericyte-mediated capillary constriction outside the SVZ (Peppiatt et al., 2006). The electrical stimulation resulted in a calcium wave and a constriction in 77% of capillaries (n = 10/13 capillaries, 47 trials; Fig. 5C,D). Capillary diameters decreased by 18 ± 4% (n = 7 trials, 4 capillaries) and these decreases were reproducible following successive stimulations (n = 3 capillaries; Fig. 5E,G). The onset of calcium increases in the cells touching capillaries (perivascular ΔF/F0 of 139 ± 59%, n = 4 trials, 3 capillaries) preceded the onset of constriction by ∼9 s (n = 7 trials, 4 capillaries; Fig. 5F). Electrically induced calcium increases that failed to propagate to perivascular cells did not induce constriction (n = 7 trials, 5 capillaries;, data not shown). These data suggest that electrical stimulation did not directly depolarize pericytes, but required SVZ cell activity. Finally, suramin (100 μm) blocked electrically induced capillary constriction (n = 3 capillaries, 3 animals; Fig. 5H) without affecting calcium propagation in SVZ cells (data not shown). Thus, a calcium wave in SVZ cells that propagates to perivascular cells leads to a vascular response through activation of purinergic receptors likely in pericytes.

Electrical stimulation of SVZ cells induces capillary constriction. A, Diagram illustrating the experimental paradigm. B, TLCR of an electrically induced calcium increase in SVZ cells propagating to a capillary branchpoint. When a pixel exceeds a threshold, its intensity is assigned a color at the time point indicated by the color map. C, Average T-stack of 2 and 5 Fluo-4 AM and TRD images, respectively, poststimulation (period 156.5–173.1 s as shown in D). Stimulation (200 μA, 200 μs, 10 Hz) occurred at 90 s. The dashed lines indicate the location of the electrode. The yellow dashed line indicates where the blood vessel (BV) diameter was measured. Colored squares in C represent ROIs for calcium measurements shown in D. Acquisition was at 0.3 Hz. Inset, Representative of a reslice image of the capillary in C that was used to measure changes (Δ) in BV diameter over time. D, Calcium activity (F/F0) graph for the ROIs shown in C and percentage (%) of capillary constriction (ΔBV diameter) as a function of time. E, Peak calcium changes in perivascular cells following electrical stimulation and mean corresponding change in BV diameter. F, Temporal relationships of perivascular calcium transients and ΔBV diameter following stimulation. G, %ΔBV diameter following two successive electrical stimulation applications spaced by 20 min. H, Bar graph illustrating the percentage change in BV diameter following electrical stimulation under control conditions (black bar) and in the presence of suramin (white bars). **p < 0.01. Scale bars: B, 25 μm; C, 15 μm; C, inset, 10 s/2 μm.
Selective calcium increases in B-cells induce changes in capillary diameters through ATP release
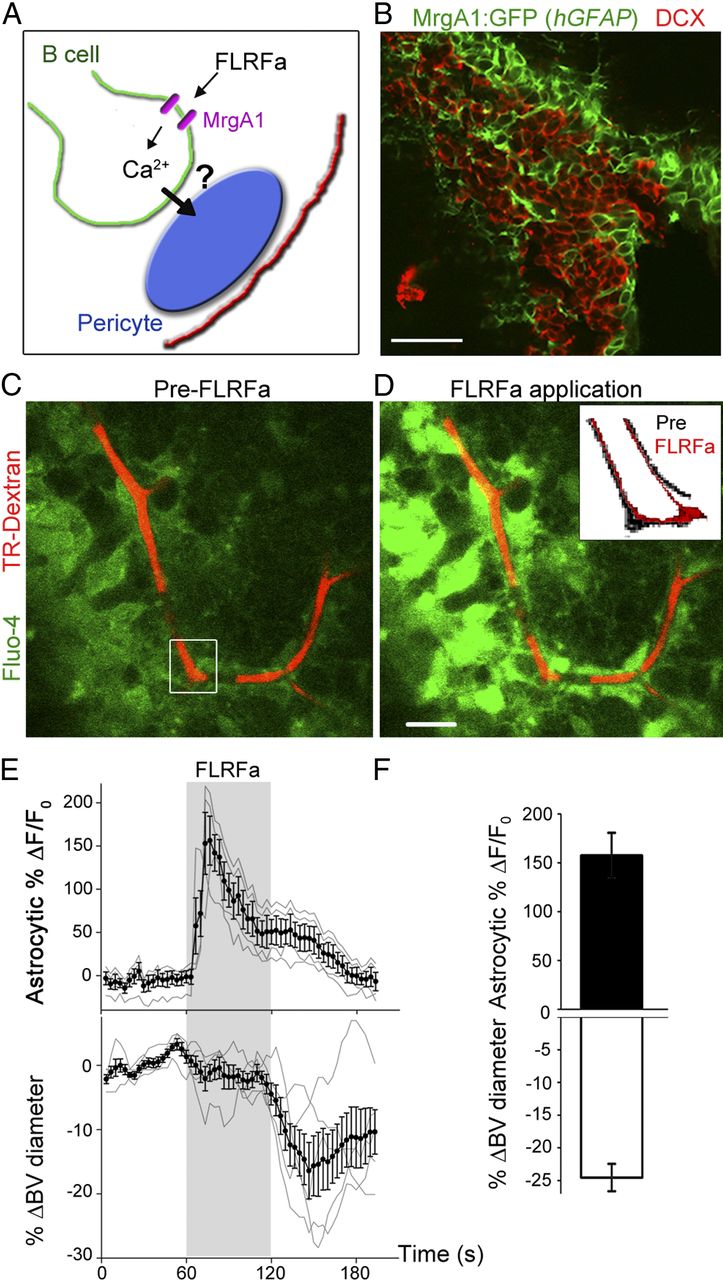
Because B-cells ensheath pericytes (Fig. 2) and have been shown to be involved in calcium waves (Lacar et al., 2011), we next examined whether calcium increases in B-cells lead to changes in capillary diameter (Fig. 6A). To selectively increase calcium in B-cells, we used transgenic mice that express a Gq-protein coupled receptor (MrgA1) in GFAP-expressing cells (Fiacco et al., 2007; Platel et al., 2010). Calcium increases can be evoked using an agonist that does not bind endogenous receptors in the brain. The MrgA1 receptor fused to GFP was targeted to GFAP-expressing cells using the tetracycline-controlled transcriptional activation-based Tet-Off system. Mice expressing the tetracycline transactivator (tTA) under the hGFAP promoter were crossed to mice in which the MrgA1 receptor was transcribed under the Tet (TetO) minimal promoter. In the SVZ of hGFAP-tTA::TetO-MrgA1-GFP mice (referred henceforth as hGFAP-MrgA1 mice), GFP is selectively expressed in B-cells (data not shown) (Platel et al., 2010) but not in neuroblasts (Fig. 6B) nor in pericytes (Fig. 2E). Pressure application of a peptide selective for MrgA1 receptors, phe-leu-arg-phe amide (FLRFa, 50 μm, 30–60 s), induced calcium increases in GFP+ cells, i.e., B-cells, followed by capillary constriction (21 trials, n = 12/24 capillaries; Fig. 6C–E). FLRFa did not induce either calcium increases or constriction in slices from nontransgenic or single transgenic mice (hGFAP-tTA or tetO-MrgA1 mice; data not shown). Capillary constrictions corresponded to a 24 ± 2% decrease in vessel diameter (n = 8 capillaries; Fig. 6F). Thus, calcium increases originating specifically in B-cells led to a capillary constriction.

Selective calcium increases in B-cells induce capillary constriction. A, Diagram illustrating the experiment paradigm with MrgA1 receptors selectively expressed in B-cells. FLRFa application is thus expected to lead to calcium increases selectively in B-cells. B, DCX immunostaining and GFP immunofluorescence in a coronal section from a hGFAP-MrgA1 mouse. C, D, Average time (t)-stack of 5 Fluo-4 AM and TRD images before (C) and during FLRFa application (D, corresponding to periods 43.3–60 and 70–86.6 s, respectively). Images were acquired at 0.3 Hz and FLRFa (50 μm, 60 s) was applied at 60 s. E, Calcium activity (%Δ F/F0) graph for perivascular B-cells (n = 4) and percentage ΔBV diameter (n = 5) as a function of time. The mean and SEM (black, solid circles) are superimposed on individual traces (gray). F, Peak ΔF/F0 in perivascular B-cells during FLRFa application and resulting mean ΔBV diameter. Scale bars: B–D, 15 μm.
B-cells of the SVZ release ATP in vitro (Striedinger et al., 2007) and SVZ pericytes express purinergic P2YRs, the activation of which leads to constriction (Fig. 3). We thus hypothesized that B-cells release ATP, which activates purinergic P2YR on pericytes resulting in capillary constriction. Under control conditions, capillary constrictions were reproducible with successive FLRFa applications allowing us to test the effects of pharmacological blockers on constriction (data not shown). Suramin (100 μm) blocked FLRFa-induced capillary constrictions (6 trials, n = 4 capillaries from 4 animals; Fig. 7B). The more selective P2YR blocker PPADS (100 μm) blocked FLRFa-induced constrictions (8 trials, n = 3 capillaries from 3 mice; Fig. 7A,B). These pharmacology experiments suggest that B-cells release ATP or a related metabolite activating purinergic receptors on pericytes (n = 7 capillaries). In addition, PPADS blocked the constriction without blocking FLFRa-induced calcium increases in B-cells (Fig. 7A). These results suggest that B-cells do not directly constrict capillaries, but need to activate pericytes through P2YR. Intriguingly, PPADS unmasked a small dilation induced by FLRFa application, which was absent in the presence of suramin. These data suggest that purinergic receptors other than P2YRs are involved in capillary dilation following B-cell stimulation. Collectively, these data suggest that calcium increases in B-cells result in ATP release and purinergic receptor activation in pericytes leading to changes in capillary diameters (Fig. 7C).

ATP released from B-cells activates purinergic receptors on pericytes leading to changes in capillary diameters. A, Calcium activity graph (normalized ΔF/F0) in a perivascular B-cell and corresponding %ΔBV diameter under control conditions (solid circles) and in the presence of PPADS (open circles, 100 μm). FLRFa (50 μm) was pressure applied as indicated by the shaded box. B, Bar graph illustrating the percentage change in blood vessel (BV) diameter in response to FLRFa application in hGFAP-MrgA1 mice under control condition (black bar) and in the presence of suramin (white bar) or PPADS (hatched bar). **p < 0.01. C, Diagram illustrating the FLRFa-induced mechanism of capillary constriction through P2YR.
Spontaneous calcium increases in B-cells induce changes in capillary diameters through ATP release
We previously reported the occurrence of spontaneous calcium waves traveling between B-cells to capillaries (Lacar et al., 2011). We thus imaged spontaneous calcium activity in B-cells and pericytes while monitoring capillary diameter at near-physiological temperature (Fig. 8A,B). As mentioned above and previously reported, Fluo-4 AM preferentially loaded B-cells (Lacar et al., 2011). Ependymal cells were occasionally loaded but did not show spontaneous calcium activity (Genzen et al., 2009). Calcium waves among B-cells were found to precede capillary constrictions (n = 10 capillaries; Fig. 8C,D). The onset of calcium increases in pericytes (ΔF/F0 of 245 ± 91%, n = 4) preceded the onset of capillary constriction by 16 ± 6 s (Fig. 8F). Capillary diameters decreased by 31 ± 6% (n = 7 recordings, 5 capillaries). Constrictions lasted ∼2 min and a half-amplitude constriction lasted ∼60 s (Fig. 8F). Spontaneous constrictions were absent in the presence of suramin (n = 8 capillaries, 11 recordings) and their incidence was significantly reduced to 20% of capillaries (n = 5; or 7.7% of recordings, n = 12) in the presence of PPADS (Fig. 8G). These data suggest that calcium increases in SVZ astrocytes result in ATP release and P2YR activation in pericytes leading to capillary constriction.

Spontaneous calcium waves in SVZ astrocytes controls capillary tone. A, DIC image of a portion of the SVZ containing pericytes on a capillary. B, Images at different time points of Fluo-4 AM signal of SVZ cells corresponding to the DIC image in A. C, TLCR of a spontaneous calcium increase in a neurovascular unit at period 10–30 s of the movie. When a pixel exceeds a threshold, its intensity is assigned a color at the time point indicated by the color map. Scale bar, 20 μm. D, Calcium activity (F/F0) graph for ROIs 3 and 4 in C and graph of the change of capillary diameter. The inlaid images show the pericyte at the two time points indicated during capillary diameter changes. Note the contraction of the pericyte during constriction. The boxed region for the calcium activity is expanded in E. E, Calcium activity graph for ROIs in C in the same time window of the color representation in C showing that activity propagates from SVZ cells to the pericyte. The colored points indicate when the activity fluorescence becomes color coded in C. F, Time courses of ΔF/F0 in pericytes and ΔBV diameter relative to the onset of pericytic calcium increase. G, Percentage of capillaries and recordings showing spontaneous constrictions in the presence of control solution, suramin, or PPADS. *p < 0.05.
Calcium increases in NPCs lead to increases in blood flow in vivo
To assess whether pericyte and B-cell activation results in blood flow increases or decreases in physiological conditions, we performed experiments in vivo. To monitor blood flow in vivo, we used an LDF microprobe with an ∼100 μm sampling radius. The LDF microprobe measures the Doppler shift (i.e., the frequency change or wave length) that light waves undergo when they are reflected by moving red blood cells. The tip of a drug-filled and CellTracker Green-filled Hamilton syringe was inserted into the lateral ventricle to inject drug and label the site of drug application (Fig. 9A,B). The microprobe was inserted either in the SVZ (∼50 μm from the lateral ventricle, as shown in Fig. 9C after removal) or in the striatum. In each case, the probe location was verified postrecording in serially cut coronal sections (Fig. 9B).

UTP decreases blood flow while inductions of calcium activity in B1 cells increase blood flow in the SVZ in vivo. A, Diagram illustrating the position of the LDF microprobe and the CellTracker Green (CTG)-containing pipette. B, Image of a coronal section containing the SVZ and the tracks from the LDF and CTG-containing injection pipette. C, Zoomed image of the recording region from a different slice than in B. D, Z-stack image of MrgA1:GFP-expressing B-cells (examples shown with arrows) and ependymal cells (arrowheads) in a 3-week-old rat section following electroporation of pCAG-MrgA1:GFP at P0. Inset, One section with DIC overlay to better visualize the location of the GFP+ cell soma near the lateral ventricle. E, Mean percentage change in blood flow (± SEM) against time that was obtained in the SVZ during and following FLRFa (red) and UTP (black) applications and striatum (gray) following FLRFa injections into the lateral ventricle. F, Diagram illustrating the simplified cellular arrangement of SVZ cell around capillaries and mechanisms of vascular coupling in the SVZ. Our model suggests that Ca2+ increases in B1 cells during entry or progression through S-G1 phase or upon GABA release from neuroblasts or striatal neurons triggers Ca2+ propagation to other B1 cells leading to the release of ATP, ATP metabolites, and presumably other vasoactive factors (e.g., glutamate). Those activate receptors on pericytes leading to a constriction or dilation depending on the metabolites.
UTP injections (1–10 mm, 20–30 s) into the lateral ventricle led to a significant 11.4 ± 1.9% decrease in blood flow in the SVZ (n = 5 applications; Fig. 9E, black circles). These data are consistent with the slice data showing pericyte-induced constrictions following UTP applications. We next examined the role of B1 cells on blood flow in vivo. We used in vivo electroporation of a plasmid encoding the MrgA1:GFP receptors into NPCs at P0–P1 located along the lateral ventricle (Lacar et al., 2010; Platel et al., 2010). As mentioned previously, at 3–4 weeks postelectroporation essentially B1 cells and ependymal cells express MrgA1:GFP receptors (Fig. 9D). We recently reported that B1–B1 cells and B1–B2 cells are coupled through gap junctions and thus form a large communication network (Lacar et al., 2011). Therefore, increases in calcium in one electroporated B1 cell will likely lead to calcium increases in 50–100 surrounding B1–B2 cells that are not electroporated. In 4- to 5-week-old rats electroporated with pCAG-MrgA1:GFP plasmid at P0, we injected FLRFa (500 μm to 1 mm, 30–40 s) into the lateral ventricle and monitored blood flow in the SVZ. FLRFa injections significantly increased blood flow by 30.0 ± 1.3% in the SVZ (n = 3/5 animals; Fig. 9E, red circles). The absence of a decrease in blood flow expected from the slice data may be the result of technical differences between slices and in vivo and will be discussed below. Occasional GFP+ cells were found in the striatum since radial glia also generate some striatal astrocytes (data not shown). However, FLRFa injection into the lateral ventricle did not induce any change in blood flow in the striatum (Fig. 9E, gray circles). These latter data suggest that the increase in blood flow measured in the SVZ came from activation of SVZ cells. Collectively, these data show that calcium increases in B1 cells led to increases in blood flow.
Discussion
The present study provides the first mechanistic insight into blood flow regulation in the neurogenic SVZ of young rodents. Our data show that NPCs, known as the B1 cells, directly project onto pericytes on capillaries and regulate capillary blood flow through pericyte activation. One of the vasoactive molecules released by B1 cells was ATP or an ATP metabolite leading to vasoconstriction in acute slices. The molecules involved in vasodilation in vivo remain to be identified, but candidates such as adenosine are discussed below.
B-cells control capillary tone in the SVZ through pericytes
The SVZ has been shown to contain mainly capillaries as opposed to arterioles (Mirzadeh et al., 2008; Shen et al., 2008; Tavazoie et al., 2008; Snapyan et al., 2009; Lacar et al., 2011, 2012), which is further confirmed here. The SVZ displays a specific cellular arrangement around capillaries. Pericytes are distributed all along capillaries with their processes wrapping these vessels. B-cells, especially B1, send processes toward capillaries as previously shown (Mirzadeh et al., 2008; Lacar et al., 2011) and ensheath pericytes. B1 cells act as NPCs in the SVZ (Mirzadeh et al., 2008; Beckervordersandforth et al., 2010). The cellular arrangement, B cell–pericyte–capillary, forms a neurovascular unit in the SVZ.
Pericytes have been shown to have contractile properties (Kawamura et al., 2003; Peppiatt et al., 2006; Fernández-Klett et al., 2010). Here, we found that UTP-dependent P2Y2/4R activation in pericytes led to intracellular calcium increases followed by capillary constriction. We were able to image calcium activity in pericytes labeled in acute sections with TO-PRO-3. The mechanism of this loading is unclear and identifying it is outside the scope of this study. We did not observe clear calcium increases in SVZ cells upon UTP application in our system. However, P2Y2/4Rs have been reported in mature astrocytes on arterioles (Simard et al., 2003) and in neurospheres from E16 mice (Lin et al., 2007). The differences with respect to expression of P2Y2/4R could be attributed to different brain areas or experimental models. Thus, pericytes in the postnatal SVZ have the ability to regulate capillary tone.
We found that calcium increases in B-cells using hGFAP-MrgA1 mice led to changes in capillary diameters. It remains unclear why not all capillaries responded to increasing calcium levels in B-cells by constricting. When constriction was observed, calcium increases in B-cells preceded calcium increases in pericytes that were followed by constrictions. We have similar findings in experiments reporting spontaneous calcium activity in B-cells. These data suggest a sequence of events from B-cells to pericytes to capillary. In addition, PPADS prevented calcium increases in pericytes but not in B-cells, suggesting that B-cells do not directly control capillary tone, but rather activate pericytes. We increased calcium in B-cells as a means of stimulation for two main reasons. Striatal neurons project into the SVZ and lead to calcium activity in SVZ presumably including B-cells (Dave et al., 2008). Calcium increases during cell cycle progression in different cell types (Berridge, 1995; Owens et al., 2000; Bootman et al., 2001; Lipskaia and Lompré, 2004; Schreiber, 2005) and S phase entry of NPCs correlates with a local increase in blood flow in the SVZ (Lacar et al., 2012). It remains to be examined whether firing of striatal neurons or C- or B-cell progression through the cell cycle is accompanied by capillary constriction, but this is outside the scope of the present work.
B-cells have been divided into B1 and B2 cells. Here, we further confirmed that B1 cells directly contact capillaries. But we previously reported that B2 cells also contact capillaries; in addition, B1 and B2 form gap junctional networks and display calcium waves (Lacar et al., 2011). Considering that pericytes' processes cover the whole capillary, B1 cells and/or B2 cells could release vasoactive substances and contribute to pericyte activation. In the MrgA1 mice, both B1 and B2 cells experience calcium increases. However, the in vivo data discussed below used neonatal electroporation to selectively express the MrgA1:GFP receptors in B1 cells (i.e., NPCs) and thus support a role of B1 cells and thus NPCs in the control of blood flow regulation. Two scenarios are thus conceivable. B1 cell activation leads to B1–B1 calcium waves resulting in pericyte activation or B1-to-B2 calcium waves and indirect pericyte activation through B2 cells.
NPCs known as the B1 cells regulate blood flow in vivo
Using an LDF microprobe in the SVZ, we found that UTP induced a decrease in SVZ blood flow that is in agreement with capillary constriction. In addition, we found that calcium increases in slow-cycling B1 cells, i.e., NPCs, increased blood flow. Although neonatal NPCs also generate ependymal cells in addition to B-cells, ependymal cells do not contact blood vessels and calcium increases in ependymal cells do not propagate to other SVZ cells including B-cells (B. Lacar, J.-C. Platel, and A. Bordey, unpublished observations; Genzen et al., 2009). It is thus unlikely that calcium increases in ependymal cells contributed to changes in blood flow. Collectively, the in vivo data using sophisticated approaches show that B1 cells/NPCs regulate blood flow in the SVZ neurogenic niche and that calcium increases are one of the triggers for B1 cell activation of the vasomotor response.
B-cell-released ATP is one vasoactive factor among other possible candidates
The data presented here suggest that B-cells release ATP or a metabolite leading to pericyte activation (i.e., calcium increases) and capillary constriction. Indeed, here is a series of supporting evidence: (1) pericytes express P2Y2/4Rs, the activation of which leads to calcium increases in pericytes and capillary constrictions; (2) in hGFAP-MrgA1 mice, suramin and PPADS prevented capillary constriction and calcium increases in pericytes induced by FLRFa-induced calcium increases in B-cells; and (3) we previously reported that spontaneous calcium waves among B-cells persisted in suramin (Lacar et al., 2011). Here, we found that constrictions were not detected in the presence of suramin further suggesting the involvement of released ATP from B-cells and purinergic receptor activation on pericytes.
Intriguingly, we found that PPADS unmasked a capillary dilation following calcium increases in B-cells. In addition, the in vivo vasomotor response was a dilation following calcium increases in B1 cells. These data suggest that vasoactive molecules other than ATP are also released by B-cells and/or that ATP is predominantly degraded into adenosine in vivo leading to dilation. Indeed, we found that adenosine applications led to capillary dilation in the SVZ (19–30%, n = 4/7; B. Lacar, C. Kubera, and A. Bordey, unpublished observations). A recent study showed that reducing bath O2 concentrations from 95% (like here) to 20% has been shown to prevent arteriole constriction in response to glutamate receptor stimulation in the parenchyma (Gordon et al., 2011). The prevention of the vasoconstrictions in the low O2 environment was, in part, attributable to the presence of adenosine. The slice condition may be thus more prone to low ATP ectonucleotidase activity and thus limited adenosine formation. The SVZ is enriched in functional ATP ectonucleotidase (Braun et al., 2003; Lin et al., 2007). Among other signals, B-cells release glutamate (Platel et al., 2010) that has been shown to induce capillary dilation (Peppiatt et al., 2006). Glutamate release is calcium dependent and was also observed using the hGFAP-MrgA1 mice (Platel et al., 2010). B-cells may likely release other factors such as growth factors that may affect the capillary response. In addition, in vivo the blood circulation may impact the composition of the SVZ microenvironment not just in terms of oxygen and glucose levels, but also blood-derived hormones and growth factors that may affect the released content from B-cells. Still, additional studies are required to provide greater understanding of the molecular mechanism contributing to blood flow regulation in the SVZ.
In conclusion, our study provides a scenario where proliferative or active NPCs control metabolic-vascular coupling in the SVZ through pericytes. NPCs receive signals from other SVZ cells (e.g., GABA) and perhaps striatal neurons (Liu et al., 2005; Dave et al., 2008) leading to calcium increases and a large communication network through gap junction (Liu et al., 2005; 2006; Lacar et al., 2011). Thus, our data suggest that NPCs act as directors and transducers of neurometabolic coupling in the SVZ. It is also intriguing to think that local changes in blood flow could affect the proliferation or migration of SVZ cells through uptake of growth factors and hormones into the SVZ milieu. Changes in oxygen and glucose could impact cell proliferation; changes in the mechanical forces observed during constriction or dilation may also affect the behavior of NPCs (McBeath et al., 2004; Engler et al., 2006; Wang and Thampatty, 2008; Leipzig and Shoichet, 2009). Finally, treatments that limit or decrease calcium activity in SVZ cells may thus be exploited to control blood perfusion through the neurogenic zone and SVZ-derived tumors (Jain, 2005; Gilbertson and Rich, 2007). Indeed, brain tumors are highly vascularized allowing them to receive nutrients. The tumor vessels are essentially capillaries containing pericytes (Jain, 2005). Increasing capillary constriction through pericyte activation could limit nutrient accessibility to the tumor. Vice versa, a transient increase in blood flow by targeting calcium activity in SVZ cell-derived tumors could improve delivery of chemotherapy treatment.
Notes
Supplemental material including Movie S1: UTP induces calcium increase in pericytes and capillary constriction, Movie S2: electrical stimulation leads to capillary constriction, Movie S3: FLRFa-induced calcium increases in B-cells leads to capillary constriction in a slice from an hGFAP-MrgA1 mouse, and Movie S4: spontaneous calcium waves in B-cells precede calcium increases in a pericyte and capillary constriction is available at http://lacarbordey.shutterfly.com/pictures/6. Movies are acquired at 0.3 Hz and played at 15 frames/s. In Movies S1 and S4 the first frame illustrates TO-PRO-3-loaded pericytes (blue). This material has not been peer reviewed.
Footnotes
This work was supported by grants from CT Stem Cell initiative (A.B.), Pardee Foundation (A.B.), Yale Brown-Coxe fellowship (J.-C.P.), National Institutes of Health (P30 NS52519, F.H.), and a National Science Foundation Graduate Research Fellowship (B.L.). We thank Dr. Ken McCarthy (University of North Carolina) for generously providing the hGFAP-MrgA1 mice, Dr. Jonathan Genzen for identifying the selective loading of pericytes, and Dr. Nicholas C. Spitzer and Bordey lab members for helpful comments on the manuscript. We are also grateful to Dr. Xinzhong Dong for providing the MrgA1:GFP-containing vector. This manuscript is based on work partly supported by the State of Connecticut under the Connecticut Stem Cell Research Grants Program. Its contents are solely the responsibility of the authors and do not necessarily represent the official views of the State of Connecticut, the Department of Public Health of the State of Connecticut, or CT Innovations, Inc. The funders had no role in study design, data collection and analysis, decision to publish, or preparation of the manuscript.
- Correspondence should be addressed to Dr. Angélique Bordey, Department of Neurosurgery, Yale University School of Medicine, 333 Cedar Street, FMB 422, New Haven, CT 06520-8082. angelique.bordey{at}yale.edu


