


Abstract
We previously identified in the chicken CYP2H1 gene an upstream enhancer domain (−5900/−1100) that responds to phenobarbital. Deletion and restriction enzyme analyses of this domain have now identified two separate enhancer regions that respond to phenobarbital (from −5900 to −4550 and from −1956 to −1400). We have focused here on the latter and in particular a resident 240-base pair (bp) restriction enzyme fragment that retains drug responsiveness. Using deletion analysis and in vitro DNase I footprinting, transcription factor binding sites have been located in the 240-bp fragment. The sites identified are an E-box-like element, a consensus hepatocyte nuclear factor 1 site, a CCAAT box motif, and a novel site. Mutagenesis demonstrated that each site contributed to enhancer activity, although there was a weaker contribution from the CCAAT box, and that no individual site was critical for responsiveness. In keeping with the tissue-restricted expression of the CYP2H1gene, gel shift experiments established that the proteins binding to these enhancer sites are enriched in chicken liver, kidney, and small intestine. In vitro footprint experiments showed a stronger protection with liver nuclear extracts from drug-treated chickens compared with control extracts on the E-box-like element, the CCAAT box motif, and the novel binding site; however, the basis for this apparent increase in binding remains to be determined. The proteins binding to the 240-bp fragment are different from those recently reported to be required for the activity of the phenobarbital responsive enhancer domains of rodentCYP2 genes.
Cytochrome P-450s (P450s) compose a large superfamily of heme proteins; many are key detoxification enzymes that catalyze the first step in a biotransformation process (Gonzalez, 1990; Denison and Whitlock, 1995). In this process, foreign chemicals are oxidized by specific microsomal P450s to forms that can be either excreted directly from the body or further modified by conjugating enzymes before excretion. The synthesis of specific P450 isozymes can be selectively induced, notably in the liver, by different classes of foreign chemicals; this makes biological sense, because the inducers are generally substrates for the induced P450s (Gonzalez, 1990; Okey, 1990).
The sedative drug phenobarbital, one of the best-known inducers, increases the transcription of specific CYP genes in mammals (Waxman and Azaroff, 1992), chickens (Mattschoss et al., 1986; Hansen et al., 1989; Dogra et al., 1998) and also in bacteria such as Bacillus megaterium (He and Fulco, 1991; Shaw et al., 1998). The molecular details underlying the phenobarbital induction mechanism in rodents are under investigation; DNA binding proteins associated with upstream drug-responsive enhancer regions have been reported recently for the drug-inducible rat CYP2B1/2(Trottier et al., 1995; Kim and Kemper, 1997; Stoltz et al., 1998) and mouse CYP2b10 (Honkakoski and Negishi, 1997; Honkakoski et al., 1998) genes. The involvement of a receptor protein that binds phenobarbital is attractive (Waxman and Azaroff, 1992), but none of the DNA binding proteins identified to date seems to fulfill this function. By contrast, well characterized, ligand-dependent nuclear receptors have been identified that mediate the response of specificCYP genes and other target genes to both polycyclic aromatic hydrocarbons (Burbach et al., 1992; Denison and Whitlock, 1995) and peroxisome proliferators (Issemann and Green, 1990). Recently, a receptor was identified that activated expression of theCYP3A gene family in response to pregnenolone-16α-carbonitrile (Kliewer et al., 1998).
Genes for phenobarbital-inducible P450 in chicken have been isolated (Mattschoss et al., 1986). We are investigating the chickenCYP2H1 gene, which is markedly induced in a tissue-specific fashion (Hansen et al., 1989). Transient expression studies in cultured chick embryo hepatocytes have identified both an upstream enhancer domain, located between −5900 and −1100, that responds to phenobarbital (Hahn et al., 1991) and a proximal promoter region of 160 base pairs (bp) that binds multiple liver-enriched transcription factors and directs basal expression but does not respond to phenobarbital (Dogra and May, 1997).
One important issue concerns the role of the upstream enhancer domain of the CYP2H1 gene in the induction mechanism and its relationship to the rodent enhancers. In this article, we have analyzed the CYP2H1 domain and identified a region that responds to phenobarbital. We have characterized, by in vitro footprinting and gel shift analysis, the transcription factors that bind to the region and discuss the implications of our findings on the mechanism of phenobarbital induction of CYP genes in eukaryotes.
Materials and Methods
Plasmid Constructions.
To locate the phenobarbital-responsive region in the 4.8-kilobase (kb)BamHI enhancer domain, BamHI (−5900 to −1100), BglII/XhoI (−1956 to −1400),BglII/StuI (−1956 to −1640), andStuI/XhoI (−1640 to −1400) fragments were blunt-ended and cloned in the EcoRV site of the pBCSVp1 vector. This vector has been described (Clark et al., 1989) and contains the simian virus 40 (SV40) enhancerless promoter fused to the chloramphenicol acetyltransferase (CAT) gene. The chimeric enhancer-pBCSVp1 vectors, containing the 4.8-kb BamHI fragment in the forward orientation (p4.8-SVCAT) and the 556-bpBglII/XhoI fragment in the reverse orientation (pR556-SVCAT), were used to generate enhancer deletion constructs. These two vectors were digested with KpnI and SalI; progressive unidirectional deletions from theSalI end were created using an erase-a-base kit (Promega, Madison, WI). Deletion constructs from p4.8-SVCAT retained 4.1, 3.1, 1.9, and 0.8 kb of the 4.8-kb enhancer in the pBCSVp1 vector, whereas deletion constructs generated from pR556-SVCAT retained 205, 158, 141, 80, and 15 bp of the 240-bp enhancer region. From the 4.8-kb domain, other constructs were prepared that contained restriction enzyme fragments: pR1-SVCAT vector (BamHI/XbaI), pR2-SVCAT (XbaI/XbaI), and pR3-SVCAT (BglII/BglII) as shown in Fig 2A. These fragments were blunt-ended and cloned into the EcoRV site of pBCSVp1 vector upstream of SVCAT. All constructs were verified by restriction mapping and DNA sequence analysis.

Analysis of DNA fragments from the 4.8-kp enhancer and deletion analysis of the 556-bp sequence. A, plasmids with restriction enzyme fragments from the 4.8-kb enhancer (R1, R2, and R3) fused to the enhancerless SV40 promoter and a CAT reporter (SVCAT) were transfected into chick embryo hepatocytes and tested as described in Fig. 1. B, unidirectional deletions were generated in the 240-bp region of pR556-SVCAT. Plasmids containing various lengths of 556-bp enhancer fused to the enhancerless SV40 promoter and CAT reporter (SVCAT) were tested as in Fig. 1. The 240-bp fragment alone, cloned in pSVCAT in both the forward (→) and reverse (←) orientations, was also tested for drug response. CAT activities determined in cell extracts (100 μg of protein) were expressed as fold increase in CAT activity after phenobarbital treatment and are an average of three independent experiments ± S. D..
Site-Directed Mutagenesis of the 556-bp Fragment.
The 556-bp enhancer fragment was blunt-ended and cloned into the pBluescript KS+ vector in the EcoRV site in the reverse (XhoI/BglII) orientation. This construct (pR556-KS) was used as a template for site-directed mutagenesis using the Quick Change mutagenesis kit (Stratagene, La Jolla, CA). Mutations were introduced in the DNase I footprinted regions and confirmed by sequencing. The mutated fragments were then released from pR556-KS by digestion with KpnI/SmaI and cloned into pBCSVp1 at the corresponding sites to generate mutated enhancer CAT plasmids. The primers used are as follows, with mutations shown as underlined letters: mFP1−61GGCATTTCTGCAAT G A G CT C AATCACCTGA−32; mFP2−113GGGAGTTCAGAC CTGC A G ATTTAACCAAAC−84; mFP3−170GAGAGCAGTTATG AATTC GGCCTGGTCCTG−141; mFP4−221TTCAGAGACCG TCTAG ATACATAGCAATCT−192.
Cell Culture and Transfection.
Primary hepatocytes were prepared from 17-day-old chick embryos (Hahn et al., 1991). For transfection experiments, plasmid DNA was prepared by alkaline lysis and CsCl/ethidium bromide equilibrium density gradients and quantified by spectrophotometry. Transfection of DNA into primary hepatocytes (2 × 10⁷ per 0.8 ml) was performed by electroporation as described previously (Dogra and May, 1997). After transfection, each sample was split so that approximately 1 × 10⁷ cells were plated onto 60-mm dishes and cultured in William’s E medium plus 10% Serum Supreme (Edward Keller, Melbourne, Australia). In early experiments, Nu serum (Flow Laboratories, North Ryde, NSW, Australia) at 10% was used instead of Serum Supreme. Hepatocytes were incubated at 37°C for 24 h, after which media were changed; to one of the two plates, 25 μl of phenobarbital solution in phosphate-buffered saline (PBS) was added to a final concentration of 500 μM. The cultures were further incubated for 48 h and then CAT activities were determined.
CAT Assay.
Transfected cells were harvested in 40 mM Tris·HCl, pH 7.5, containing 1 mM EDTA and 150 mM NaCl, by scraping with a rubber policeman. The cells were pelleted and resuspended in 50 to 100 μl of 250 mM Tris·HCl, pH 7.6, lysed by three cycles of freezing and thawing, and centrifuged for 5 min to remove cell debris. The protein concentration of each sample was determined by protein microassay (Bio-Rad, Hercules, CA). For CAT assays, the cell supernatant was heated at 65°C for 6 to 8 min to remove deacetylase activity and CAT activity was then determined (Gorman et al., 1982). The acetylated products of [14C]chloramphenicol were separated by thin-layer chromatography. After autoradiography, CAT activity was quantified by cutting out the spots from the plate and measuring the radioactivity in a scintillation counter. The results were expressed as a percentage of acetylated chloramphenicol.
In Vitro DNase I Footprinting.
For DNase I footprint assays, two separate preparations of nuclear extracts were prepared (Gorski et al., 1986) and tested from the livers of two 8-week old chickens that were untreated or i.p. injected with phenobarbital (40 mg/kg b.wt. in 0.5 ml of dimethyl sulfoxide) in the morning and evening the day before sacrifice. The StuI/XhoI 240-bp fragment (−1640 to −1400) was blunt-ended and cloned in both orientations into the EcoRV site of pBCSVp1. For footprinting,KpnI/EcoRI fragments, representing the 5′-to-3′ and 3′-to-5′ directions of the 240-bp fragment, were obtained, radiolabeled by end-filling with [α-32P]deoxy-ATP using Klenow enzyme and purified by polyacrylamide gel electrophoresis. The DNase I footprinting reaction consisted of the following components in a final volume of 50 μl: 20 mM HEPES, pH 7.9, with 60 mM KCl, 60 mM EDTA, 0.6 mM dithiothreitol, 2 mM spermidine, 10% glycerol, 1 to 2 μg of poly(dI-dC), and 40 μg of nuclear protein extract from chicken liver. After incubation on ice for 10 min, the probe (25,000 cpm) was added and incubation was continued at 25°C for an additional 20 min. DNase I digestion and purification of the DNA was adapted from a method reported previously (Cereghini et al., 1987). In DNase I competition experiments, assays were performed with unlabeled competitor oligonucleotide at 2- and 10-ng concentrations in the binding reaction. The DNA products were analyzed on an 8% polyacrylamide sequencing gel. Fragments partially cleaved by G + A reactions were run as markers (Maxam and Gilbert, 1980). The DNase I digestion pattern in the absence of nuclear extracts was obtained using one-tenth as much DNase I in the reaction as in the presence of nuclear extract (0.05–0.1 U).
Gel Mobility Shift Assay.
Nuclear extracts used in gel mobility shift assays were prepared from chick embryo primary hepatocytes either untreated or treated with phenobarbital at 500 μM final concentration (Dogra and May, 1997). Nuclear extracts were also prepared (Schreiber et al., 1989) from the liver, kidney, small intestine, lung, and heart of 8-week-old chickens that were untreated or treated with an i.p. injection of phenobarbital (at 40 mg/kg b.wt. in 0.5 ml of dimethyl sulfoxide) in the morning and evening the day before they were they were sacrificed.
The DNA sequences of the double-stranded oligonucleotides encompassing footprinted regions A to D and used as probes in gel mobility shift assays follow, with added overhangs shown in lower case: FP1, 5′-tcgacGGCATTTCTGCAATCACCTGAg-3′ gCCGTAAAGACGTTAGTGGACTcagct; FP2, 5′-tcgaGACACAAATATTTAACCAAACC-3′ CTGTGTTTATAAATTGGTTTGGagct; FP3, 5′-cgAGAGTTATGTCAGTGGCCTat-3′, TCGTCAATACAGTCACCGGAtagc; and FP4, 5′-aattCCAATACATAGCAATCTGTCG-3′ GGTTATGTATCGTTAGACAGCttaa.
The oligonucleotides were radiolabeled by end-filling with [α-32P]deoxy-ATP and [α-32P]deoxy-CTP using Klenow enzyme. Binding reactions and the procedures for gel shift analysis were carried out as described previously (Dogra and May, 1997). Gel mobility shift competition assays were performed with unlabeled competitor oligonucleotide at 10- to 50-fold molar excess concentrations in the binding reaction. The sequence of the double-stranded oligonucleotide competitors used are as follows (additional nucleotides added to the ends are shown in lower case): MyoD 5′-ACCCAGACATGTGGCTGCCC-3′ TGGGTCTGTACACCGACGGG (Lassar et al., 1989); USF, 5′-gatcCGAATTCCACGTGACG-3′ GCTTAAGGTGCACTGCctag (Sawadogo and Roeder, 1985); HNF-1, 5′-TCGAGTGTGGTTAATGATCTACAGTTA-3′ AGCTCACACCAATTACTAGATGTCAAT (Cereghini et al., 1987); C/EBP, 5′-aattCAATTGGGCAATCAGG-3 GTTAACCCGTTAGTCCttaa (Landschulz et al., 1988); HNF-5, 5′-TAGAACAAACAAGTCC-3′ ATCTTGTTTGTTCAGG (Grange et al., 1991); and NF1, 5′-ATTTTGGCTTGAAGCCAATATG-3′ TAAAACCGAACTTCGGTTATAC (Chodosh et al. 1988). The double-stranded competitive mutant oligonucleotides (mFP1-mFP4) were the same as those used for site-directed mutagenesis.
Results
Progressive Deletion of the CYP2H1 5′ Flanking Region.
In a previous study, CAT reporter gene constructs containing 0.5 to 8.9 kb of 5′ flanking sequence of the chickenCYP2H1 gene were transiently expressed in chick embryo hepatocytes (Hahn et al., 1991). Maximal phenobarbital induction was observed with 8.9 kb of 5′ flanking sequence; inducibility was lost when this was reduced to 1.1 kb (Hahn et al., 1991). Removal of a 4.8-kb BamHI fragment (−5900 to −1100) from within the 8.9-kb sequence completely eliminated the drug response. This 4.8-kb fragment was subsequently shown to behave as a drug-responsive enhancer and to markedly increase the expression of the weak enhancerless SV40 promoter in transfected chick embryo hepatocytes (Hahn et al., 1991). Deletion analysis has now been used to locate drug-responsive regions within the 4.8-kb enhancer. 5′-End deletions of the 4.8-kb enhancer fused to the SV40 promoter/CAT reporter plasmid were introduced into chick embryo hepatocytes. As shown in Fig.1, progressive deletions from −4.8 to 0.8 kb (i.e., −5900 to −1900) did not substantially alter basal levels of CAT activity, but drug induction was reduced from about 7-fold (p4.8-SVCAT) to a final level of about 2-fold (p0.8-SVCAT). We also tested a 556-bp BglII/XhoI restriction enzyme fragment located near the 3′ end of the 4.8-kb enhancer (−1956/−1400). This fragment (p556-SVCAT) conferred about a 3-fold increase in the level of drug induction and a similar result was obtained with the fragment in the reverse orientation in pR556-SVCAT (Fig. 1).

Deletion analysis of the 4.8-kb enhancer domain. Plasmids with various length of enhancer from 4.8 kb to 0.8 kb fused to the enhancerless SV40 promoter and a CAT reporter (SVCAT) were transfected into chick embryo hepatocytes. p-SVCAT lacks enhancer sequence. p556-SVCAT contains 556-bp enhancer sequence from the 3′ end of the 4.8-kb enhancer in the 5′-to-3′ orientation and pR556-SVCAT in the 3′-to-5′ orientation. After transfection, each sample of the transfected hepatocytes was halved and phenobarbital at 500 μM added to one dish (phenobarbital-induced) and PBS to the other control dish. CAT activities were determined in cell lysates (50 μg of protein) after 48 h and expressed as a percentage of conversion of [14C]chloramphenicol to acetylated products. Values are the average of three independent experiments ± S.D.. The fold induction is shown in brackets.
Phenobarbital induction levels in the chick embryo hepatocytes were found to be increased by replacement of Nu serum in the culture media with Serum Supreme; under these conditions, the induction by the 556-bp fragment (pR556-SVCAT) was elevated from 3-fold (Fig. 1) to 6.7-fold (Fig. 2B). Serum Supreme was used in all subsequent experiments. Three restriction enzyme fragments located within the 4.8-kb enhancer and designated R1, R2, and R3 were fused to SVCAT and analyzed by transient transfection analysis (Fig. 2A). The fragment R1 (−5900/−4550 in pR1-SVCAT) induced CAT activity by 5.8-fold, whereas the other two fragments, R2 (−4550/−3760) and R3 (−3260/−2480), did not show any response to phenobarbital. These results demonstrated that there are two independent drug responsive regions in the 4.8-kb enhancer domain. By comparison with the deletion data in Fig. 1, it seems that the phenobarbital response observed with p3.1-SVCAT and p1.9-SVCAT is mainly contributed by the 556-bp enhancer region in p556-SVCAT.
To further narrow down the drug-responsive elements in the 556-bp enhancer region, two contiguous fragments were isolated, a 316-bpBglII/StuI fragment (−1956 to −1640) and a 240-bp StuI/XhoI fragment (−1640 to −1400); each was inserted into the expression plasmid pBCSVp1 in both orientations. Although the 556-bp region gave a 6.7-fold level of drug induction, the 240-bp fragment in either orientation resulted in a 2- to 3-fold increase (Fig. 2B, last two constructs), and the 316-bp fragment did not respond to phenobarbital in either orientation (data not shown). Hence, the 240-bp fragment contains sequence(s) responsive to phenobarbital, whereas another sequence(s) in the 316-bp fragment stimulates the level of this response.
The 240-bp fragment within the 556-bp enhancer was more precisely mapped by 5′ deletion analysis using the pR556-SVCAT plasmid (Fig. 2B). Deletion of sequence from −1400 to −1435 bp did not affect the response to phenobarbital (data not shown), but deleting the sequence to −1482 resulted in a diminished level of induction (6.7- to 4.5-fold). Reduction to −1499 further lowered induced activity (to 3-fold), whereas continued deletion to −1560 substantially lowered induction. Essentially no induction was observed with the −1625 deletion construct. These data indicate that multiple regulatory elements located from −1435 to −1625 contribute to drug responsiveness. Computer sequence analysis of the 240-bp fragment revealed a number of possible binding sites: a CCAAT box binding site at −208/−204 for either CCAAT/enhancer-binding protein (C/EBP) (Landschulz et al., 1988) or nuclear factor 1 (NF1) (Chodosh et al., 1988), an Sp1 site at −186/−181, two AP1 sites at −142/−136 and −43/−37, an H4TF2 site (Dailey et al. 1988) at −119/−115, a site for the liver-enriched hepatocyte nuclear factor (HNF5) (Grange et al., 1991) at −96/−90, and two E-box-like elements (Lassar et al., 1989) at −47/−42 and −38/−33 (Fig.3). We identified no sequence with similarity to the Barbie box element implicated in the phenobarbital mechanism in bacteria (He and Fulco, 1991).

DNA sequence of the 240-bp fragment. Protein binding sites as predicted by computer analysis are shown in reversed text (white) and numbered arbitrarily from the 5′ end of the fragment in its native orientation: C/EBP/NF1 (−208/−204), Sp1 (−186/−181), AP1 (−142/−136) and (−43/−37), H4TF2 (−119/−115), HNF-5 (−96/−90), and two E-box-like binding sites (−47/−42) and (−38/−33). The four footprinted sequences protected from DNase I cleavage are boxed and marked as A to D.
DNase I Footprint Analysis of the 240-bp Fragment.
Protein binding sites in the 240-bp fragment were investigated by in vitro DNase I footprint analysis using nuclear extracts prepared from the livers of phenobarbital-treated and control chickens. Four separate protected regions (A-D) were detected on both strands (Fig.4A). Whereas region A (−60 to −43) was very weakly protected with control nuclear extracts, strong protection was observed with extracts from drug-treated livers. This region contained one of the two E-box-like sequences (see Fig. 3). Region B (−104 to −80) was protected by nuclear extracts from both phenobarbital-treated and control livers and, as shown in Fig. 3, encompassed a possible binding site for HNF5 (Grange et al. 1991). Footprint C (−160 to −148), as with footprint A, was substantially stronger with extracts from phenobarbital-treated liver. Computer sequence analysis, however, did not reveal a binding site in region C for any known transcription factor. The protection of footprint D (−208 to −197) was slightly greater with extracts from drug-treated livers; this region contained a possible CCAAT box motif. It was noted that with nuclear extracts from drug-treated livers, there was no extension of the footprint pattern on any of the regions compared with control extracts. No footprint was detected over the putative Sp1, AP1, or H4TF2 sites.

DNase I footprint analysis of the 240-bp fragment. A, the 240-bp fragment was radiolabeled on the sense and antisense strands and footprint analysis was performed. The radiolabeled probe was incubated with liver nuclear extracts from control (Fig. 9, lane 3) or phenobarbital treated (Fig. 9, lane 4) chickens or without nuclear extract addition (Fig. 9, lane 2). The fragment was partially cleaved at G and A residues as a marker for the sequence (Fig. 9, lane 1). The DNase I protected regions (A-D) are bracketed. B, competition DNase I footprint analysis on the sense strand was performed with liver nuclear extracts from drug-treated chickens (Fig. 9, lanes 2 and 15). In the binding reaction, wild-type oligonucleotides corresponding to footprinted regions A to D (FP1-FP4) at 2 and 10 ng or their mutant counterparts (mFP1-mFP4) at 10 ng were incubated with nuclear extract from a drug-treated chicken and then subjected to DNase I cleavage. The fragment partially cleaved at G and A was run as a marker (Fig. 9, lane 1). The DNase I protected regions (A-D) are bracketed.
Competition experiments were performed with oligonucleotides (FP1-FP4) encompassing the footprinted regions A to D and also with corresponding mutant oligonucleotides (mFP1-mFP4). As shown in Fig. 4B, when FP1 was included in the binding reaction at 10 ng, the interaction of liver nuclear extracts from drug-treated chickens with regions A and C was prevented. Inclusion of either FP3 or FP4 at 10 ng noticeably prevented the binding of proteins to both regions A and C (the binding of proteins to region D was only very weakly altered by FP4 at 10 ng). FP2 at 10 ng inhibited binding to region B with minimal effect on other regions. None of the mutant oligonucleotides significantly affected binding. These competition experiments suggest that proteins binding to the enhancer, in particular to regions A and C, may bind in a cooperative fashion. In other experiments using gel shift analysis (see below) and cross competition, it was confirmed that protein binding to each site (A-D) was only competed by the corresponding oligonucleotide and not by any of the other three oligonucleotides (FP1-FP4) (data not shown), which indicates that the binding proteins are unrelated.
Functional Role of the Protein Binding Sites.
To evaluate the function of the protein binding sites identified from footprinting the 240-bp fragment, the sites were mutated singly or in combination in pR556-SVCAT (Fig. 5). The expression of CAT activity by wild-type pR556-SVCAT was increased 6.9-fold in the presence of phenobarbital. Mutagenesis of the E-box motif in footprint region A (5′-CACCTG-3′ to 5′-GAGCTC-3′) substantially decreased enhancer activity to 3.1-fold. Footprint region B was mutated at two different sites. The first mutation, located at the 3′ end of the footprint (5′-ACCAAA-3′ to 5′-GAGCTC-3′), did not affect enhancer activity (result not shown). A second mutation (5′-ACAAAT-3′ to 5′-CTGCAG-3′), which altered the first base of the putative HNF5-binding site (T to G), significantly lowered enhancer activity to 2.8-fold (Fig. 5). Mutagenesis of footprint region C (5′-GTCAGT-3′ to 5′-GAATTC-3′) also decreased enhancer activity to 2.9-fold, whereas alteration of footprint region D sequence (5′-AGCCAA-3′ to 5′-TCTAGA-3′) encompassing the putative C/EBP/NF1 site only moderately reduced enhancer activity (5.2-fold). When regions A and C (or regions B and D) were mutated in combination (Fig. 5), drug induction was substantially reduced, although some residual activity remained (1.7–2.0-fold). Also when regions B, C, and D were mutated together, enhancer activity was almost completely lost (Fig. 5). These mutagenesis results established that all four protein binding sites identified by footprinting are required for maximal enhancer activity of the 556-bp enhancer region and that no single binding site is critically required.
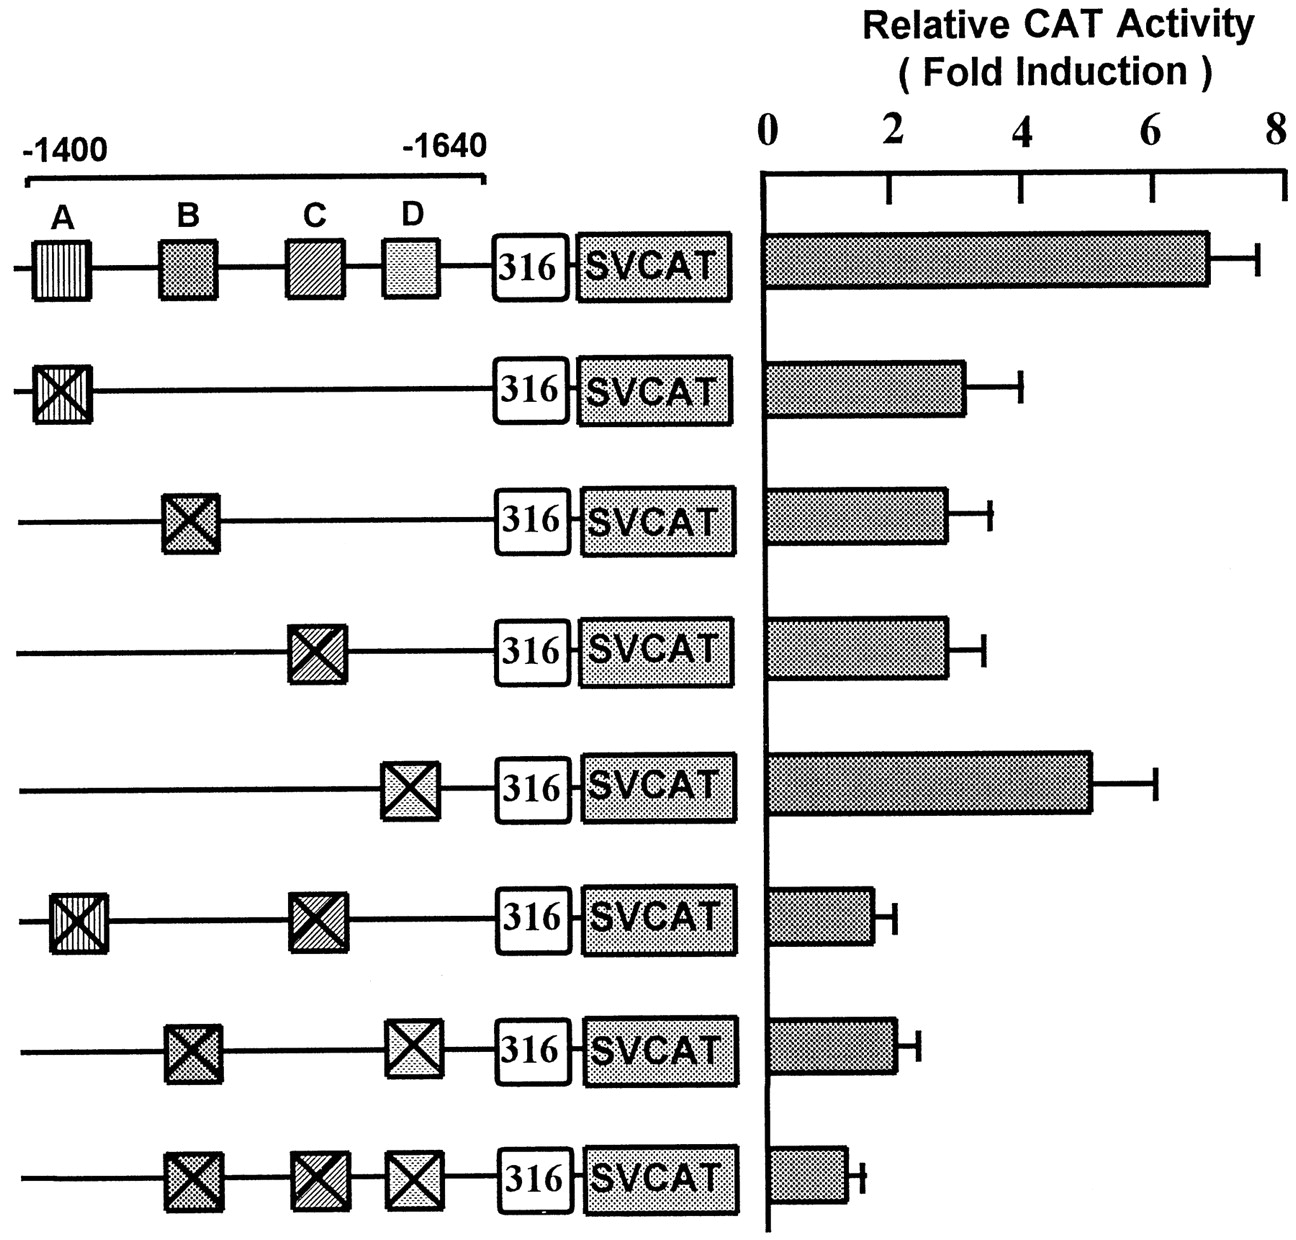
Functional role of the DNase I protected regions (A-D). Mutations were introduced into potential transcription factor binding sites in the DNase I protected regions A-D (⊠) in pR556-SVCAT. Constructs (4 pmol) containing the 556-bp enhancer fused to the SV40 promoter and CAT reporter (SVCAT) were transfected into chick embryo hepatocytes. The sample was divided into two and phenobarbital (500 μM final) added to one plate and PBS to the control plate. Hepatocytes were harvested after 48 h. CAT activities were measured in control hepatocytes (without drug) or induced hepatocytes (with drug) and expressed as fold increase in CAT activity after treatment with phenobarbital. CAT values are expressed as an average of three independent experiments ± S.D..
Gel Mobility Shift Analysis of the Footprinted Regions.
Gel mobility shift assays were used to characterize the proteins that bound to the footprinted regions. Double-stranded oligonucleotides (FP1-FP4) corresponding to the protected regions A to D were used in binding reactions with nuclear extracts prepared from untreated chick embryo hepatocytes and from phenobarbital-induced hepatocytes (Dogra and May, 1997). The mutated oligonucleotides for FP1-FP4 (mFP1-mFP4) were also used; they contained the same mutations that were tested in the functional assay of the 556-bp enhancer (see Fig. 5) and in the competitive DNase I footprint experiments (see Fig. 4B).
FP1, which contained an E box-like element, gave one major and two minor protein complexes; these complexes were of about the same intensity using either the drug-treated or control nuclear extracts (Fig. 6). In self-competition experiments, the formation of these complexes was efficiently prevented at a 10-fold molar excess of unlabeled FP1 but not with the corresponding mutated oligonucleotide, thus demonstrating the specificity of formation of the complexes. There was no competition for binding (Fig. 6, lane 8) with an oligonucleotide containing an E-box motif for MyoD (Lassar et al., 1989), whereas an oligonucleotide containing an E-box binding site for upstream stimulatory factor (USF) was a relatively strong competitor (Fig. 6, lane 9). The E-box sequence in FP1 (5′-CACCTG-3′) differs from the consensus USF site (5′-CACGTG-3′) at one position. FP1 was also found to bind recombinant USF (Fig. 6, lane 10), although the extent of binding was considerably weaker than that observed previously for the consensus USF site (Dogra and May, 1997). These results indicate that a member of the E-box family of transcription factors binds to footprint region A; this transcription factor may be USF or a related protein.
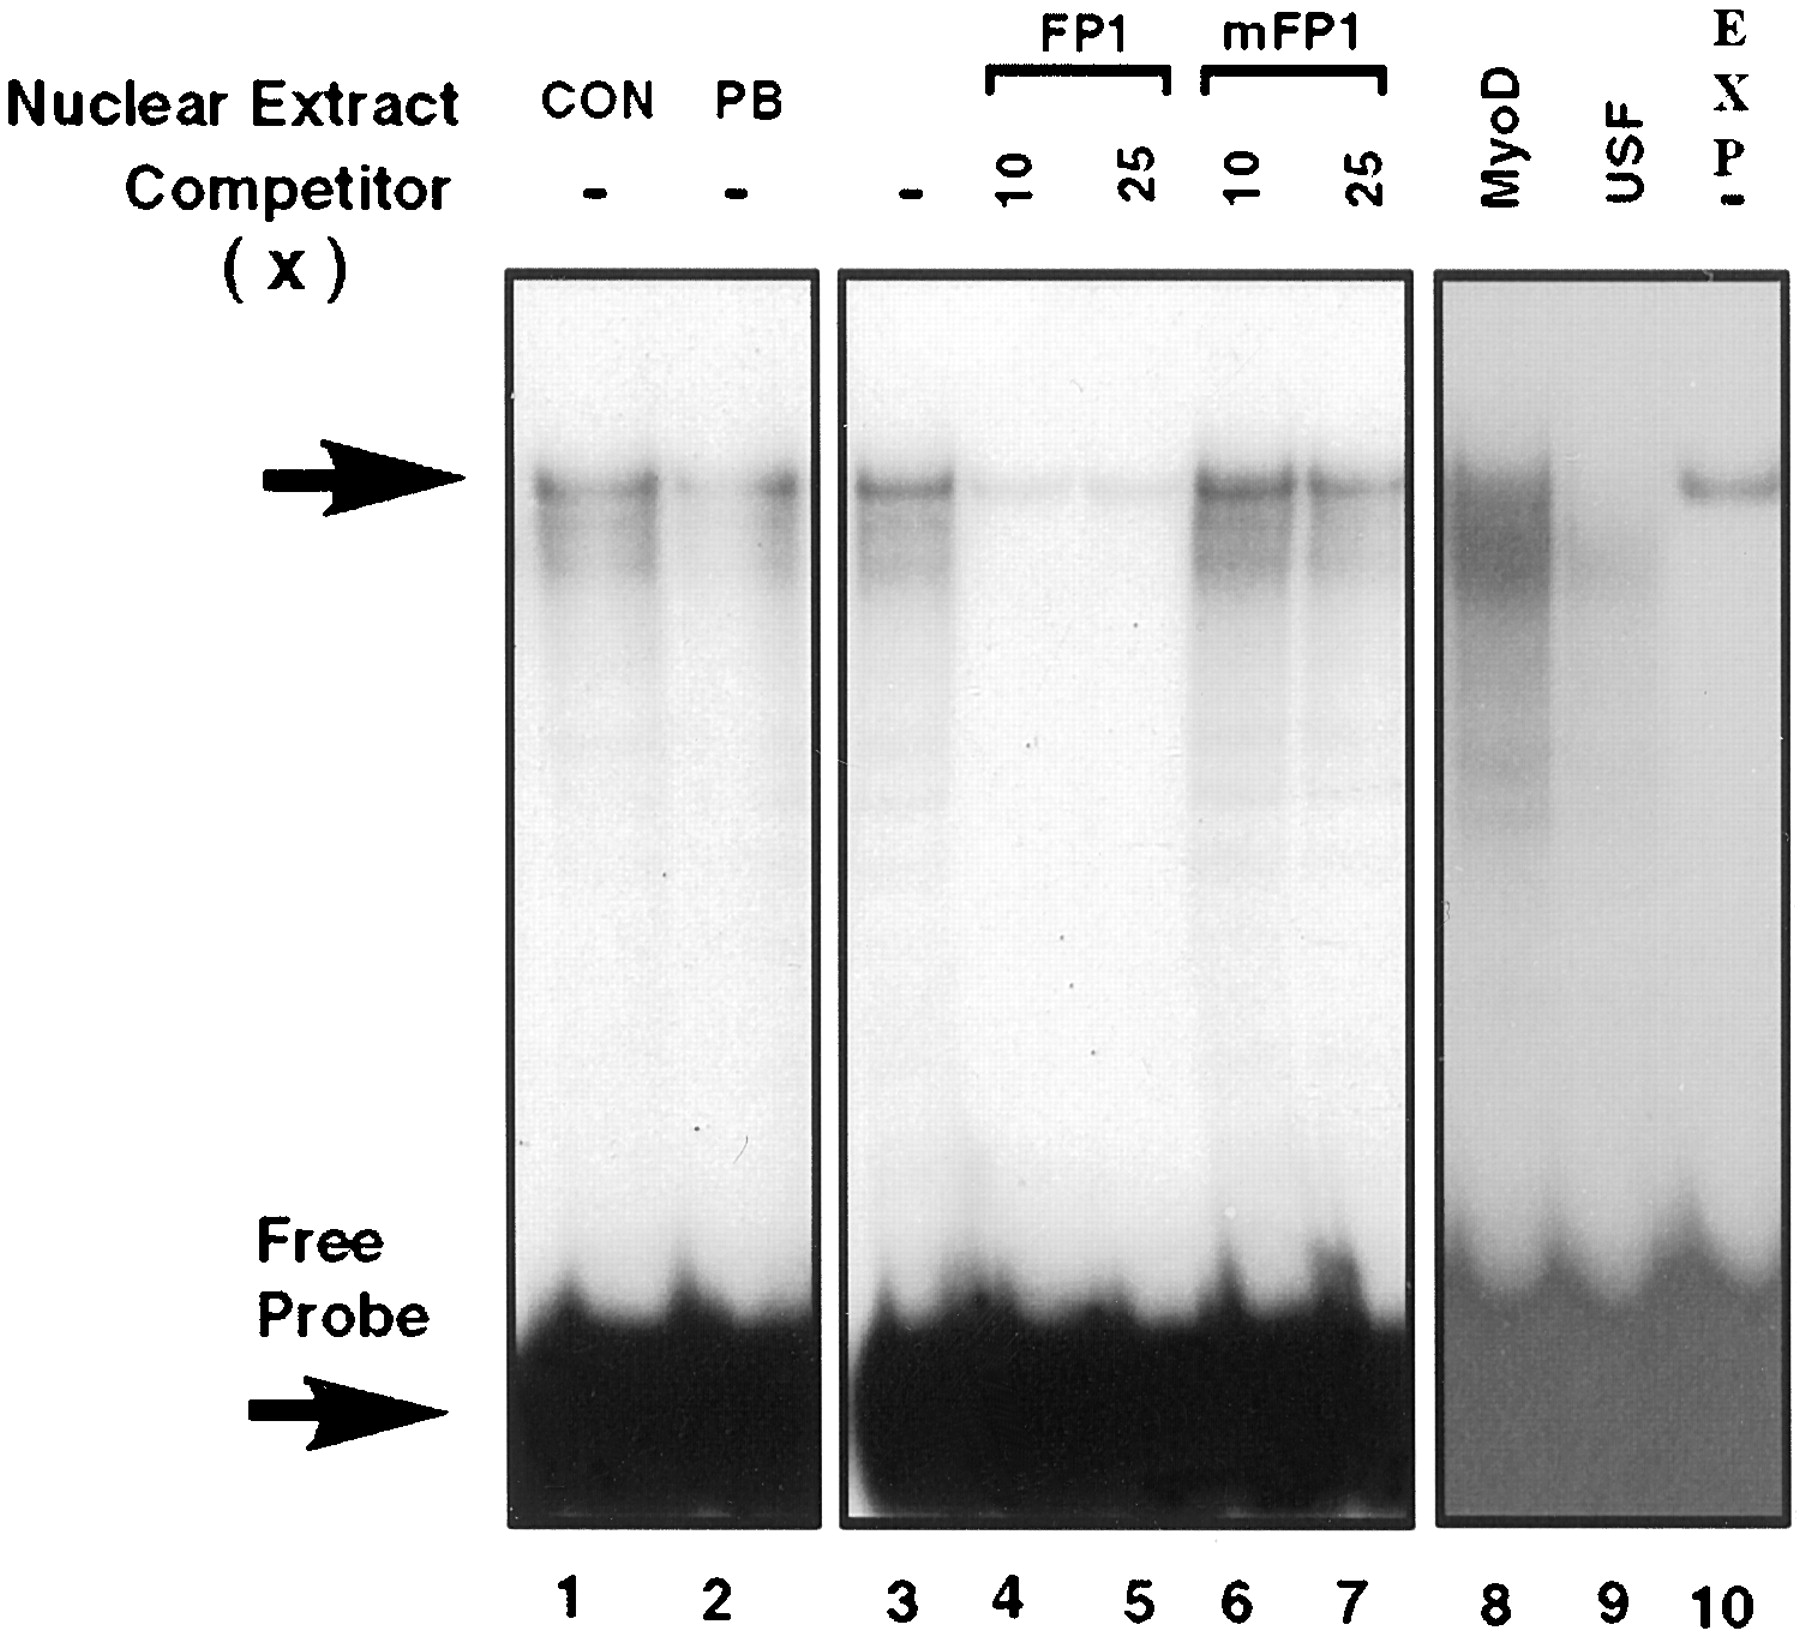
Gel mobility shift assays of footprinted region A. Assays were performed with radiolabeled double-stranded oligonucleotide FP1 using 3 μg of nuclear extract from control (CON) and phenobarbital induced (PB) hepatocytes (lanes 1 and 2). The major complex is indicated with an arrow. In competition experiments, nuclear extracts from control hepatocytes were incubated without competitor (lane 3) or with 10- and 25-fold molar excess of FP1 (lanes 4 and 5) and mFP1 (lanes 6 and 7). The probe was incubated with nuclear extract from control hepatocytes and competed with 30-fold molar excess MyoD oligonucleotide (lane 8) and 30-fold molar excess USF oligonucleotide (lane 9). Binding of bacterially expressed recombinant human USF (5 ng) is given in lane 10.
FP2, when incubated with nuclear extracts from control and phenobarbital-treated hepatocytes, gave three protein complexes (Fig.7), the amounts of which were the same with both extracts. In self-competition experiments, the formation of these complexes was totally inhibited with FP2 at 10-fold molar excess, but there was no effect with the mutant oligonucleotide mFP2 at 10- to 50-fold molar excess. A possible HNF5-binding site is located in footprint region B (Fig. 3). However, a competitor oligonucleotide containing an authentic HNF5 site (Grange et al., 1991) did not prevent the formation of the three complexes (Fig. 7, lanes 13 and 14). We noticed that the proposed HNF5 site at −96/−90 (5′-TATTTAA-3′) lies within a possible HNF1-binding site (5′-TGGTTAAATATTTGTG-3′) located on the negative strand and was not identified by computer sequence analysis as shown in Fig. 3. Therefore, competition experiments were also carried out with an oligonucleotide containing the functional HNF1 site from the rat albumin promoter (Cereghini et al., 1987). The formation of all three protein complexes was almost totally inhibited with this competitor at 10-fold molar excess (Fig. 7, lane 11). Moreover, the mobilities of these three protein complexes bound to FP2 are identical with those detected previously with a functional HNF1 site (Dogra and May, 1997) and correspond to dimers of HNF1α and HNF1β isoforms (Rey-Campos et al., 1991). In keeping with these findings, the mutation examined earlier (5′-ACAAAT-3′ to 5′-CTGCAG-3′) that substantially lowered enhancer activity (see Fig. 5) altered three bases in the HNF1-binding site.

Gel mobility shift assays of footprinted region B. Radiolabeled FP2 was incubated with the same nuclear extracts as in Fig. 6 (lanes 1 and 2). Three major complexes are indicated with arrows. In competition experiments, nuclear extracts from control hepatocytes were incubated without competitor (lane 3), with 10- to 50-fold molar excess of FP2 (lanes 4–6), or with mFP2 at 10- to 50-fold molar excess (lanes 7–9). The probe was incubated with nuclear extracts from control hepatocytes in the presence of either no competitor (lane 10) or 10- and 25-fold molar excess of an HNF1 oligonucleotide (lanes 11 and 12) and an HNF5 oligonucleotide (lanes 13 and 14).
FP3 gave three major protein complexes, and similar intensities of these protein complexes were observed with extracts from either control or drug-treated hepatocytes (Fig. 8). The binding of these proteins was efficiently prevented in self-competition experiments with FP3 but not mFP3 (Fig. 8, lanes 4–6 and 7–9).

Gel mobility shift assays of footprinted region C. Radiolabeled FP3 was incubated with the same nuclear extracts as in Fig. 6 (lanes 1 and 2). Three major complexes are indicated with arrows. In competition experiments, nuclear extracts from control hepatocytes were incubated either without competitor (lane 3) or with a 10- to 50-fold molar excess of FP3 (lanes 4–6) and mFP3 (lanes 7–9).
Protein binding to FP4 containing a CCAAT box binding site was very weak; one major protein complex was observed with a similar intensity using control or drug-treated nuclear extracts (Fig.9). Formation of this complex was markedly inhibited in self competition with FP4 (Fig. 9, lane 3) and weakly reduced with an oligonucleotide containing a known C/EBP binding site (Landschulz et al., 1988) (Fig. 9, lane 6), but an oligonucleotide containing an authentic NF1 site (Chodosh et al., 1988) (Fig. 9, lane 5) had little effect.

Gel mobility shift assays of footprinted region D. Radiolabeled FP4 was incubated with the same nuclear extracts as in Fig. 6 (lanes 1 and 2). One major complex is indicated with arrows. In competition experiments, nuclear extracts from control hepatocytes were incubated with a 10-fold molar excess of FP4 (lane 3) or 25-fold molar excess of mFP4 (lane 4), NF1 oligonucleotide (lane 5), and C/EBP oligonucleotide (lane 6).
Gel mobility shift analysis was also used to examine the tissue distribution and relative abundance of the proteins that bound to FP1 to FP4, using nuclear extracts from the liver, kidney, lung, small intestine, and heart of untreated chickens (Fig.10). Proteins binding to footprint regions A and B (FP1 and FP2) are relatively enriched in liver, kidney, and small intestine but not detectable in lung and heart (Fig. 10A). Regions C and D (FP3 and FP4) strongly bound nuclear proteins from liver and only weakly from kidney and small intestine with no binding from the other tissues (Fig. 10B). These studies show that the protein complexes that bind to the enhancer are enriched in those tissues (liver, kidney, and small intestine) that are drug responsive (Hansen et al., 1989). The pattern of protein binding to FP1 to FP4 oligonucleotides by liver and kidney nuclear extracts was very similar to that observed previously with nuclear extracts from chick embryo hepatocytes (Figs. 6-9). However, the protein binding profile for FP1 and FP2 with the small intestine nuclear extracts differed from that of the liver and kidney, reflecting perhaps the presence of tissue-specific isoforms; this requires further investigation.
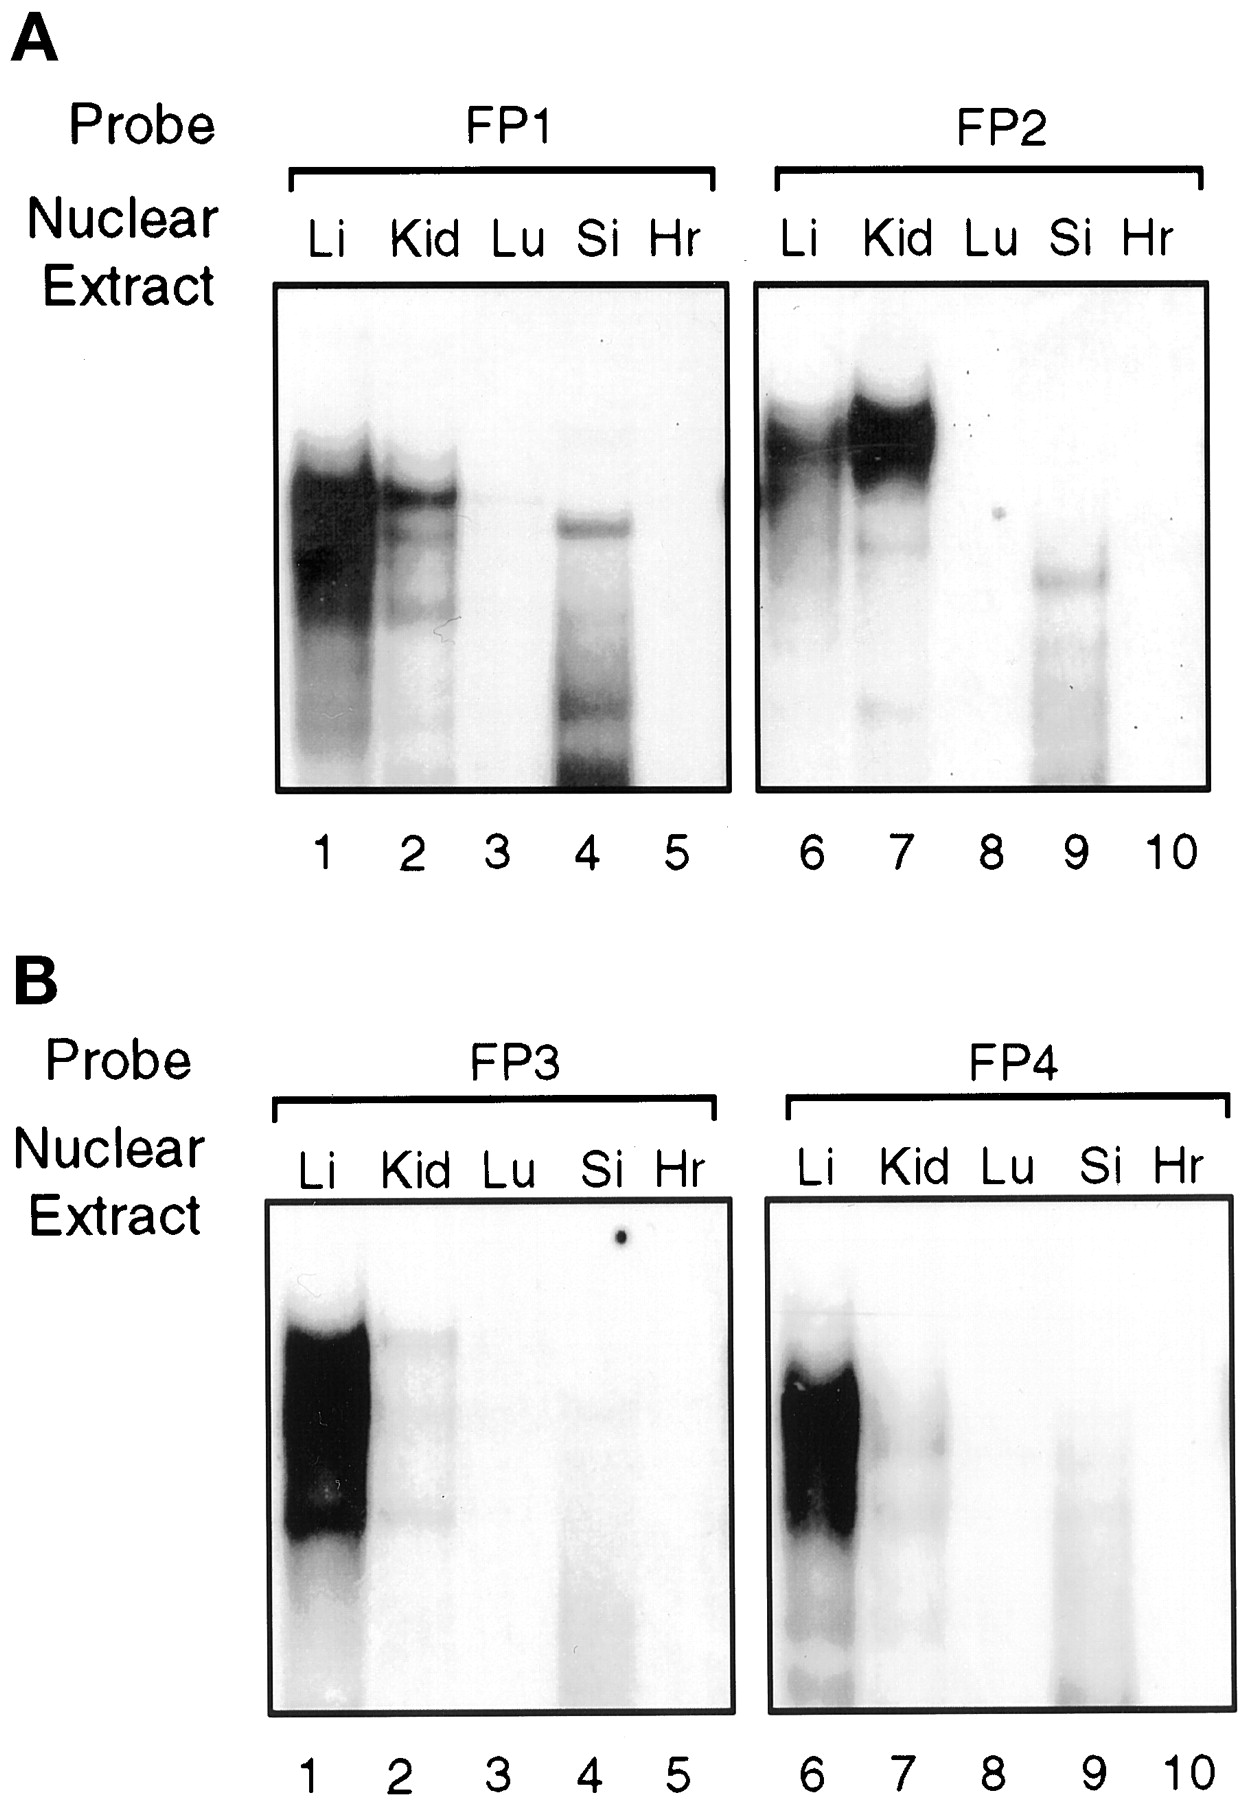
Gel mobility shift assays of footprinted regions A to D with nuclear extracts from various tissues. Nuclear extracts from various untreated chicken tissues were used with radiolabeled probes FP1 to FP4. A, FP1 or FP2 was incubated with nuclear extracts (5–8 μg of protein) from liver (Li), kidney (Kid), lung (Lu), small intestine (Si), and heart (Hr). B, FP3 or FP4 was incubated with nuclear extracts from various chicken tissues as in A.
Discussion
We have characterized a 556-bp enhancer sequence (−1956/−1400) in the chicken CYP2H1 5′ flanking region that responds to phenobarbital in transiently transfected chick embryo hepatocytes. This sequence has been analyzed by dissection into two restriction enzyme fragments; a 240-bp fragment that responds to phenobarbital and a 316-bp fragment that increases the drug response but does not itself respond to drug. Deletion analysis of the 240-bp sequence (performed within the 556-bp enhancer) showed that several regions contributed to drug responsiveness; DNase I protection assays using liver nuclear extracts from phenobarbital-induced chickens identified four protected regions (A-D). Sequence analysis and gel shift assays indicated that footprint region A binds a member of the E-box family of transcription factors, possibly USF or a related protein (Sawadogo and Roeder, 1985). Footprint region B binds members of the HNF1 family (Rey-Campos et al., 1991; Dogra and May, 1997), whereas footprint region D binds a CCAAT box-binding protein that is possibly related to C/EBP but that is not NF1. Sequence within region C did not match any known transcription factor-binding site, and the three major protein complexes that bound to this novel region have yet to be characterized. Site-directed mutagenesis of the protein binding sites in regions A to D and transient expression studies established that inactivation of a single site or two sites together (A and C or B and D) reduced but did not abolish induction by the 556-bp enhancer, whereas mutagenesis of multiple sites (B, C, and D) resulted in almost complete loss of induction. These findings demonstrated that the sites (A-D) are all necessary for maximal induction and that no site alone is critical. In vitro footprint analysis of the 316-bp fragment has revealed binding sites for HNF1 and HNF4 transcription factors. The data therefore shows that more than one element in the 556-bp enhancer is required for drug response; the other elements contribute to the increased level of induction but are not drug responsive.
A promoter-located 17-bp Barbie box sequence has been implicated in the phenobarbital-mediated induction of the bacteria CYP102 andCYP106 genes (He and Fulco, 1991; Shaw and Fulco, 1993) and also in the induction of the rat CYP2B1 gene (Prabhu et al., 1995). However, inactivation of the corresponding site in the promoter of the rat CYP2B2 gene (Trottier et al., 1995; Park et al., 1996; Stoltz et al., 1998) and mouse Cyp2b10 gene (Honkakoski and Negishi, 1997) did not affect drug induction. Moreover, recent evidence suggests that the Barbie box of the bacterialCYP106 gene may not be required for barbiturate-mediated induction (Shaw et al., 1998). In the present work, a Barbie box was not identified in the 556-bp enhancer or the promoter (Dogra and May, 1997) of the CYP2H1 gene. This sequence is also absent from the recently reported upstream phenobarbital-responsive enhancer regions of the mouse Cyp2b10 gene (Honkakoski and Negishi, 1997) and rat CYP2B1/2 genes (Park et al., 1996;Stoltz et al., 1998). Overall, a general role for the Barbie box in the drug induction mechanism in both eukaryotes and prokaryotes seems unlikely.
The phenobarbital enhancer region for the Cyp2b10 gene (Honkakoski and Negishi, 1997) and CYP2B1/2 genes (Park et al., 1996; Kim and Kemper, 1997; Stoltz et al., 1998;) is located upstream at approximately −2 kb. Multiple sites that contribute to phenobarbital responsiveness have been identified by in vitro footprint analysis and mutagenesis within the mouse 132-bp enhancer and the corresponding rat enhancer region and include a putative glucocorticoid-responsive element and an NF1 site (Honkakoski and Negishi, 1997; Stoltz et al., 1998). There is evidence (Stolz et al., 1998) that phenobarbital responsiveness of the CYP2B2enhancer is directed by interactions between multiple proteins on the enhancer; as mentioned, a similar finding has been made in the present study with the chicken CYP2H1 enhancer. A recent report has defined a 51-bp element in the mouse 132-bp enhancer that independently responds to phenobarbital and other phenobarbital-type inducers; this element contains the NF1 site and is flanked by apparent novel nuclear receptor binding sites composed of direct half sites with a spacing of 4 bp (Honkakoski et al., 1998).
An important finding here is that the proteins that bind to the chicken 556-bp enhancer seem to have no counterparts on the rodent enhancers. A sequence comparison of this region with the rodent enhancer sequences did not reveal any common protein-binding sites, in particular a glucocorticoidresponse element or novel nuclear receptor site. As mentioned, there is a functional CCAAT box element, but this site binds a protein complex that is possibly related to C/EBP rather than the ubiquitously expressed NF1. The C/EBP related complex is particularly enriched in nuclear extracts from chicken liver (and to a lesser extent kidney and small intestine), tissue which is highly responsive to phenobarbital (Hansen et al., 1989), but is absent from extracts of the nonresponsive lung and heart tissues. The other three footprinted regions in the 240-bp fragment also bound proteins enriched in the liver, kidney, and small intestine. As mentioned earlier, the adjacent 316-bp fragment contains sites for the liver-enriched transcription factors HNF1 and HNF4. Hence, tissue-restricted expression of the CYP2H1 gene (Hansen et al., 1989) is likely to be directed by transcription factors that bind to the 556-bp enhancer in addition to the early promoter, which has functional sites for HNF1, HNF3, C/EBP, and USF (Dogra and May, 1997).
In contrast to the enhancer regions of the rat CYP2B1/2(Park et al., 1996; Kim and Kemper, 1997) and mouse CYP2b10(Honkakoski and Negishi, 1997) genes, in vitro footprint analysis of the chicken 240-bp fragment revealed an increase in the binding of nuclear proteins from drug-treated livers. This binding was probably not due to an increase in the amount of these nuclear proteins in response to phenobarbital, because in the gel mobility shift studies, an increase in binding with drug-treated nuclear extracts was not observed. In control experiments, the same nuclear extracts that revealed increased binding on the 240-bp fragment did not show this with the 316-bp fragment, eliminating the possibility that this is a general effect (data not shown). The footprint data suggest that drug action leads to increased binding on the 240-bp fragment through a cooperative interaction between proteins. In keeping with this proposal, footprint analysis using competitor oligonucleotides corresponding to footprint regions A to D showed that depletion of one binding protein could result in a weaker footprint on the other regions. Currently under investigation is the possibility that, in the presence of drug, one or more proteins are modified [for example by a phosphorylation event (Dogra and May, 1996], and that this results in increased binding to the enhancer in a cooperative fashion.
In summary, we have identified and analyzed a drug-responsive, 556-bp enhancer region in the CYP2H1 gene. Maximum drug responsiveness is dependent upon binding of multiple proteins. Further analysis is required to identify precisely the proteins that bind, the way in which they interact and cooperate, and whether drug action leads to the modification of any of these proteins. In this regard, our analysis of various upstream restriction enzyme fragments located in the 4.8-kb enhancer domain of the CYP2H1 gene has revealed that, in addition to the 556-bp sequence, there is a second separate region that responds to drug to about the same extent as the 556-bp sequence. It will be interesting to identify the transcription factors that bind to this region. If it is proved that the transcriptional factors that activate the chicken and rodent phenobarbital-responsive enhancers are different, this would imply that either the induction mechanisms are fundamentally different or that there is an as yet undetermined common site of phenobarbital action that leads to the modification and activation of multiple transcription factors. Whether phenobarbital and the other phenobarbital-type inducers primarily mediate such action through direct binding to a specific receptor protein remains a key issue.
Footnotes
- Received June 8, 1998.
- Accepted October 1, 1998.
-
Send reprint requests to: Dr. Brian K. May, Department of Biochemistry, University of Adelaide, Adelaide, South Australia, Australia 5005. E-mail: bmay{at}biochem.adelaide.edu.au
Abbreviations
- P450
- cytochrome P-450
- bp
- base pair
- kb
- kilobase
- CAT
- chloramphenicol acetyltransferase
- SV
- simian virus 40
- C/EBP
- CCAAT/enhancer binding protein
- HNF
- hepatocyte nuclear factor
- USF
- upstream stimulatory factor
- NF1
- nuclear factor 1
- PBS
- phosphate-buffered saline
- The American Society for Pharmacology and Experimental Therapeutics


