


Abstract
This work compares the pharmacological and biochemical properties of A3 adenosine receptors in human polymorphonuclear neutrophil granulocytes (PMNs) and promyelocytic HL60 cells. The gene expression of A3 receptors was examined by reverse transcription-polymerase chain reaction experiments, whereas the amount of A3 subtype on the plasma membrane was quantified by using the high-affinity and selective A3 antagonist [3H]5N-(4-methoxyphenyl-carbamoyl)amino-8-propyl-2-(2-furyl)pyrazolo-[4,3-e]1,2,4-triazolo[1,5-c]pyrimidine ([3H]MRE 3008F20). Saturation experiments reveal a single high-affinity binding site with K Dvalues of 2.3 ± 0.3, 2.6 ± 0.4 nM, andB max values of 430 ± 35, 345 ± 31 fmol/mg of protein for PMNs and HL60 cells, respectively. Competition of radioligand binding by adenosine ligands displays a rank order of potency typical of the A3 subtype. EC50 values ofN 6-(3-iodo-benzyl)-2-chloro-adenosine-5′-N-methyluronamide (Cl-IB-MECA) for inhibition of cAMP levels via A3 receptors are in good agreement with the binding data; furthermore, the response is potently inhibited by MRE 3008F20. In contrast, the high micromolar concentrations of Cl-IB-MECA and MRE 3008F20 in stimulating and blocking Ca2+ mobilization, respectively, are not completely consistent with the involvement of an A3receptor. Furthermore, an important finding of this work is that the inhibition of PMNs oxidative burst is predominantly A2A-mediated, even though an effect of A3subtype could not be excluded. This conclusion is based on potent blockade of Cl-IB-MECA-mediated inhibition of oxidative burst by SCH 58261 and a minor but significant blockade by MRE 3008F20. In conclusion, HL60 cells express A3 receptors similar to those in PMNs, thus providing a useful model for investigation of biochemical pathways leading to A3 receptor activation.
Neutrophils play major roles in host defense against the invasion of microorganisms and in acute inflammation and have been implicated in the pathogenesis of a number of human diseases. Adenosine, which has been identified as an important regulator of neutrophil function, particularly with regard to neutrophil superoxide production and neutrophil adherence, may therefore be protective against neutrophil-mediated tissue injury (Firestein et al., 1995; Cronstein, 1997). So far, four adenosine receptors have been classified (A1, A2A, A2B, and A3), all of which are coupled to G proteins (Fredholm et al., 2000; Linden, 2001). Human neutrophils contain both A2A and A1 subtypes, which produce opposite effects on several cell functions (Fredholm et al., 1996): activation of A1 by adenosine at low concentrations is associated with augmentation of chemotaxis and phagocytosis (Sullivan and Linden, 1998), whereas occupation of A2A by adenosine at the higher concentrations inhibits superoxide anion production and neutrophil adherence to endothelium (Cronstein et al., 1992). Until recently, most of the anti-inflammatory actions of adenosine were thought to be produced through A2A receptors. However, the involvement of another member of the adenosine receptor family, the A3 subtype, is now being considered for its adenosine-mediated anti-inflammatory effects. From the early 1990s, when the A3 receptor was first cloned from several animal species including man (Zhou et al., 1992; Linden et al., 1993; Salvatore et al., 1993; Auchampach et al., 1997), its stimulation has been shown to mediate adenylyl cyclase inhibition (Zhou et al., 1992; Olah and Stiles, 1995) and phospholipase C activation (Ramkumar et al., 1993; Abbracchio et al., 1995). A3receptors exert their anti-inflammatory properties by inhibiting specific cell functions in different systems [e.g., tumor necrosis factor-α release in human macrophages and monocytes (Sajjadi et al., 1996), degranulation, chemotaxis, superoxide anion production in human eosinophils (Ezeamuzie and Philips, 1999), andN-formyl-l-methionyl-l-leucyl-l-phenylalanine (fMLP)-triggered respiratory burst in human monocytes (Broussas et al., 1999)]. Moreover, evidence of the expression of A3 receptors has also been reported in the promyelocytic HL60 human leukemia line (Kohno et al., 1996b) and in human neutrophils, where they inhibit degranulation (Bouma et al., 1997). However, although the pharmacological, biochemical, and functional properties of adenosine on neutrophil A1 and A2A receptors are well documented (Sullivan and Linden, 1998; Gessi et al., 1999), those related to the A3 subtype are less known.
Therefore, the aim was to investigate the presence of A3 receptors in human polymorphonuclear neutrophil granulocytes (PMNs), by using the high-affinity tritiated antagonist [3H]5N-(4-methoxyphenylcarbamoyl)amino-8-propyl-2-(2-furyl)-pyrazolo[4,3-e]1,2,4-triazolo [1,5-c]-pyrimidine ([3H]MRE 3008F20) (Varani et al., 2000). Additionally, we compared the binding properties of this A3 receptor in PMNs with those present in HL60 cells, which have been used extensively as in vitro models for neutrophil functions, and have been proven to be an exceptionally useful system for the analysis of various aspects of the regulation of G-proteins and effector systems in general (Klinker et al., 1996). To determine the functional coupling of A3 receptors with signal transduction mechanisms in PMNs and HL60 cells, the effect of high affinity and selective A3 agonists such as Cl-IB-MECA and IB-MECA in the inhibition of adenylyl cyclase activity and in the induction of Ca2+ release have been evaluated. Finally, to investigate a potential role of the A3 subtype in the inhibition of neutrophils superoxide anion production, which is a well-known A2A-mediated mechanism (Varani et al., 1998; Sullivan et al., 2001), the effect of A3receptors activation was also evaluated. Because human neutrophils express all adenosine subtypes, to identify how adenosine receptors are involved in each functional response, selective antagonists were also used (affinity binding data to human adenosine receptor subtypes are reported in Table 1).
Antagonist affinities, expressed as Ki values, in receptor binding to human adenosine receptors
Experimental Procedures
Materials.
[3H]MRE 3008F20 (specific activity, 67 Ci/mmol) was obtained from Amersham Biosciences (Little Chalfont, Buckinghamshire, UK). NECA, HE-NECA, (R)-PIA, (S)-PIA, Cl-IB-MECA, IB-MECA, CGS 15943, and DPCPX were obtained from Sigma/RBI (Natick, MA). SCH 58261, MRE 3055F20, MRE 3008F20, MRE 3062F20, MRE 3048F20, and MRE 3046F20 were synthesized by Prof. P. G. Baraldi. Fura-2 acetoxymethyl ester (Fura-2/AM) was obtained from Inalco SpA (Milano, Italy). Dextran and Ficoll-Hypaque were purchased from Pharmacia (Uppsala, Sweden). fMLP, ferricytochrome c, cytochalasin B and U73122 were from Sigma Chemicals Co. (St. Louis, MO). All other reagents were of analytical grade and obtained from commercial sources. HL60 cells were kindly provided by Prof. G. Zauli (University of Chieti, Italy).
Cell Culture Conditions.
HL60 cells were grown in RPMI-1640 medium supplemented with l-glutamine (2 mM), penicillin (100 U/ml), streptomycin (100 μg/ml), and 10% fetal calf serum, at 37°C in humidified air with 5% carbon dioxide.
PMNs Isolation.
PMNs were isolated from buffy coats kindly provided by the Blood Bank of the University Hospital of Ferrara. Blood was donated by healthy volunteers after informed consent for research was obtained. PMNs were isolated according to the methods reported inVarani et al. (1998). In short, blood was supplemented with 20 ml of a solution consisting of 6% Dextran T500. After gentle mixing, erythrocytes were allowed to settle at 20°C for 60 min. The turbid upper layer containing leukocytes was carefully removed and centrifuged at 20°C for 12 min at 100 g. Remaining erythrocytes were lysed by suspending the cell pellet in 10 ml of distilled water at 4°C under gentle agitation. After 30 s, isotonicity was restored by adding 3 ml of a solution containing 0.6 M NaCl. Cells were pelleted by centrifugation at 20°C for 5 min at 250 g, suspended in 10 ml of Krebs-Ringer phosphate buffer (KRPG) consisting of 136 mM NaCl, 5 mM KCl, 0.67 mM Na2HPO4, 0.2 mM KH2PO4, 3 mM NaHCO3, 1 mM CaCl2, 5 mM glucose, 5 mM HEPES, 10 mM MgCl2, pH 7.45, and layered onto 10 ml of Ficoll-Hypaque. PMNs were sedimented by centrifugation at 20°C for 20 min at 250 g. This procedure resulted in approximately 95% PMNs and the cell viability was more than 95% as detected by trypan blue exclusion test. This cell suspension was used for measurement of cyclic AMP levels, intracellular calcium levels, and superoxide anion production.
Membrane Preparation.
Membranes were obtained with minor modifications as described elsewhere (Varani et al., 1998). Briefly, PMNs and HL60 cells were homogenized in ice-cold hypotonic buffer (5 mM Tris HCl, 2 mM EDTA, pH 7.4) with a Polytron homogenizer (Kinematica, Basel, Switzerland). After 30 min on ice, the homogenate was spun for 20 min at 11,000g. The pellet was then recentrifuged for 20 min at 11,000g, and was resuspended in 50 mM Tris HCl buffer, pH 7.4 (50 mM Tris HCl, 10 mM MgCl2, 1 mM EDTA) and incubated with 3 IU/ml of adenosine deaminase for 30 min at 37°C. Then the suspension was frozen at −80°C.
RT-PCR.
Total cytoplasmic RNA was extracted from PMNs and HL60 cells by the acid guanidinium thiocyanate phenol method (Chomczynski and Sacchi, 1987). The human A3adenosine receptor sequence was amplified with 5′ primer sequence (ACG GTG AGG TAC CAC AGC TTG TG) and 3′ primer sequence (ATA CCG CGG GAT GGC AGA CC), giving a 156-bp product (Gessi et al., 2001). RT-PCR was carried out by using Access RT-PCR System (Promega, Madison, WI), in 50 μl under the following conditions: first-strand cDNA synthesis at 48°C for 45 min and 94°C for 2 min. Second-strand cDNA synthesis and PCR amplification at 94°C for 30 s, 59.5°C for 30 s, and 68°C for 2 min (35 cycles). Sequence primers for β-actin were: 5′ TGG GAA TGG GTC AGA AGG ACT; 3′ TTT CAC GGT TGG CCT TAG GGT. Oligonucleotides were synthesized by M-Medical Genenco-Life Science (Florence, Italy). Subsequently, 10 μl of PCR products were run on the 2% agarose gel and examined by ethidium bromide staining. To verify that the presence of a specific band was not caused by contamination of the RNA preparation with DNA, samples without reverse transcriptase were included.
[3H]MRE 3008F20 Binding Assay.
Binding assays were carried out according to the method of Varani et al. (2000). In saturation experiments, 100 μl of membrane homogenate (60 μg of protein/assay) were incubated in duplicate with 10 to 12 different concentrations of [3H]MRE 3008F20 in the range 0.2 to 20 nM. In competition experiments, 2 nM [3H]MRE 3008F20 was incubated in duplicate with at least 12 to 14 different concentrations of each of the agonists or antagonists examined. Incubation time was 120 min at 4°C to allow equilibrium to be reached. Analogous experiments were performed in the presence of 100 μM GTP. Nonspecific binding, defined as binding in the presence of 1 μM MRE 3008F20, at theK D value of the radioligand was ≈ 30% of total binding. Bound and free radioactivity were separated by filtering the assay mixture through Whatman GF/B glass-fiber filters using a Micro-Mate 196 cell harvester (Packard Instrument Company, Downers Grove, IL). The filter bound radioactivity was counted on a Top Count Microplate Scintillation Counter (efficiency 57%) with Micro-Scint 20. The protein concentration was determined according to a Bio-Rad (Hercules, CA) method (Bradford, 1976) with bovine albumin as a standard reference.
Measurement of Cytosolic Ca2+ Concentration.
Changes in [Ca2+]i were measured with the fluorescent indicator Fura-2/AM, according to Gessi et al. (2001). Briefly, PMNs or HL60 cells were loaded with 1 μM Fura-2/AM in KRPG buffer for 30 min at 37°C, in the presence of 250 μM sulfinpyrazone that inhibits dye leakage by blocking organic-anion transport system (Di Virgilio et al., 1988). Cells were then centrifuged at 1000 g for 10 min to remove the extracellular dye and resuspended in KRPG buffer, at 4 × 10⁶cells/ml, in the presence or absence of 1 mM CaCl2. EGTA (0.5 mM) was added in the incubations in which CaCl2 was absent. Ca2+ traces were obtained by using an LS50 (Perkin-Elmer, Norwalk, CT) spectrofluorometer, at an excitation wavelength of 340 and 380 nm and emission wavelength of 505 nm. Measurements were performed in thermostatically controlled (37°C) and continuously stirred cuvettes. After a stable baseline had been established, A3 agonists were added and emitted light recorded.
Measurement of Cyclic AMP Levels.
PMNs and HL60 cells (5 × 10⁶ cells/assay) were suspended in 0.5 ml of KRPG buffer containing 0.5 mM 4-(3-butoxy-4-methoxybenzyl)-2-imidazolidinone (Ro 20–1724, phosphodiesterase inhibitor) and 2.0 IU/ml adenosine deaminase and preincubated for 10 min in a shaking bath at 37°C. Then typical A3 adenosine agonists plus 10 μM forskolin were added to the mixture and incubated for a further 5 min. The IC50 for MRE 3008F20 on the inhibition of 100 nM Cl-IB-MECA-induced reduction of cyclic AMP levels was determined. In addition, the effect of MRE 3008F20 on the 10 nM HE-NECA–mediated stimulation of cAMP levels was also studied in PMNs. The reaction was terminated by the addition of cold 6% trichloroacetic acid. The trichloroacetic acid suspension was centrifuged at 2000g for 10 min at 4°C and the supernatant was extracted four times with water-saturated diethyl ether. The final aqueous solution was tested for cyclic AMP levels by a competition protein binding assay carried out according to Varani et al. (1998). Samples of cyclic AMP standards (0–10 pmol) were added to each test tube containing 0.1 M Trizma base, 8.0 mM aminophylline, 6.0 mM 2-mercaptoethanol, pH 7.4, and [3H]cyclic AMP in a total volume of 0.5 ml. The binding protein, previously prepared from bovine adrenal glands, was added to the samples and incubated at 4°C for 150 min. After the addition of charcoal, samples were centrifuged at 2000g for 10 min and the clear supernatant (0.2 ml) was mixed with 4 ml of Atomlight (Packard BioScience, Meriden, CT) and counted in a LS-1800 scintillation counter (Beckman Coulter, Fullerton, CA).
Superoxide Anion Production.
O2 ·̄ release was monitored continuously with a temperature-controlled spectrophotometer by the reduction of ferricytochrome c inhibited by superoxide dismutase, as described previously (Spisani et al., 1992). The mixture was incubated with either control or different concentrations of agonists for 5 min at 37°C. At 0 time, 0.1 μM fMLP was added and the amount of O2 − produced was calculated by the differences in absorbance of the samples, with a 15.5 mM extinction coefficient at 550 nm for cytochrome c reduction. The net nanomole of O2 − release were calculated from the formula: nanomole released by stimulated PMNs minus nanomole released by resting PMNs alone. PMNs were incubated with 5 μg/ml cytochalasin B for 5 min before peptide activation.
Thermodynamic Analysis.
For a generic binding equilibrium L + r = LR (L = ligand, r = receptor), the affinity association constantK A = 1/K D is directly related to the standard free energy ΔG° [ΔG° = −RT lnK A (where R is the gas constant and T is temperature in °K)], which can be separated in its enthalpic and entropic contributions according to the Gibbs equation: ΔG° = ΔH° − TΔS°. The standard free energy was calculated as ΔG° = −RTlnKA at 298.15°K, the standard enthalpy, ΔH°, from the van't Hoff plot lnK A versus (1/T) (the slope of which is −ΔH°/R) and the standard entropy as ΔS° = (ΔH° − ΔG°)/T with T = 298.15°K and r = 8.314 J °K−1mol−1.K A values were obtained from saturation experiments of [3H]MRE 3008F20 binding to the A3 adenosine receptors in PMNs and HL60 cells performed at 4, 10, 15, 20, 25, and 30°C.
Data Analysis.
All binding studies (kinetics, saturation, and competition) were analyzed with the program LIGAND (Munson and Rodbard, 1980). EC50 and IC50 values in the cyclic AMP and Ca2+ assays were calculated with the nonlinear least-squares curve-fitting program Prism (GraphPAD, San Diego, CA).
Results
A3 Receptor Gene Expression.
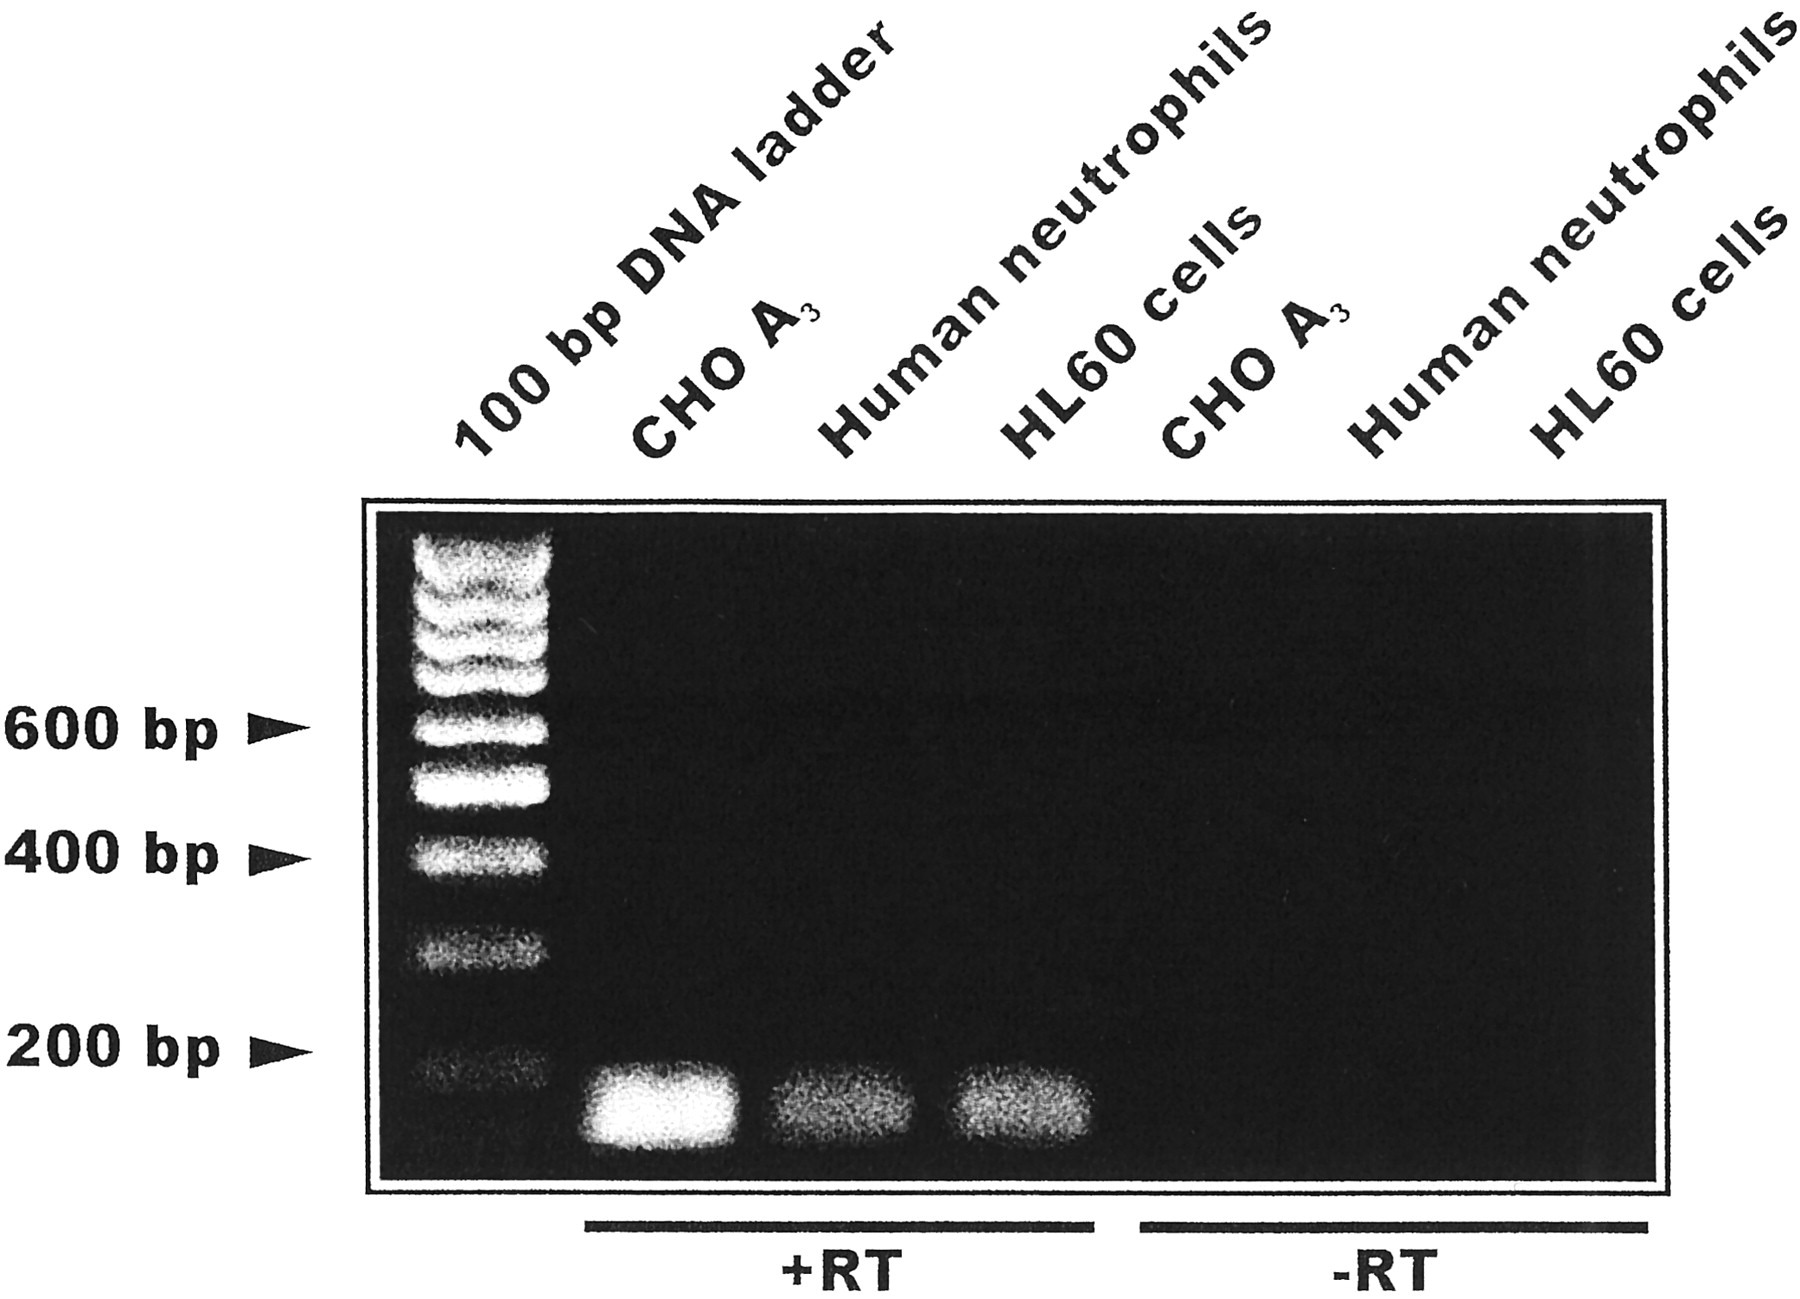
Expression of the A3 adenosine receptors in PMNs and HL60 cells was shown by RT-PCR. Figure 1 shows the A3 amplification product from PMNs and HL60 cells (lanes 2 and 3, respectively) compared with that of stable CHO cells transfected with human A3 receptors (hA3) (positive control, lane 1); no differences in β-actin mRNA levels were found between these samples (data not shown).

Expression of the A3 transcript in human neutrophils, in promyelocytic HL60 cells and in CHO cells transfected with hA3 receptors (positive control). Total RNA was extracted as described under Experimental Procedures and used for RT-PCR. Ten microliters of PCR product was loaded in each lane. Lane 1, hA3 CHO cells; lane 2, human neutrophils, lane 3, HL60 cells; lanes 4 to 6, samples without reverse transcriptase (−RT).
Binding Studies.
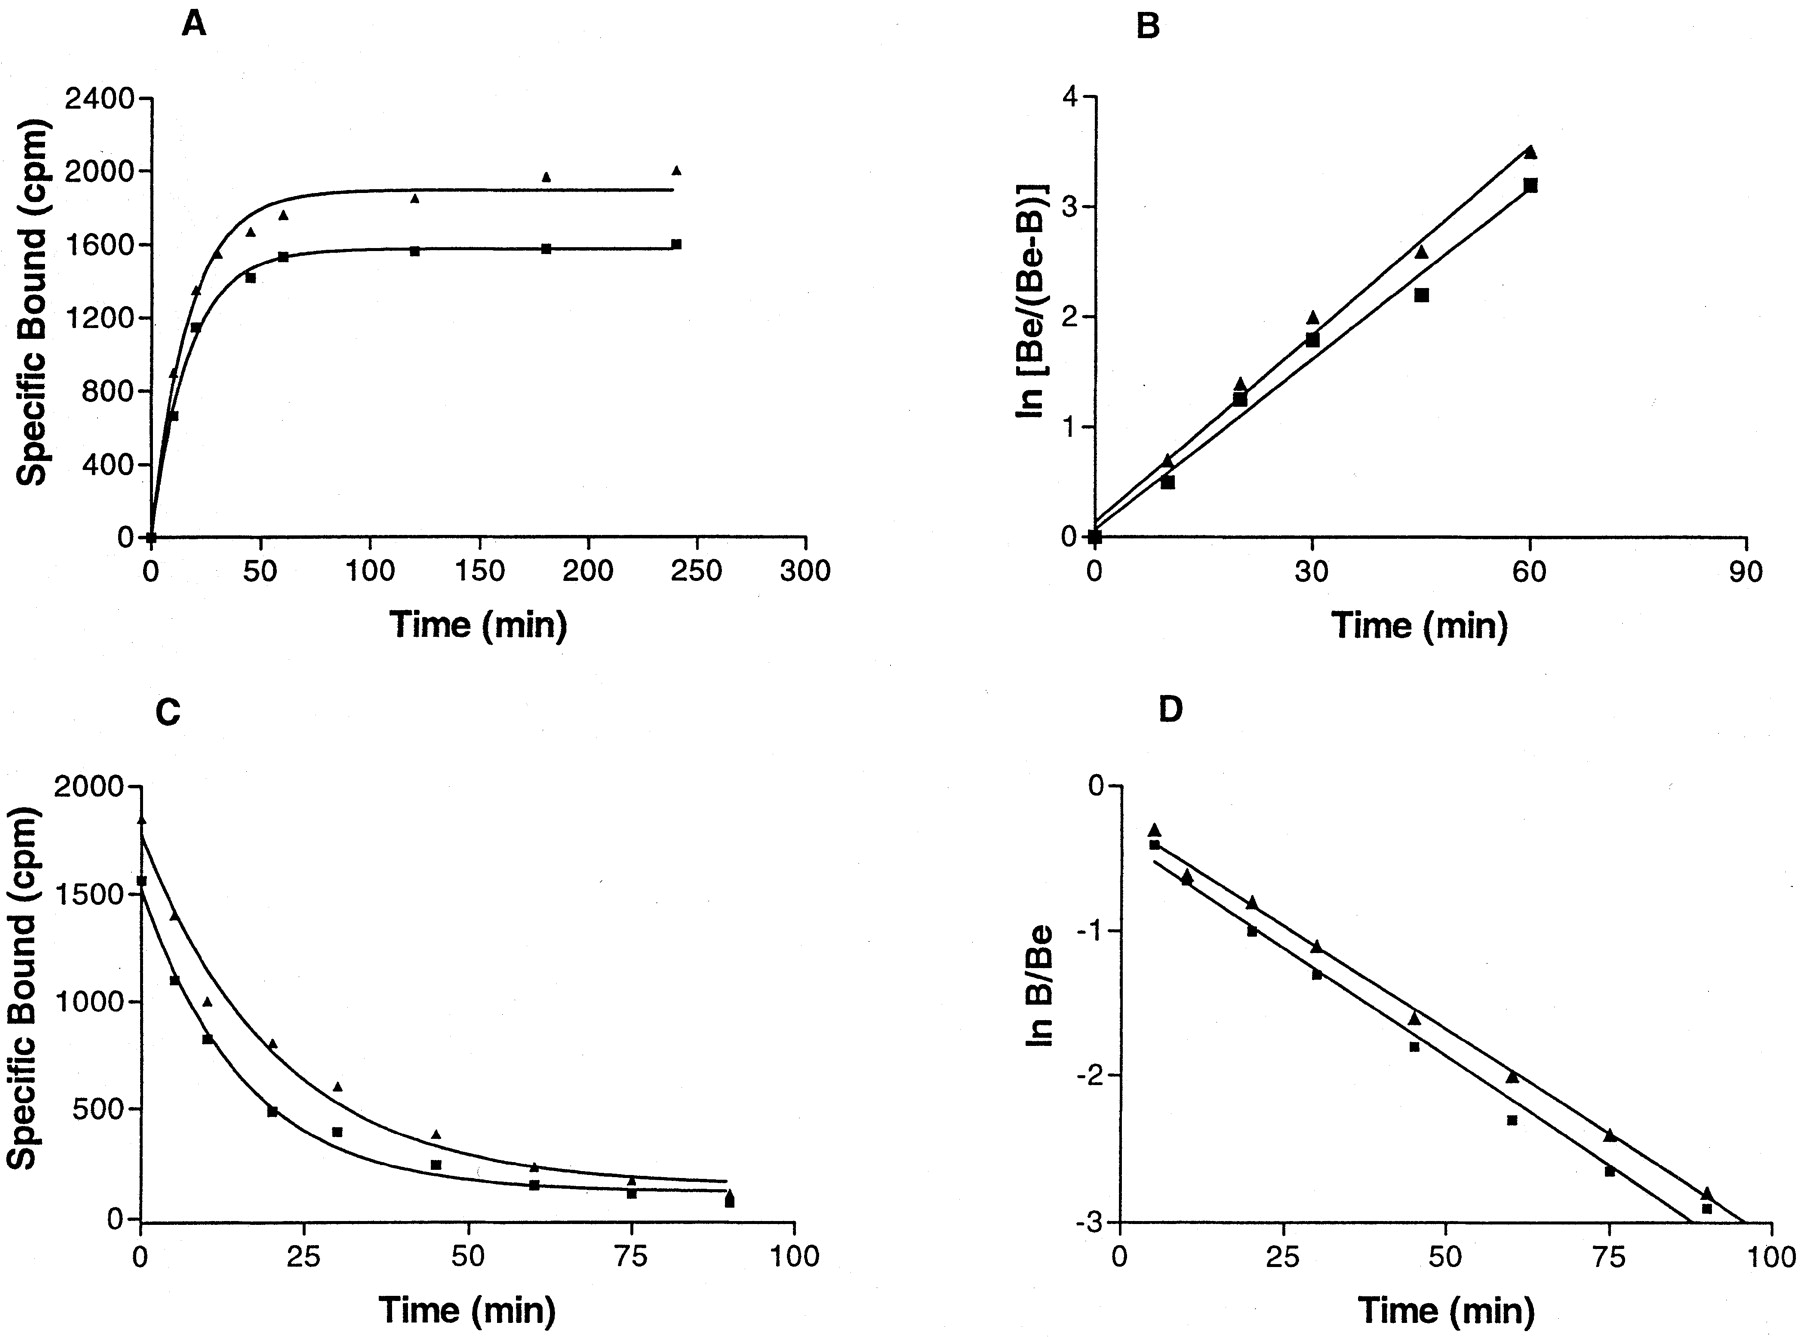
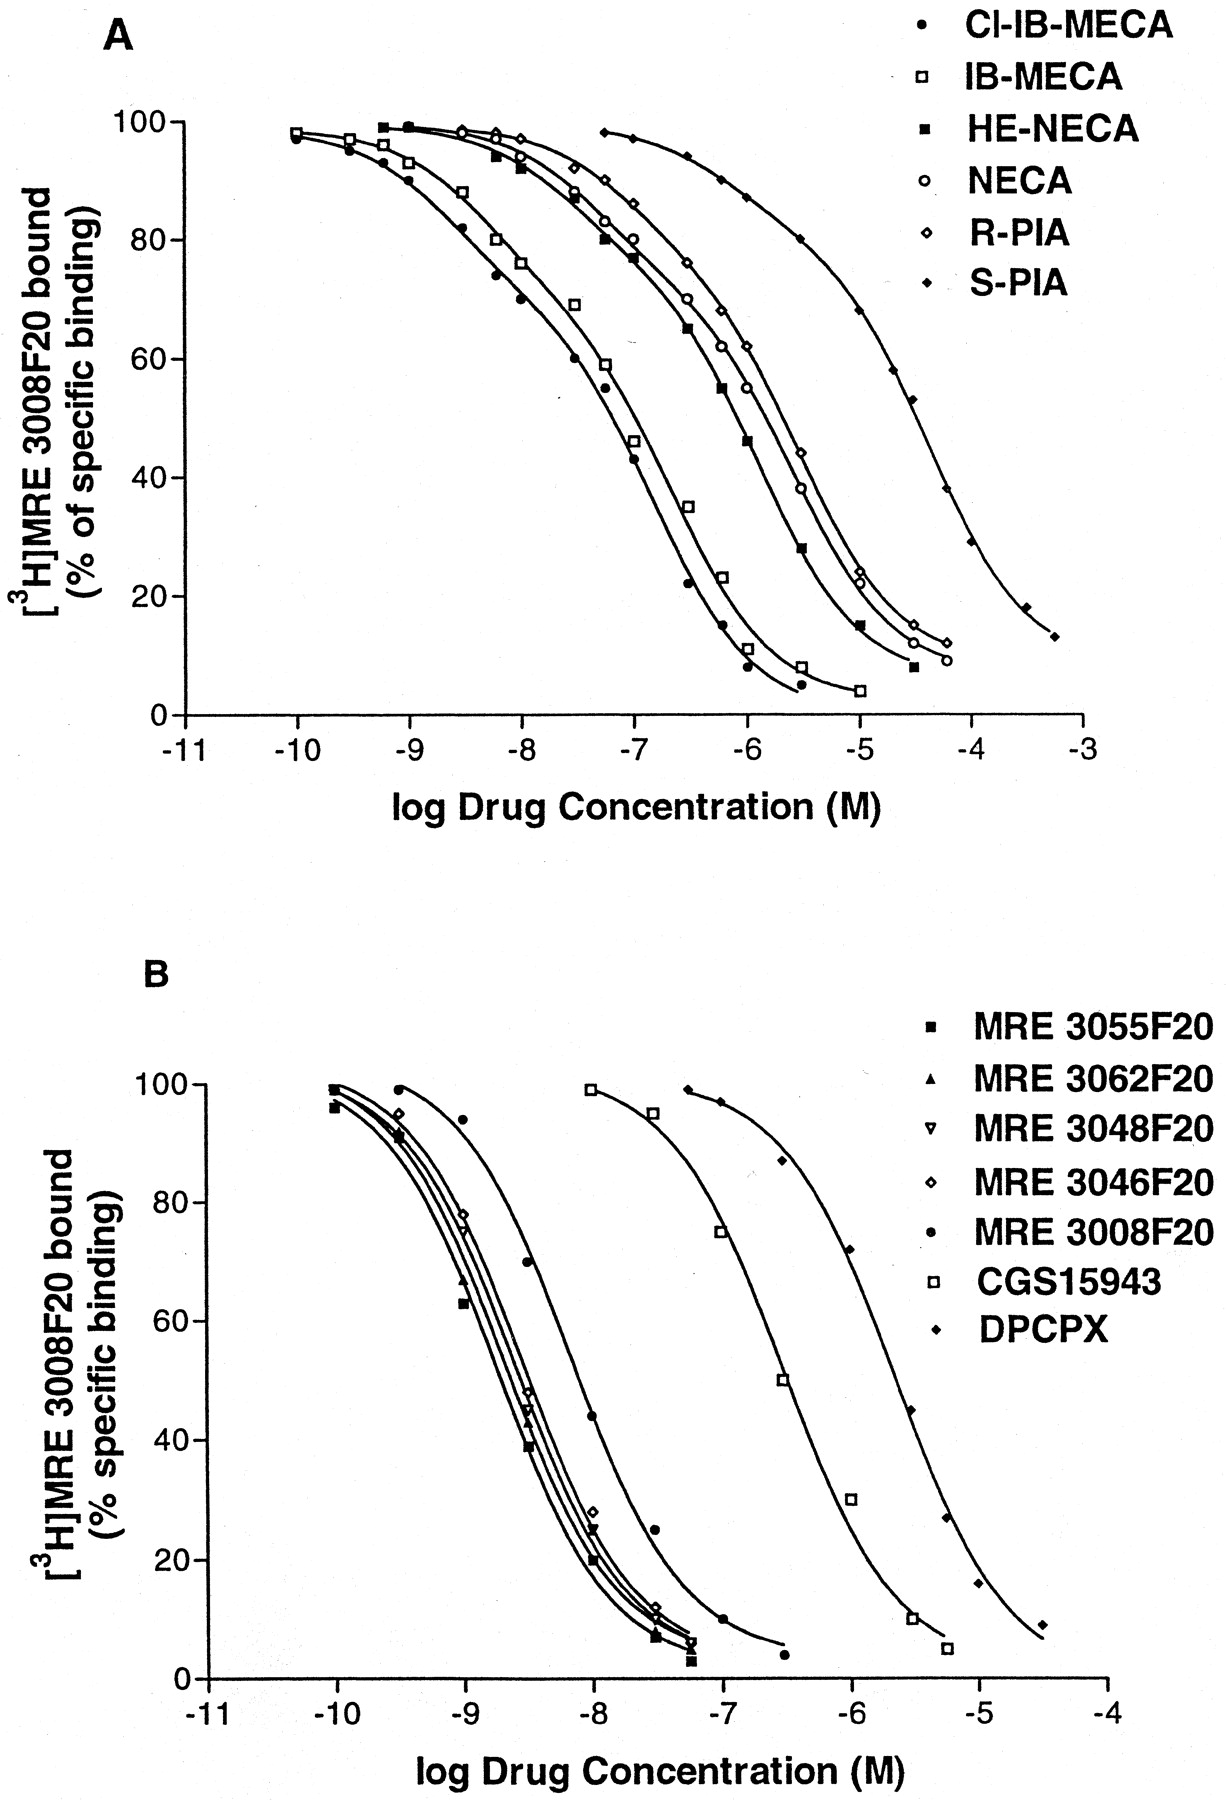
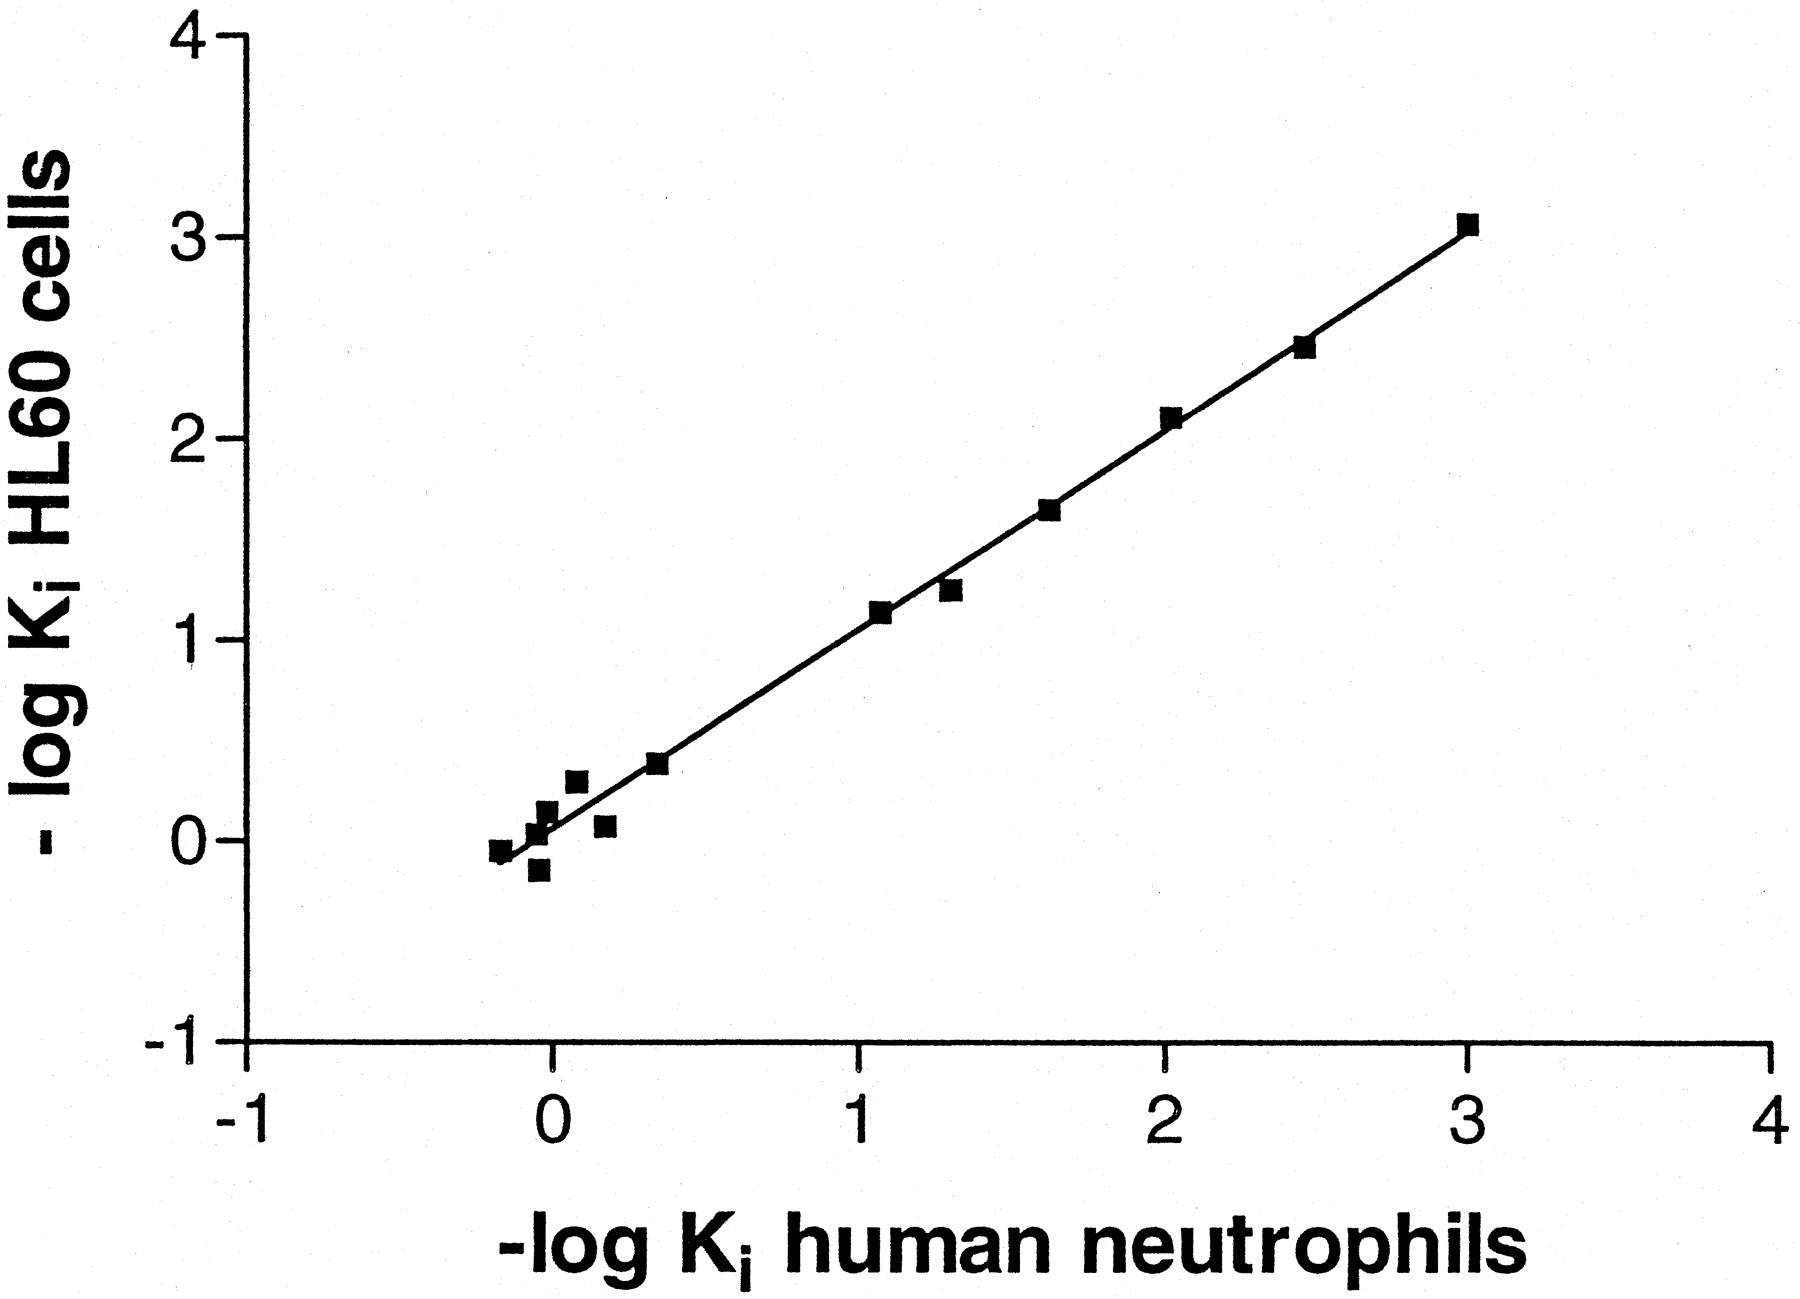
Kinetic studies showed that at 4°C [3H]MRE 3008F20 binding reached equilibrium within 90 min and remained constant for the following 5 h (Fig.2A). Association and dissociation curves fitted the one-component model significantly better than a two-component model (P < 0.05) (Fig. 2, B and D). Calculations of the kinetic data gave an observed association constant (K obs) of 0.057 ± 0.003 and 0.052 ± 0.004 min−1 with a corresponding association rate constant (k +1) of 0.014 and 0.011 min−1nM−1 in PMNs and HL60 cells, respectively. [3H]MRE 3008F20 binding was rapidly reversed by the addition of 1 μM MRE 3008F20 (Fig. 2C), giving a dissociation rate constant (k −1) of 0.029 ± 0.001 and 0.030 ± 0.001 min−1. From the rates of association and dissociation, the equilibrium constantK D=k −1 /k +1 was estimated to be 2.10 and 2.73 nM in PMNs and HL60 cells, respectively. The specific binding of [3H]MRE 3008F20 to both cell systems investigated was saturable, whereas nonspecific binding increased linearly with increasing ligand concentrations. The linearity of the Scatchard plots failed to significantly show a better fit to a two-site than to a one-site binding model, indicating that only one class of high-affinity binding sites is present under our experimental conditions (Munson and Rodbard, 1980). TheK D values were calculated to be 2.3 ± 0.3 and 2.6 ± 0.4 nM and theB max values were 430 ± 35 and 345 ± 31 fmol/mg of protein in PMNs and HL60 cells, respectively (Fig. 3, A and B). Adenosine agonists were found to inhibit [3H]MRE 3008F20 binding in a manner consistent with the labeling of the A3 adenosine receptor in PMNs and HL60 cells, as summarized in Tables 2 and3, respectively. The agonists order of potency in [3H]MRE 3008F20 binding experiments was: Cl-IB-MECA > IB-MECA > HE-NECA > NECA > (R)-PIA > (S)-PIA and found to be similar in both PMNs and HL60 cells. Competition of [3H]MRE 3008F20 binding was stereoselective; (R)-PIA was approximately six to seven times more active (K H = 42, 45 nM andK L = 2600, 2450 nM in PMNs and HL60 cells, respectively) than its stereoisomer, (S)-PIA (K H = 286, 295 nM andK L = 22000, 23500 nM in PMNs and HL60 cells, respectively). For all agonist used, the competition curves exhibited Hill coefficients less than unity (ranging from 0.52 to 0.64) and were best described by the existence of one high-affinity (K H) and one low-affinity (K L) agonist-receptor binding state (Fig. 4A). Coupling of the A3 receptors to G proteins was investigated in the presence of GTP. In both cell types, the addition of 100 μM GTP shifted the competition binding curves of the agonists from a biphasic to a monophasic shape (Ligand software; p < 0.01), with a K i value near the low-affinity sites, as shown in Tables 2 and 3. In [3H]MRE 3008F20 displacement studies, the antagonists rank order of potency, identical in both PMNs and HL60 cells, was as follows: MRE 3055F20 > MRE 3062F20 > MRE 3048F20 > MRE 3046F20 > MRE 3008F20 > CGS 15943 > DPCPX > SCH 58261 (Fig. 4B). The addition of GTP did not change the shape of the competition curves of antagonists that exhibited Hill slopes near unity (Tables 2 and 3). The Spearman's rank correlation coefficient between affinity values of [3H]MRE 3008F20 binding in PMNs and HL60 cells by the agonists and antagonists examined was 0.97 (P < 0.01) and the linear correlation coefficient of the same data was 0.99 (P < 0.01) (Fig. 5). Saturation experiments of [3H]MRE 3008F20 binding, performed at the six selected temperatures, revealedK D values in the ranges 2.2 to 4.5 and 2.6 to 5.0 nM and B max values in the ranges 410 to 430 and 340 to 360 fmol/mg of protein, suggesting that dissociation constants changed with temperature in a very similar way in both PMNs and HL60 cells, whereasB max data were largely independent. Figure 6 shows the van't Hoff plots lnK A versus 1/T of the [3H]MRE 3008F20 binding to the A3 adenosine receptors and the final equilibrium thermodynamic parameters (expressed as mean values ± S.E. of four independent determinations) were: ΔG° = −47.74 ± 0.13, −47.43 ± 0.16 kJ mol−1; ΔH° = −18.53 ± 1.15, −17.71 ± 1.65 kJ mol−1; ΔS° = 98.07 ± 9.25, 99.73 ± 9.05 J °K−1mol−1 in PMNs and HL60 cells, respectively.

A, kinetics of [3 H]MRE 3008F20 binding to human A3 adenosine receptors with association curves representative of a single experiment which was replicated three times with similar results, in human neutrophils (▴) and HL60 cells (▪). B, First-order plots of [3 H]MRE 3008F20 binding. Be, amount of [3 H]MRE 3008F20 bound at equilibrium; B, amount of [3 H]MRE 3008F20 bound at each time. Association rate constants were: k +1 = 0.014 ± 0.002 and 0.011 ± 0.001 min−1nM−1 in human neutrophils (▴) and HL60 cells (▪), respectively. C, kinetics of [3 H]MRE 3008F20 binding to human A3 adenosine receptors with dissociation curves representative of a single experiment. D, first-order plots of [3 H]MRE 3008F20 binding. Dissociation rate constants were: k −1 = 0.029 ± 0.001 and 0.030 ± 0.001 min−1 in human neutrophils (▴) and HL60 cells (▪), respectively.

Saturation of [3 H]MRE 3008F20 binding to A3 adenosine receptors in human neutrophils (A) and HL60 cells (B). K D values were 2.3 ± 0.3 and 2.6 ± 0.4 nM and B max values were 430 ± 35 and 345 ± 31 fmol/mg of protein, respectively. Experiments were performed as described under Experimental Procedures. Data points are the means and vertical lines are the S.E.M. of four separate experiments performed in triplicate using human neutrophils from four different donors. Inset, Scatchard plot of the same data.
Affinities, expressed as KH, KL, and Ki values, of selected adenosine receptor agonists and antagonists to A3 receptors in human neutrophils
Affinities, expressed as KH, KL, and Ki values, of selected adenosine receptor agonists and antagonists to A3 receptors in HL60 cells

Competition curves of specific [3 H]MRE 3008F20 binding to human A3 adenosine receptors in human neutrophils by adenosine agonists (A) and antagonists (B). Curves are representative of a single experiment from a series of four independent experiments. Competition experiments were performed as described underExperimental Procedures.

Comparison between affinity values of [3H]MRE 3008F20 binding by adenosine ligands in human neutrophils and HL60 cells (n = 13, r = 0.99,P < 0.01).

van't Hoff plot showing the effect of temperature on the equilibrium binding association constant,K A = 1/K D of [3 H]MRE 3008F20. The plot is essentially linear in the temperature range investigated (4–30°C).
cAMP Assays.
To provide evidence for the coupling of A3 receptors to adenylyl cyclase, we determined the potencies of the most high affinity A3agonists in cAMP assays. Cl-IB-MECA and IB-MECA were able both to inhibit forskolin-stimulated cAMP levels with IC50 values in PMNs of 2.3 ± 0.2 and 5.5 ± 0.8 nM and in HL60 cells of 4.8 ± 0.5 and 7.2 ± 0.6 nM, respectively (Fig. 7, A and B). The selective A3 antagonist MRE 3008F20 antagonized the Cl-IB-MECA-mediated cAMP inhibition with an IC50 of 4.2 ± 0.8 and 6.3 ± 0.9 nM in PMNs and HL60 cells, respectively (Fig.8, A and B). DPCPX (100 nM), a selective blocker of A1 receptors, did not significantly affect 100 nM Cl-IB-MECA–induced inhibition of cAMP levels (35 ± 4% and 32 ± 3%, in the absence and in the presence of DPCPX, respectively), thus indicating that this effect was essentially A3-mediated. The selectivity of MRE 3008F20 for A3 versus A2A subtype, 165- or 483-fold according to the radioligand used ([3H]MRE 3008F20 or125I-AB-MECA, respectively), suggests that possibly some effects ascribed to A3 receptor activation may be mediated by A2A subtypes. We tested this hypothesis by studying the potency of MRE 3008F20 in the antagonism of cAMP levels A2A-stimulated in PMNs. cAMP accumulation induced by HE-NECA was inhibited by MRE 3008F20 with an IC50 of 280 ± 30 nM (Fig. 8C) suggesting that MRE 3008F20 was not equipotent antagonist of A2A and A3 receptors.

Inhibition curves of forskolin-stimulated cAMP levels by Cl-IB-MECA (●) and IB-MECA (▪) in human neutrophils (A) and HL60 cells (B). Data (means of four separate experiments performed in triplicate ± S.E.M.) are given as a percentage. The EC50 values for Cl-IB-MECA and IB-MECA were 2.3 ± 0.2 and 5.5 ± 0.8 nM, respectively, in neutrophils and 4.8 ± 0.5 and 7.2 ± 0.6 nM, respectively, in HL60 cells.

Effect of the adenosine antagonist MRE 3008F20 on the Cl-IB-MECA (100 nM) inhibition of forskolin-stimulated cAMP levels in human neutrophils (A) and HL60 cells (B). The IC50 values for MRE 3008F20 were 4.2 ± 0.8 and 6.3 ± 0.9 nM in neutrophils and in HL60 cells, respectively. Effect of the adenosine antagonist MRE 3008F20 on the HE-NECA (10 nM) stimulation of cAMP levels in human neutrophils (C). The IC50 value for MRE 3008F20 was 280 ± 30 nM. Data (means of four separate experiments performed in triplicate ± S.E.M.) are given as percentages.
Ca2+ Mobilization Studies.
To assess a possible involvement of A3 receptors in Ca2+ signaling we tested the effect of Cl-IB-MECA on Ca2+ mobilization. Cl-IB-MECA (30 μM) produced a rapid rise followed by a sustained increase in [Ca2+]i in both PMNs and HL60 cells (Fig. 9, A and D, respectively). In the absence of extracellular Ca2+ the initial [Ca2+]i rise was not abolished, although it was reduced, suggesting that Cl-IB-MECA was also able to induce a Ca2+ release from intracellular stores (Fig. 9, B and E). Although 200 μM NECA increased [Ca2+]i levels, the intensity of the Ca2+ elevation was definitively lower than that of Cl-IB-MECA in both PMNs and HL60 cells (data not shown). The EC50 of Cl-IB-MECA for the Ca2+ stimulation was investigated. However, in the presence of extracellular Ca2+ it was not possible, because of solubility limits of Cl-IB-MECA, to reach a plateau; thus, we focused our attention on the Ca2+ released from intracellular stores. In the absence of extracellular Ca2+, the EC50 values of Cl-IB-MECA were estimated to be 50 ± 4 and 70 ± 5 μM in PMNs and HL60 cells, respectively (Fig. 10, A and C). To further explore the role of A3 subtype in this response, considering that Cl-IB-MECA was effective in a range of doses 4 orders of magnitude higher than its K i value, we investigated the effect of increasing concentrations of MRE 3008F20 on [Ca2+]i release induced by a submaximal dose of Cl-IB-MECA in Ca2+ free medium. The [Ca2+]i elevation after 30 μM Cl-IB-MECA was inhibited by increasing concentrations of MRE 3008F20 (1–20 μM) with an IC50 of 3.4 ± 0.3 and 3.7 ± 0.4 μM in PMNs and HL60 cells, respectively (Fig.10, B and D). To investigate a possible involvement of other adenosine subtypes, we tested the effect of DPCPX, SCH 58261, and ZM 241385 (all at 0.1 μM), which should, on the basis of their binding affinity to human adenosine subtypes, occupy selectively A1, A2A, and A2A-A2B receptors, respectively. These ligands did not significantly alter the agonist-stimulated calcium response. However, because none of the antagonists used significantly inhibited binding to A2B very well at 0.1 μM, we tested both ZM 241385 and DPCPX at higher doses. ZM 241385 and DPCPX (both at 5 μM) antagonized 30 μM Cl-IB-MECA–induced Ca2+increase (26 ± 3 and 18 ± 2% of inhibition, respectively), even though the inhibition was less compared with that of 5 μM MRE 3008F20 (55 ± 5% of inhibition) in PMNs; comparable results were also obtained in HL60 cells. To determine whether the A3-induced Ca2+ signal was dependent on phospholipase C (PLC) activity, we tested the effect ofU73122 (5 μM), a membrane-permeable amino-steroid inhibiting PLC-dependent pathways. To study the effect of U73122 on the release of Ca2+ from intracellular stores, cells were stimulated in a Ca2+-free medium; under these conditions, we found that pretreatment of cells with 5 μM U73122 for 10 min did not alter the basal intracellular Ca2+concentration but completely inhibited the Cl-IB-MECA–induced Ca2+ release in both PMNs and HL60 cells, respectively (Fig. 9, C and F).

Effect of 30 μM Cl-IB-MECA on intracellular Ca2+ levels in the absence (A and D) or presence (B and E) of 0.5 mM EGTA in human neutrophils and HL60 cells, respectively. Effect of 5 μ M U73122 on Cl-IB-MECA-induced response, in Ca2+ -free medium, in neutrophils (C) and HL60 cells (F). Cells were prelabeled with Fura-2/AM, as described underExperimental Procedures. In Ca2+ -free experiments, the solution did not contain Ca2+ but rather 0.5 mM EGTA. The results are representative of a single experiment and are typical of four separate cell preparations.

A and C, dose-response curves for Ca2+mobilization in calcium-free medium in neutrophils and HL60 cells, respectively. Data are expressed as the percentage of the maximal response achieved in each experiment and are the mean of four separate experiments. The EC 50 values were 50 ± 4 and 70 ± 5 μM in neutrophils and HL60 cells, respectively. B and D, antagonism of 30 μM Cl-IB-MECA–induced calcium mobilization by MRE 3008F20 in human neutrophils and HL60 cells. The IC50 values of MRE 3008F20 were 3.4 ± 0.3 and 3.7 ± 0.4 μ M in neutrophils and HL60 cells, respectively.
Superoxide Anion Inhibition Evaluation.
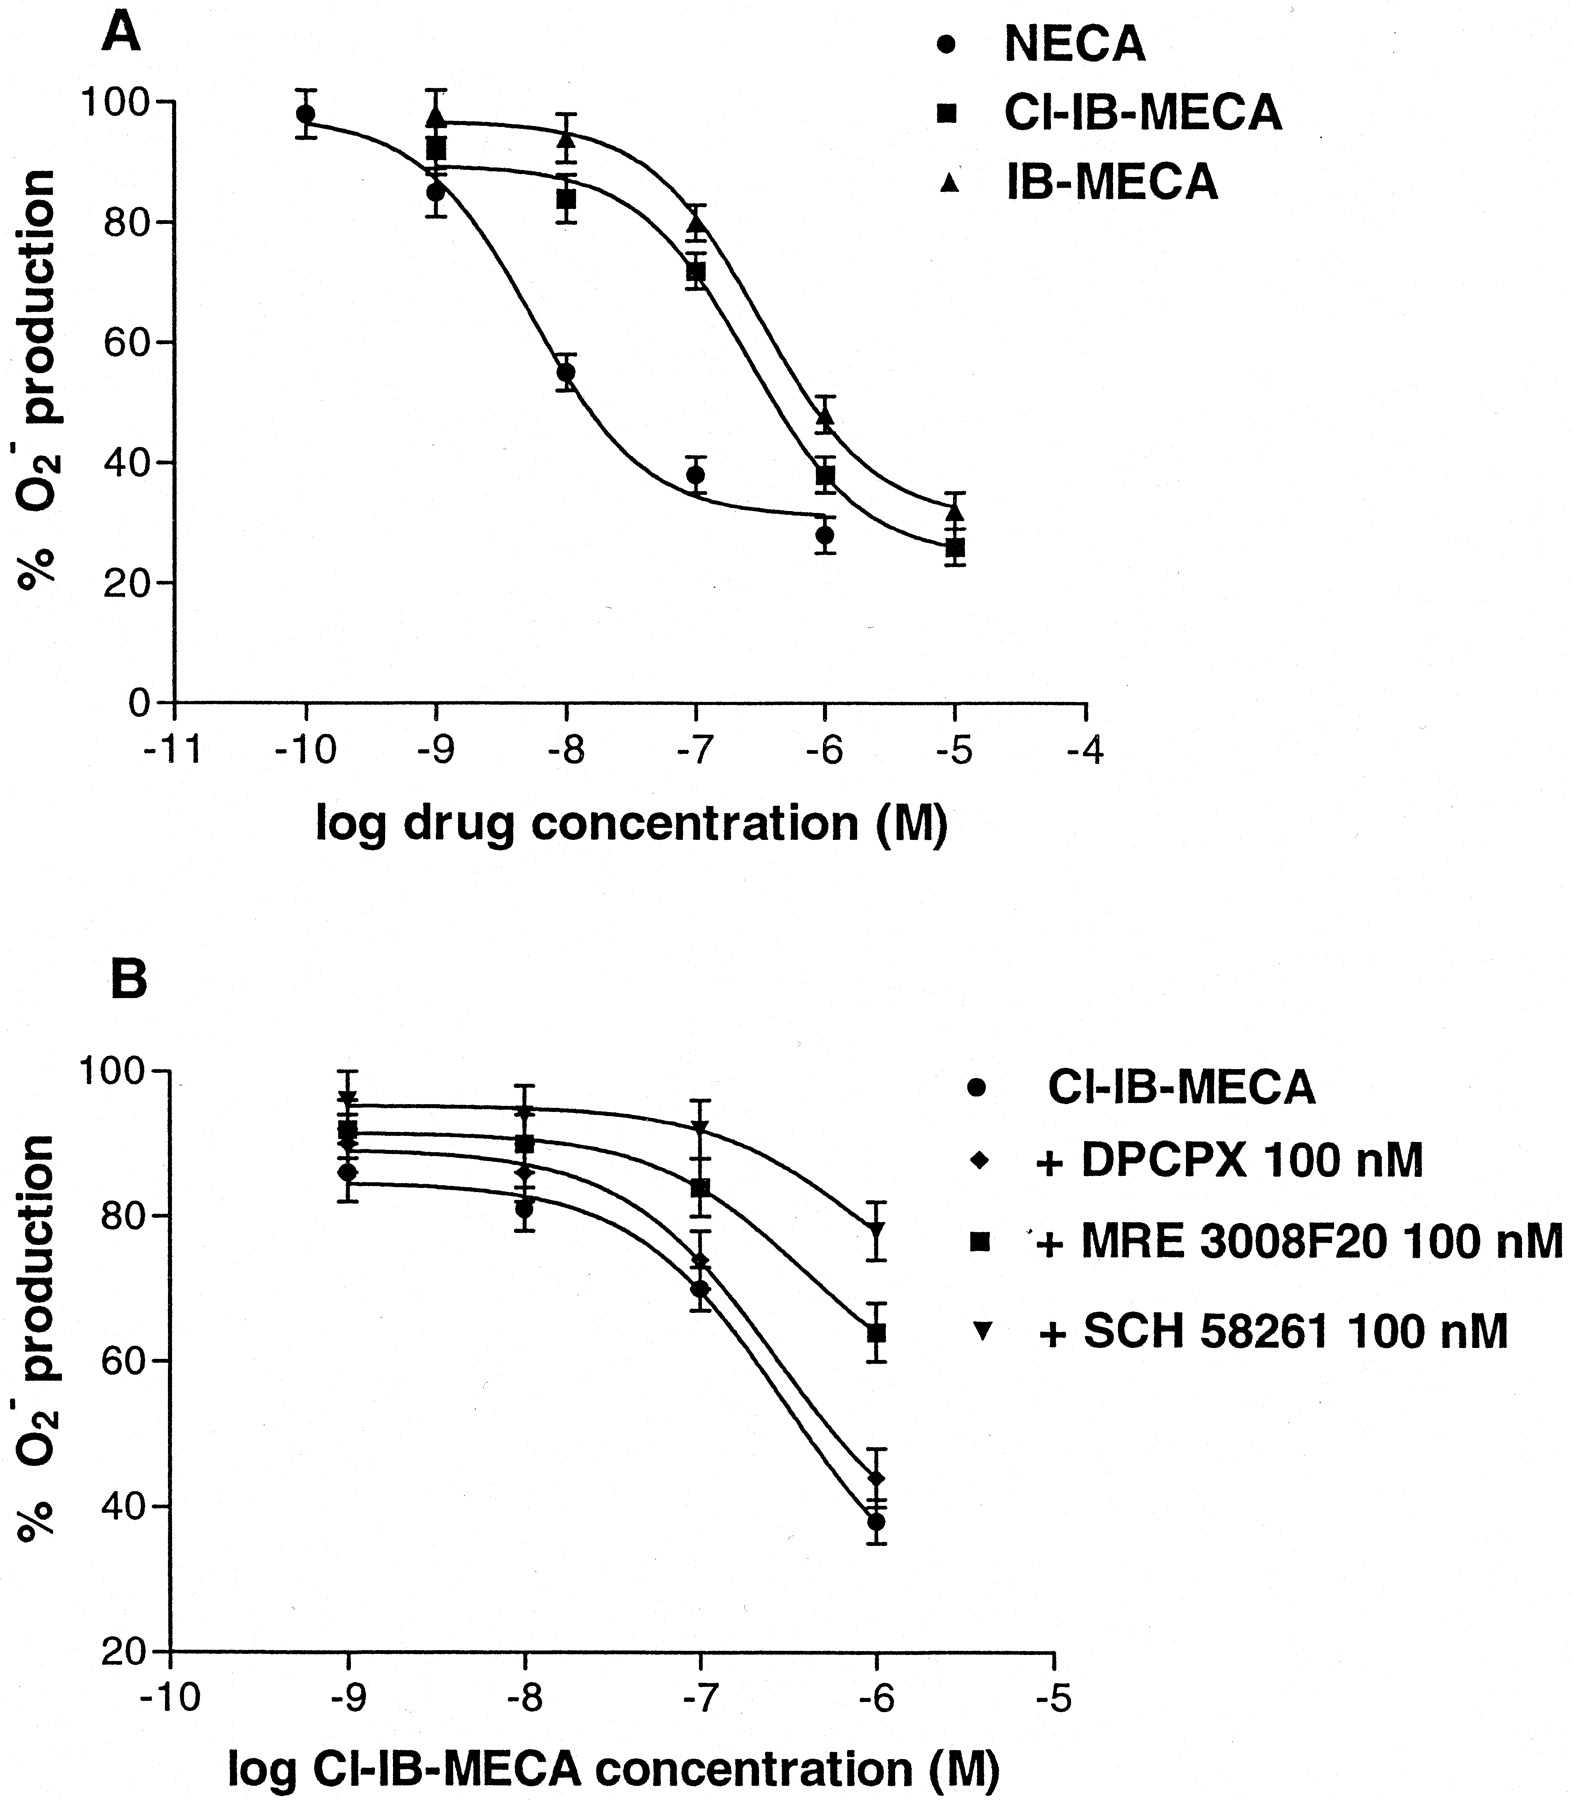
The effect of A3 agonists, such as Cl-IB-MECA and IB-MECA, on superoxide anion generation by fMLP-stimulated PMNs was evaluated. These compounds inhibited superoxide anion production in a dose-dependent manner, showing IC50 values of 450 ± 50 and 980 ± 90 nM, respectively. For comparison, the inhibitory effect of the nonselective agonist NECA, prevalently A2A-mediated, was reported (IC50 of 12 ± 3 nM) (Fig.11A). The Cl-IB-MECA–induced effect was blocked differentially by using selective adenosine antagonists for each adenosine subtype. Figure 11B shows that the A2A selective antagonist SCH 58261 (100 nM) was the most potent compound able to counteract the action of Cl-IB-MECA. 1 μM Cl-IB-MECA inhibited O2 −production of 62 ± 6% and SCH 58261 reduced this inhibition to 22 ± 5%. MRE 3008F20 (100 nM) affected the Cl-IB-MECA action, decreasing its inhibition to 35 ± 5%. Finally the A1 selective antagonist DPCPX, at a concentration of 100 nM, produced a small but insignificant block of the Cl-IB-MECA-induced effect (56 ± 5% of inhibition).

A, effect of adenosine agonists on O2 − production induced by fMLP in human neutrophils. The EC50 values for NECA, Cl-IB-MECA, and IB-MECA were 12 ± 3, 450 ± 50, and 980 ± 90 nM, respectively. B, antagonism of Cl-IB-MECA-inhibitory effect by 100 nM DPCPX (♦), 100 nM MRE 3008F20 (•), and 100 nM SCH 58261 (▾). Data ( means of four separate experiments performed in triplicate ± S.E.M.) are given as percentages.
Discussion
Adenosine, through its binding to A1 and A2A receptors, mediates a well-known opposing effect on various neutrophil functions, whereas the actions of A3 receptor activation are less extensively characterized. Although the presence of A3receptors have previously been demonstrated in neutrophil/monocyte progenitor HL60 cells (Kohno et al., 1996b) and PMNs (Bouma et al., 1997), there is a significant lack of evidence for the binding and postbinding events of this adenosine subtype. Furthermore, the function of A3 receptors and their role in inflammation is currently somewhat controversial and confusing, with variation among species (Linden, 2001). In the present study, we have characterized for the first time, from a pharmacological and biochemical point of view, the A3 subtype in both PMNs and HL60 cells by means of the selective A3 antagonist radioligand [3H]MRE 3008F20.
A set of experiments were designed to compare A3receptors in PMNs and HL60 cells. Figure 1 shows the gene expression of A3 subtype determined by nonquantitative RT-PCR experiments in both cell types. To quantify exactly the density of A3 adenosine receptor protein, saturation studies were performed. In PMNs, [3H]MRE 3008F20 labeled a single class of recognition sites with an affinity and binding capacity (K D, 2.3 ± 0.3 nM; B max, 430 ± 35 fmol/mg protein) not much different from those found in HL60 cells (K D, 2.6 ± 0.4 nM;B max, 345 ± 31 fmol/mg protein) and in agreement with K D data obtained from kinetic parameters. The pharmacology of A3receptors showed that reference adenosine ligands bound to hA3 receptors with a rank order of potency and affinity typical of the A3 subtype in both PMNs and HL60 cells (Varani et al., 2000). Agonist competition isotherms were biphasic and were best described by the existence of one high-affinity (K H) and one low-affinity (K L) agonist-receptor binding state. The high-affinity state constituted the minority of receptor sites (28 to 30%) in all cases, suggesting that the recognition of both high and low-affinity states of the [3H]MRE 3008F20 binding sites was not an artifact of a specific agonist. To determine whether the high-affinity state of the A3 receptor was linked to a guanine nucleotide regulatory protein, competition experiments of agonists in [3H]MRE 3008F20 binding assays were carried out in the presence of GTP, which converted the curves of agonists from biphasic to monophasic. The similarity betweenK i values determined in the presence of GTP and K L values obtained in the absence of GTP indicated a guanine nucleotide-mediated shift of the high-affinity binding sites to a low-affinity form, in agreement with that reported for hA3 receptors transfected in CHO cells (Varani et al., 2000). On the contrary, competition binding curves with antagonists, including the new class of substituted pyrazolo triazolo pyrimidines (Baraldi and Borea, 2000) were monophasic and did not change by addition of GTP. The high, statistically significant Spearman's rank correlation coefficient between affinity values of [3H]MRE 3008F20 binding by the adenosine ligands in PMNs and HL60 cells strongly suggested that the behavior of the A3 subtype was approximately identical in the two substrates examined. The forces driving the interactions of [3H]MRE 3008F20 binding with A3 receptors were investigated from a thermodynamic point of view. [3H]MRE 3008F20 binding to A3 receptors was enthalpy- and entropy-driven and very similar in PMNs and HL60 cells, in agreement with data obtained in CHO cells expressing hA3receptors (Varani et al., 2000). Thermodynamic data permit investigation at a molecular level on the role played during the binding by ligand substituents and by receptor amino acids. This could provide a possible tool in uncovering alterations in A3-related binding mechanisms in HL60 cells, which are a human leukemia cell line, compared with PMNs (as observed in other pathologies, Varani et al., 1999). However, because these leukemia cells are PMN precursors showing pharmacological, biochemical, and thermodynamic behavior very similar to that displayed by mature PMNs, it could be suggested that the receptor is similar in both cell types, as evident in other receptors seen on these cells (Klinker et al., 1996). To characterize this adenosine subtype from a functional point of view, we investigated the capability of A3 receptors expressed in PMNs and HL60 cells to modulate adenylyl cyclase activity. Cl-IB-MECA and IB-MECA inhibited cAMP levels showing EC50 values in the low nanomolar range, in agreement with theirK H affinity in binding experiments. Their inhibitory effect was potently antagonized by the selective A3 receptor antagonist MRE 3008F20, confirming the functional coupling of the A3 subtype to adenylyl cyclase in both PMNs and HL60 cells. Because A3 adenosine receptors are commonly coupled to PLC, we investigated the functional linkage of A3receptors with this pathway. Cl-IB-MECA increased the [Ca2+]i through a combination of Ca2+ release from intracellular stores and influx from the extracellular space. However, in the presence of extracellular Ca2+, at the range of doses investigated, the Cl-IB-MECA–induced Ca2+response did not saturate; we hypothesized that at doses ≥ 200 μM, unspecific mechanisms causing extracellular Ca2+ influx could probably be involved. Thus, the nature of the A3-mediated Ca2+ release from intracellular stores was explored. The high micromolar doses of Cl-IB-MECA and MRE 3008F20 in stimulating and blocking Ca2+ mobilization are not completely consistent with the involvement of an A3 receptor. Other mechanisms (e.g., stimulation of an adenosine receptor in addition to A3) might be involved. On this subject it is worth noting that 5 μM ZM 241385 and DPCPX decreased [Ca2+]i. Because these antagonists at 1 μM would occupy more than 90% of human A2B receptors, it is not possible to rule out the hypothesis that some of the responses to Cl-IB-MECA are mediated by A2B subtypes (Linden et al., 1999). Furthermore, a contribution of other mechanisms independent from the A3 receptor stimulation could not be excluded (Reeves et al., 2000). Finally, it is worth noting that a similar behavior of Cl-IB-MECA in Ca2+ stimulation has been found in almost all the other cell systems in which the A3-mediated Ca2+ response has been studied so far (Kohno et al., 1996a,b; Jacobson, 1998; Reeves et al., 2000; Reshkin et al., 2000; Shneyvays et al., 2000; Gessi et al., 2001; Suh et al., 2001). However, this is difficult to reconcile with the high affinity of this agonist in binding and cAMP inhibition assays. For these reasons, the mechanism by which high, nonselective doses of Cl-IB-MECA stimulate Ca2+ mobilization still remains unknown, even though the ability of U73122 to suppress the Cl-IB-MECA–stimulated Ca2+ irelease suggests the involvement of PLC activation. Activation of A3 receptors has been shown to mediate the inhibition of superoxide anion generation in human eosinophils and monocytes (Ezeamuzie and Philips, 1999; Broussas et al., 1999) and we have investigated this response in human neutrophils. The results obtained with subtype-selective adenosine ligands suggest that inhibition of oxidative burst was mainly dependent on A2A receptor activation, as recently confirmed by Sullivan (Sullivan et al., 2001) using new high affinity and potent A2A, 2-propynylcyclohexyl-5′-N-ethylcarboxamido adenosine derivatives. However, in our experimental conditions, an involvement of the A3 subtype could not be totally ruled out, even if it seemed minor. Our hypothesis is supported by the evidence that inhibition of superoxide anion generation was mediated by Cl-IB-MECA, which shows a selectivity of 190-fold for A3 versus A2A (Klotz, 2000), as well as NECA, which binds to all the adenosine subtypes and has the greatest affinity for A2A receptors. This effect was potently reduced by the A2A selective compound SCH 58261 but also decreased by the A3antagonist MRE 3008F20 (Fig. 11B). We admit that, in general, the moderate selectivity of A3 agonists also raises the possibility that effects ascribed to A3activation may be mediated by A2A; therefore, caution must be used in interpreting these results. In this case, however, the inhibition by the rather selective A3 antagonist MRE 3008F20 suggests that the involvement of A3 receptors in the reduction of oxidative burst could not be excluded, in accordance with the behavior of the same subtypes in the inhibition of neutrophil degranulation (Bouma et al., 1997). Numerous other examples of interaction between adenosine receptors have been reported and such interactions are likely to be the norm rather than the exception (Fredholm et al., 2000). In conclusion, our data indicate that the A3receptors in HL60 cells exhibit pharmacological characteristics similar to those of A3 receptors in PMNs, thus suggesting that this adenosine subtype is present and functional at an early stage during myeloid differentiation and that these cells provide a useful model for investigation of the biochemical pathways leading to A3 receptors activation. Another important finding of this work is that the involvement of A3 receptors in the inhibition of neutrophils fMLP-stimulated superoxide anion production might represent an additional mechanism by which adenosine could mediate anti-inflammatory effects, even if this response is essentially caused by A2A activation.
Footnotes
- Received July 16, 2001.
- Accepted November 8, 2001.
Abbreviations
- fMLP
- N-formyl-l-methionyl-l-leucyl-l-phenylalanine
- MRE 3008F20
- 5-N-(4-methoxyphenyl-carbamoyl)amino-8-propyl-2(2furyl)-pyrazolo-[4,3-e]-1,2,4-triazolo [1,5-c] pyrimidine
- PMN
- human polymorphonuclear neutrophil granulocyte
- Cl-IB-MECA
- N6-(3-iodo-benzyl)-2-chloro-adenosine-5′-N-methyluronamide
- IB-MECA
- N6-(3-iodo-benzyl) adenosine-5′-N-methyluronamide
- NECA
- 5′-N-ethyl-carboxamidoadenosine
- HE-NECA
- (2-hexynyl-5′-N-ethyl-carboxamidoadenosine)
- (R)-PIA
- R(−)-N6(2-phenyl-isopropyl)-adenosine
- (S)-PIA
- S(−)-N6(2-phenylisopropyl)adenosine
- DPCPX
- 1,3-dipropyl-8-cyclopentyl-xanthine
- CGS 15943
- 5-amino-9-chloro-2-(furyl)1,2,4-triazolo[1,5-c] quinazoline
- AM
- acetoxymethyl ester
- SCH 58261
- 7-(2-phenylethyl)-2-(2-furyl)-pyrazolo[4,3-e]-1,2,4-triazolo[1,5-c]-pyrimidine
- MRE 3055F20
- 5-N-(4-phenyl-carbamoyl)amino-8-propyl-2-(2-furyl)-pyrazolo[4,3-e]-1,2,4-triazolo[1,5-c]pyrimidine
- MRE 3062F20
- 5-N-(4-phenylcarbamoyl)amino-8-butyl-2-(2-furyl)-pyrazolo[4,3-e]1,2,4-triazolo[1,5-c]pyrimidine
- MRE 3048F20
- 5-N-(4-phenylcarbamoyl)amino-8-ethyl-2-(2-furyl)-pyrazolo[4,3-e] 1,2,4-triazolo[1,5-c]pyrimidine
- MRE 3046F20
- 5-N-(4 methylphenylcarbamoyl)amino-8-methyl-2-(2-furyl)-pyrazolo[4,3-e]-1,2,4-triazolo[1,5-c]pyrimidine
- U73122
- 1-[6-([(17β)-3-methoxyestra-1,3,5(10)-trien-17-yl]amino)hexyl]-1H-pyrrole-2,5-dione
- KRPG
- Krebs-Ringer phosphate buffer
- RT-PCR
- reverse transcription-polymerase chain reaction
- ZM 241385
- 4-(2-[7-amino-2-(2-furyl)[1,2,4]triazolo[2,3-a][1,3,5]triazin-5-ylamino]-ethyl)phenol
- PLC
- phospholipase C
- CHO
- Chinese hamster ovary
- hA3
- human A3 receptors
- The American Society for Pharmacology and Experimental Therapeutics


